Estimating 24-Hour Urine Sodium Level with Spot Urine Sodium and Creatinine
The 24-hr urine sodium excretion level was estimated based on the spot urine sodium, and the efficacy of the formula was validated to determine the status of low salt intake < 100 mEq Na/day. The 24-hr urine samples were collected from 400 patients. The 24-hr urine creatinine level was estimated with the use of three formulas: a newly derived Korean equation (E24UCR_K), and Tanaka (E24UCR_T) and Cockcroft-Gault (E24UCR_CG) equations. The correlation coefficients between the estimated and measured 24-hr urine creatinine for these three equations were 0.863, 0.846, and 0.896, respectively (All P < 0.001). After estimating the 24-hr urine sodium levels, the correlation coefficients between the estimated and measured 24-hr urine sodium levels were 0.466, 0.490, and 0.516, respectively (All P < 0.001). The sensitivity of three formulas to estimate the measured 24-hr urine sodium ≥ 100 mEq/day using the estimated amount ≥ 100 mEq/day was 84.3%, 87.6%, and 84.8%, respectively. In conclusion, the three equations used to estimate the 24-hr urine sodium content were useful to determine the status of low salt intake.
Keywords: 24-hr Urine Sodium; Spot Urine Sodium; Spot Urine Creatinine Ho Seok Koo,1 Yong Chul Kim,2
Shin Young Ahn,3 Se Won Oh,4 Suhnggwon Kim,5,6,7 Ho Jun Chin,3,6,8,9 and Jung Hwan Park10
1Department of Internal Medicine, Seoul Paik Hospital, Inje University College of Medicine, Seoul;
2Department of Internal Medicine, Armed Forces Capital Hospital, Seongnam; 3Department of Internal Medicine, Seoul National University Bundang Hospital, Seongnam; 4Department of Internal Medicine, Ilsan Paik Hospital, Inje University College of Medicine, Goyang; 5Department of Internal Medicine, Seoul National University College of Medicine, Seoul; 6The Research Institute of Salt and Health, Seoul; 7Seoul K-Clinic, Seoul;
8Department of Immunology, Seoul National University Postgraduate School, Seoul; 9Renal Institute, Seoul National University Medical Research Center, Seoul; 10Department of Internal Medicine, Research Institute of Medical Science, Konkuk University School of Medicine, Seoul, Korea Received: 7 May 2014
Accepted: 21 July 2014 Address for Correspondence:
Jung Hwan Park, MD
Department of Internal Medicine, Konkuk University Hospital, 120-1 Neungdong-ro, Gwangjin-gu, Seoul 143-729, Korea Tel: +82.2-2030-7528, Fax: +82.2-2030-7748 E-mail: pjh@kuh.ac.kr
Funding: This research was supported by a grant (13162MFDS104) from the Ministry of Food and Drug Safety in 2013.
http://dx.doi.org/10.3346/jkms.2014.29.S2.S97 • J Korean Med Sci 2014; 29: S97-102
INTRODUCTION
WHO has reported ischemic heart disease and stroke as the first and second leading causes of death worldwide, accounting for 21.8% of all deaths (1). The mortality rate for these two causes has increased over the past decade (1). Hypertension is one of the main risk factors for cardiovascular disease and cerebrovascular disease (2). Obesity, diabetes, old age, low potassium intake, and high salt intake are the known risk factors for incident hypertension (3). High salt intake has been reported as a cause of hyper- tension in many studies, and also in animal and epidemiological studies (4-6). There- fore, reducing the salt intake is very important for human health as it decreases the prevalence of hypertension. To reduce the salt intake, we should know our salt intake.
The salt intake can be checked by two methods: remembering the food items con- sumed over the previous 24 hr and then calculating the salt intake, and calculating the salt intake based on the sodium excreted in the urine, which is more accurate than the 24-hr recall method. Therefore, the 24-hr urine sodium level is the ‘gold standard’ meth- od for estimating the salt intake. However, the 24-hr urine test is too cumbersome to administer. The urine collected can be easily lost from the bag, and it is also inconve- nient to carry around a bag of urine all day. The result of urine collection can be differ- ent between weekdays and weekend. People may be considered to be sick when they collect urine in their office. Research has therefore been focused on estimating the salt intake using the spot urine test (7, 8). However, no study has reported the method for estimating the salt intake of Koreans using the spot urine test. Therefore, the present study aimed to estimate the 24-hr urine sodium excretion level by measuring the spot urine sodium and creatinine levels, and to validate the efficacy of the formula for deter- mining the status of low salt intake < 100 mEq Na/day in Koreans.
MATERIALS AND METHODS Population
All data were collected retrospectively by accessing the electri- cal medical records of Seoul National University Hospital. Among 1,363 outpatients whose serum creatinine and 24-hr urinary sodium were measured when they visited the outpatient clinic, the 24-hr urine samples were collected from 400 outpatients based on the following inclusion criteria: we defined appropri- ate urine collection as the ratio of measured 24-hr urinary cre- atinine to estimated 24-hr urinary creatinine of 0.75-1.25, and patients with ratio in this range were included. Also, we exclud- ed patients who had been prescribed diuretics or fluid therapy, which may influence the 24-hr urinary sodium excretion.
Definition
CKD was defined as 24-hr urine protein excretion of 150 mg/day (proteinuria) or more and/or estimated GFR of < 60 mL/min/
1.73 m2 (9). Estimated glomerular filtration rate was calculated by using the Modification of Diet in Renal Disease Study (MD- RD) Equation (10).
Analysis method
The 24-hr urine creatinine level was estimated based on the spot random urine creatinine. We estimated the 24-hr urine creati- nine level by using the following three equations: the Tanaka equation (8), E24UCR_T: 24-hr urine creatinine level (mg) = -2.04 × age (yr)+14.89 × body weight (kg)+16.14 × height (cm)- 2244.45; the Cockcroft-Gault (CG) equation (11), E24UCR_CG:
24-hr urine creatinine level (mg) = {8–[0.2 × age (yr)]} × weight (kg), (if women, × 0.85); and the Korean equation, (E24UCR_K) which we formulated based on the age, weight, and height by the linear regression model used by Tanaka (8).
These three equations were derived from the estimated 24-hr urine creatinine and the ratio of spot urine sodium and creati- nine by the method reported by Tanaka (8).
Statistics
We calculated the correlation coefficients between the estimat- ed and measured values for 24-hr urine creatinine and sodium and fitted the two variables by linear regression analysis. We used the Bland-Altman method to measure agreement between the measured and estimated values. To estimate the precision rate of estimated values, we calculated the interquartile range (IQR);
and to estimate the accuracy, we calculated the proportion of estimates within 30% deviation of measured sodium (P30) and Root Mean Square Error (RMSE). We also calculated the sensi- tivity, specificity, and probability of area under curve (AUC) with a receiver operating characteristic (ROC) to predict 24-hr urine sodium > 100 mEq/day by using the estimated values. Statisti- cal analyses were performed with SPSS version 20.0 for Win-
dows (SPSS Inc., Chicago, IL, USA). Two-sided P values were used for all statistical analyses. A P value < 0.05 was considered statistically significant.
Ethics statement
This study was approved by the institutional review board of the Seoul National University Hospital (IRB No. H-1306-030-496).
The study was exempted from the requirement of informed con- sent by the board.
RESULTS
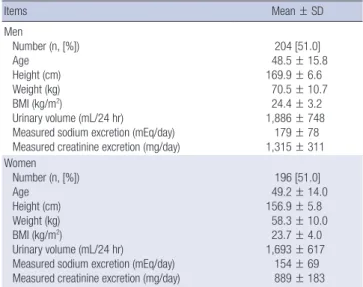
Study participants and their baseline characteristics The study group comprised 204 men and 196 women (age 48.5
± 15.8 yr, 49.2 ± 14.0 yr, respectively). The mean urine volume per day was 1,886 ± 748 mL in men and 1,693 ± 617 mL in wom- en. The measured sodium excretion per day was 179 ± 78 mEq in men and 154 ± 69 mEq in women. The measured creatinine excretion per day was 1,315 ± 311 mg in men and 889 ± 183 in women (Table 1).
The E24UCR_K equation for estimating the 24-hr urine creatinine level
Using a linear regression model for age, weight, and height, we derived an equation to estimate the 24-hr urine creatinine, E24- UCR_K = -7.428 × age (yr)+10.372 × weight (kg)+15.631 × height (cm)-1,234.785 (P < 0.001) (Table 2).
The correlation between the measured and estimated 24-hr urine creatinine levels
There was an association between the measured and estimated 24-hr urine creatinine levels using all three equations. The cor- relation coefficient was 0.846 by E24UCR_T, 0.896 by E24UCR_
Table 1. Baseline patient characteristics
Items Mean ± SD
Men
Number (n, [%]) Age
Height (cm) Weight (kg) BMI (kg/m2)
Urinary volume (mL/24 hr)
Measured sodium excretion (mEq/day) Measured creatinine excretion (mg/day)
204 [51.0]
48.5 ± 15.8 169.9 ± 6.6
70.5 ± 10.7 24.4 ± 3.2 1,886 ± 748 179 ± 78 1,315 ± 311 Women
Number (n, [%]) Age
Height (cm) Weight (kg) BMI (kg/m2)
Urinary volume (mL/24 hr)
Measured sodium excretion (mEq/day) Measured creatinine excretion (mg/day)
196 [51.0]
49.2 ± 14.0 156.9 ± 5.8
58.3 ± 10.0 23.7 ± 4.0 1,693 ± 617 154 ± 69 889 ± 183 Values are expressed as mean ± SD.
Table 2. Estimation of 24-hr urine creatinine in Koreans
Parameters B t-value 95% CI for B P value
(Constant) -1,234.785 -6.788 -1,592.423 -877.148 < 0.001 Age (yr) -7.428 -12.698 -8.578 -6.278 < 0.001 Height (cm) 10.372 8.615 8.005 12.739 < 0.001 Weight (kg) 15.631 18.409 13.962 17.301 < 0.001 R2= 0.768; B, coefficient B.
CG, and 0.863 by E24UCR_K (P < 0.001) (Fig. 1).
The correlation between the measured and estimated 24- hr urine sodium levels
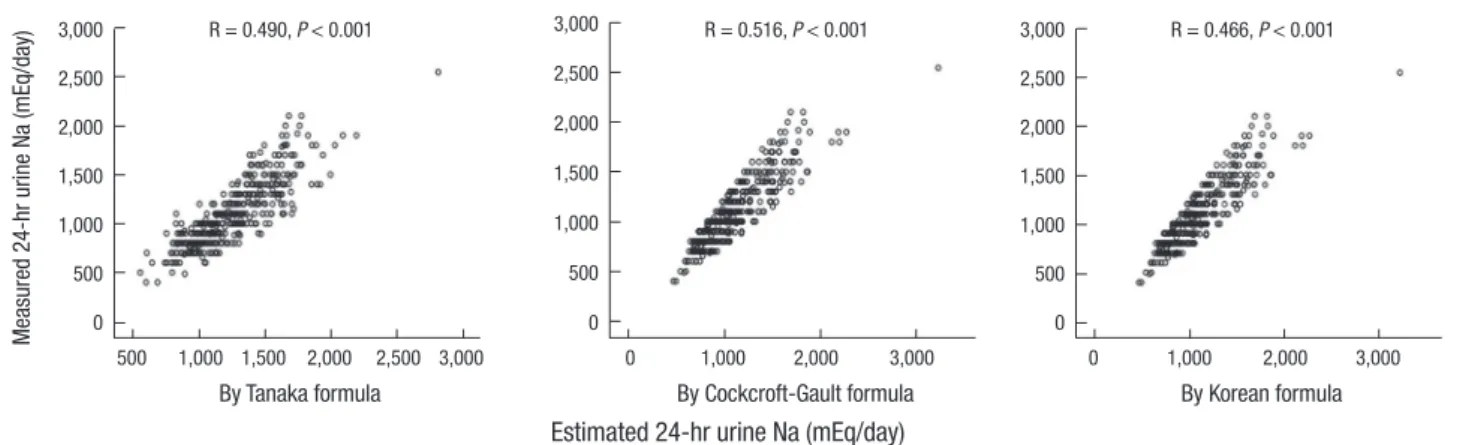
The three derived formulas to estimate 24-hr urine sodium level were as follows: E24UNA_T = 21.98 × XNA0.392, E24UNA_CG = 33.409 × XNA0.347, and E24UNA_K = 28.985 × XNA0.346. XNA was calculated as follows: XNA = {spot urine sodium (mEq/L)/[10 × spot urine creatinine (mg/dL)]} x estimated 24-hr urine creati- nine level by each equation. There was an association between the measured and estimated 24-hr urine sodium levels using the three equations The correlation coefficient was 0.490 by E24U- CR_T, 0.516 by E24UCR_CG, and 0.466 by E24UCR_K (P < 0.001) (Fig. 2).
Validation of the adequacy of the estimated 24-hr urine sodium compared with the measured 24-hr urine sodium level
The median value for the difference between the measured and estimated 24-hr urine sodium levels was -12.4 mEq/day by E24- UCR_T, 3.3 mEq/day by E24UCR_CG, and 9.8 mEq/day by E24- UCR_K. The preciseness expressed as IQR, RMSE, and P30 was
Table 3. Association between measured and estimated 24-hr urine sodium levels
Formula Median bias
(mEq/day) (95% CI) IQR
(mEq/day) RMSE
(mEq/day) P30 (%) Tanaka formula
GFR ≥ 60 GFR 30-59 GFR < 30
-12.4 (-30.3~-17.5) -17.2 (-35.0~-20.4) -6.6 (-40.5~-0.2) -6.6 (-14.9~-16.0)
27 25 23 26
69 70 75 48
54.3 52.8 58.5 60.0 CG formula
GFR ≥ 60 GFR 30-59 GFR < 30
3.3 (-14.0~-1.5) 2.2 (-18.2~-3.7) 4.7 (-25.5~13.2) 4.9 (-1.2~29.6)
24 25 22 20
64 65 70 49
58.0 58.4 52.8 62.5 Korean formula
GFR ≥ 60 GFR 30-59 GFR < 30
9.8 (-7.9~5.1) 6.7 (-12.3~2.6) 12.5 (-20.4~20.3) 10.4 (7.1~39.0)
28 28 25 24
66 66 73 54
57.5 58.7 50.9 57.5
*GFR in mL/min/1.73 m2, CG, Cockcroft-Gault; Bias, estimated 24-hr urine Na – mea- sured 24-hr urine Na (mEq/day). IQR, interquartile range; RMSE, root mean square error; P30, proportion of estimates within 30% deviation of measured sodium.
Fig. 2. Correlation between sodium excretion estimated in spot urine samples and sodium excretion assessed in 24-hr urine samples.
Measured 24-hr urine Na (mEq/day)
By Tanaka formula
500 1,000 1,500 2,000 2,500 3,000 3,000
2,500 2,000 1,500 1,000 500 0
R = 0.490, P < 0.001
By Cockcroft-Gault formula 0 1,000 2,000 3,000 3,000
2,500 2,000 1,500 1,000 500 0
R = 0.516, P < 0.001
By Korean formula 0 1,000 2,000 3,000 3,000
2,500 2,000 1,500 1,000 500 0
R = 0.466, P < 0.001
Estimated 24-hr urine Na (mEq/day)
Fig. 1. Correlation between creatinine excretion estimated in spot urine samples and creatinine excretion assessed in 24-hr urine samples.
Measured 24-hr urine creatinine (mg/day)
By Tanaka formula
500 1,000 1,500 2,000 2,500 3,000 3,000
2,500 2,000 1,500 1,000 500 0
R = 0.846 2, P < 0.001
By Cockcroft-Gault formula 0 1,000 2,000 3,000 3,000
2,500 2,000 1,500 1,000 500 0
R = 0.896, P < 0.001
By Korean formula 0 1,000 2,000 3,000 3,000
2,500 2,000 1,500 1,000 500 0
R = 0.863, P < 0.001
Estimated 24-hr urine creatinine (mg/day)
Table 4. Prediction accuracy between the measured and estimated values Accuracy CG formula Korean formula Tanaka formula
Sensitivity 84.8% 84.3% 87.6%
Specificity 68.4% 61.1% 53.8%
P value < 0.001 < 0.001 < 0.001
similar among the three equations (Table 3). In the Bland-Alt- man plot, the probability that the difference between the mea- sured and estimated values existed within -1.96 SD and+1.96 SD of the mean value was 95.0% (380/400) in E24UCR_T, 95.5%
(382/400) in E24UCR_CG, and 94.5% (378/400) in E24UCR_K (Fig. 3).
The prediction of measured 24-hr urine sodium level,
>100 mEq/day, with the estimated 24-hr urine sodium level, >100 mEq/day
The sensitivity of formulas to estimate the measured 24-hr urine sodium ≥ 100 mEq/day with the estimated amount ≥ 100 mEq/
day was 87.6% for E24UNA_T, 84.8% for E24UNA_CG, and 84.3%
for E24UNA_K. However, the specificity was the highest for E24- UNA_CG (Table 4). The AUC calculated by using the ROC curve was 0.793 in E24UNA_T, 0.800 in E24UNA_CG, and 0.782 in E24- UNA_K (All P < 0.001) (Fig. 4).
DISCUSSION
In order to estimate the amount of 24-hr urine sodium using the spot urine test, some assumptions are necessary. First, 24- hr urine specimen was collected without omission and the fac- tors that may affect sodium excretion were excluded. Second, the actual amount of creatinine in the urine collected for 24 hr was equal to the estimated creatinine excretion from age and body weight. Third, the 24-hr urinary sodium to 24-hr creatinine ratio and the spot urine sodium to spot urine creatinine ratio are constant. Each assumption has to be considered.
According to the first assumption, the 24-hr urine collection method is useful to determine the precise sodium intake, but it is difficult to collect urine without any loss of urine (12). To date, most of the studies of sodium intake in Korea have used the 24- hr recall method for measuring the sodium intake. Only a few studies have used the 24-hr urine collection method, in which there was no mention about the accuracy of urine collection (13). In our study, we excluded the patients who had been pre- scribed diuretics and fluid therapy, which could have an effect on sodium excretion. Also, we compared the 24-hr urine creati- nine estimated by the Cockcroft-Gault equation with the actual 24-hr urine creatinine level. In order to increase the accuracy, we selected the value of 24-hr urine collection, in which the ra- tio of measured value to estimated value was within 0.75-1.25.
But, there are some issues in our study. The study subjects were patients who visited the tertiary hospital, and we did not check the amount of sodium in their diet, exercise, and urine collec- tion time, which could have an effect on sodium excretion. To generalize the equation, along with addressing these issues, Fig. 3. Bland-Altman plot for the difference between the measured and estimated sodium excretion levels.
Estimated Na excretion-measured Na excretion (mEq/day)
By Tanaka formula
0 100 200 300 400
200 100 0 -100 -200 -300 -400
+1.96 SD
-1.96 SD Mean 103.7 -23.9 -132.8
By Cockcroft-Gault formula
0 100 200 300
200 100 0 -100 -200 -300
By Korean formula
0 100 200 300 400
200 100 0 -100 -200 -300
+1.96 SD +1.96 SD
117.2 128.4
Mean Mean
-7.8 -1.4
-1.96 SD -1.96 SD
-132.8 -131.2
Mean of estimated Na excretion and measured Na excretion
Fig. 4. Area under the ROC curve for predicting the 24-hr urine sodium level in pa- tients whose sodium level was more than 100 mEq/L.
Sensitivity
1-Specificity
0.0 0.2 0.4 0.6 0.8 1.0 1.0
0.8
0.6
0.4
0.2
0.0
E24UNA_CG E24UNA_K E24UNA_T
All P < 0.001 E24UNA_T AUC = 0.793 E24UNA_CG AUC = 0.800 E24UNA_K AUC = 0.782
there must be an effort to collect urine completely by using the method of para-amino benzoic acid recovery as in the other survey (14).
Second, the actual 24-hr urine creatinine in the urine collect- ed was equal to the 24-hr urine creatinine estimated. Creatinine is the end product of creatine metabolism in the muscle and is excreted through the kidneys. The urine creatinine excretion is proportional to the muscle mass of the subject and is almost unaffected by the diet. Therefore, the amount of urine creatinine was used for precise judgment of urine collection (15). But, the difference between the estimated value provided by the Cock- croft-Gault equation and the actual value in the urine collected was already known. This difference originated from the differ- ence in the physique of species and/or urine creatinine excre- tion per kg. To date, the Cockcroft-Gault equation is widely used after the correction, but there seem to be some problems in ap- plying it to the general Korean population (16). In our study, we used two formulas for estimating creatinine excretion along with the Cockcroft-Gault equation. There was no difference in the accuracy of the three equations. The production of creatinine in the body is influenced by the muscle mass and dietary habits.
When there is a decrease in the muscle mass and/or an increase in the age, there is a decrease in the production of creatinine.
When people have a high protein diet, the production of creati- nine is increased. Also, drugs such as trimethoprim, cimetidine can block proximal tubular creatinine excretion. Antibiotics can have an effect on the microflora in the colon in which the ex- cretion of creatinine is affected, and then the creatinine level is increased (17). In our study, we excluded the factors that can have effect on sodium excretion, but we could not control the factors that can have an effect on creatinine excretion.
Third, the 24-hr urinary sodium to 24-hr creatinine ratio and the spot urine sodium to spot urine creatinine ratio are constant.
Usually, urine creatinine excretion is proportional to the muscle mass of the subject and is almost unaffected by the diet; there- fore, the characteristics of creatinine support this assumption.
But, this may not be true for sodium. The velocity of excretion of sodium per day is not constant, and it can change according to the position, exercise, diet, and hemodynamic factors (18).
Also, it is impossible to measure the amount of extrarenal ex- cretion such as that in stools and sweat, and therefore, we could not derive the formula without this assumption. Also, the amount excretion of sodium can be different according to the glomeru- lar filtration rate. Therefore, we could increase the accuracy by stratifying according to the glomerular filtration rate when com- paring the estimated value and the actual value.
WHO recommends a daily salt intake of less than 5 grams (sodium 2,000 mg). But no study has examined the usefulness of the formula for estimating the sodium level proposed in this guideline. In this study, we compared the estimated and mea- sured sodium intake based on 100 mEq/L of sodium (2,300 mg)
and assessed the equations using the AUC values. According to the results, E24UNA_CG showed the highest accuracy, and both E24UNA_T and E24UNA_K also showed significant accuracy.
Thus, all of the three formulas can be used in accordance with the standard recommended guideline and also as an indicator of the current salt intake for determining the appropriate low salt diet.
There may be some limitations to this study because of lack of strict control of factors that have an effect on sodium excre- tion and the retrospective study design. In the future, a prospec- tive study is needed to prove the usefulness of these derived equ- ations.
In conclusion, E24UNA_K, E24UNA_CG, and E24UNA_T formulas, which were derived from sodium concentrations in spot urine, are useful for predicting 24-hr sodium intake and there is no difference among the formulas for predicting sodi- um over intake.
DISCLOSURE
All of the authors have no potential conflicts of interest to dis- close.
ORCID
Ho Seok Koo http://orcid.org/0000-0001-7856-8083 Ho Jun Chin http://orcid.org/0000-0003-1185-2631 Jung Hwan Park http://orcid.org/0000-0002-8737-0084 REFERENCES
1. World Health Organization. WHO media centre. Available at http://who.
int/mediacentre/factsheets/fs310/en/index.html [accessed on 31 Mar 2014].
2. Brundtland GH. From the World Health Organization. Reducing risks to health, promoting healthy life. JAMA 2002; 288: 1974.
3. Floege J, Johnson RJ, Feehally J. Comprehensive clinical nephrology. Phil- adelphia, PA: Saunders/Elsevier, 2010.
4. Intersalt: an international study of electrolyte excretion and blood pres- sure. Results for 24 hour urinary sodium and potassium excretion. Inter- salt Cooperative Research Group. BMJ 1988; 297: 319-28.
5. Denton D, Weisinger R, Mundy NI, Wickings EJ, Dixson A, Moisson P, Pingard AM, Shade R, Carey D, Ardaillou R, et al. The effect of increased salt intake on blood pressure of chimpanzees. Nat Med 1995; 1: 1009-16.
6. Forte JG, Miguel JM, Miguel MJ, de Pádua F, Rose G. Salt and blood pres- sure: a community trial. J Hum Hypertens 1989; 3: 179-84.
7. Kawano Y, Tsuchihashi T, Matsuura H, Ando K, Fujita T, Ueshima H.
Report of the Working Group for Dietary Salt Reduction of the Japanese Society of Hypertension: (2) assessment of salt intake in the management of hypertension. Hypertens Res 2007; 30: 887-93.
8. Tanaka T, Okamura T, Miura K, Kadowaki T, Ueshima H, Nakagawa H, Hashimoto T. A simple method to estimate populational 24-h urinary
sodium and potassium excretion using a casual urine specimen. J Hum Hypertens 2002; 16: 97-103.
9. K/DOQI clinical practice guidelines for chronic kidney disease: evalu- ation, classification, and stratification. Am J Kidney Dis 2002; 39: S1-266.
10. Levey AS, Coresh J, Greene T, Marsh J, Stevens LA, Kusek JW, Van Lente F. Expressing the Modification of Diet in Renal Disease Study equation for estimating glomerular filtration rate with standardized serum creati- nine values. Clin Chem 2007; 53: 766-72.
11. Cockcroft DW, Gault MH. Prediction of creatinine clearance from serum creatinine. Nephron 1976; 16: 31-41.
12. Holbrook JT, Patterson KY, Bodner JE, Douglas LW, Veillon C, Kelsay JL, Mertz W, Smith JC Jr. Sodium and potassium intake and balance in adults consuming self-selected diets. Am J Clin Nutr 1984; 40: 786-93.
13. Kim HH, Lee YK. Analysis of presumed sodium intake of office workers using 24-hour urine analysis and correlation matrix between variables.
Korean J Nutr 2013; 46: 26-33.
14. He FJ, Pombo-Rodrigues S, Macgregor GA. Salt reduction in England from 2003 to 2011: its relationship to blood pressure, stroke and ischaemic heart disease mortality. BMJ Open 2014; 4: e004549.
15. Bingham SA, Cummings JH. The use of creatinine output as a check on the completeness of 24-hour urine collections. Hum Nutr Clin Nutr 1985;
39: 343-53.
16. Kang WH, Seo GH, Lee BH, Kim B, Lee SK, Oh DJ, Huh W, Kim YG, Kim DJ, Oh HY. Estimation of creatinine clearance with serum creatinine in Korean patients. Korean J Nephrol 1998; 17: 866-71.
17. Perrone RD, Madias NE, Levey AS. Serum creatinine as an index of re- nal function: new insights into old concepts. Clin Chem 1992; 38: 1933- 53.
18. Shemin D, Dworkin LD. Sodium balance in renal failure. Curr Opin Nephrol Hypertens 1997; 6: 128-32.