Poisoning-induced Out-of-Hospital Cardiac Arrest and Outcomes according to Poison Agent
It is unclear whether specific agent groups are associated with outcomes in cases of poisoning-induced out-of-hospital cardiac arrest (P-OHCA). The study population comprised cases of confirmed P-OHCA drawn from the national out-of-hospital cardiac arrest (OHCA) registry (2008–2013). Exposures were categorized into five groups according to the International Classification of Disease, 10th version: group 1, prescribed drugs;
group 2, vapors and gases; group 3, pesticides; group 4, alcohol and organic solvents; and group 5, other poisons. The outcome was survival to discharge and good neurological recovery. Adjusted odds ratios (aORs) and 95% confidence intervals (CIs) were calculated to test the association between specific groups and outcomes. A total of 2,083 patients were analyzed; group 1 (10.3%), group 2 (23.6%), group 3 (52.9%), group 4 (1.4%), and group 5 (13.2%). The survival to discharge and good neurological recovery rates were 3.3%/1.3% for all patients, 10.3%/5.6% (group 1), 6.9%/3.4% (group 2), 2.4%/0.4%
(group 3), 2.2%/1.0% (group 4), and 3.3%/2.4% (group 5) (all P < 0.001). The aORs (95%
CIs) of groups 2–5 compared with group 1 for survival to discharge were 0.47 (0.09–2.51), 0.34 (0.17–0.68), 0.33 (0.14–0.77), and 0.31 (0.13–0.77), respectively. The odds ratios (95% CIs) for good neurological recovery were significant only in group 1, the pesticides group (0.07 [0.02–0.26]) and were not significant in the other groups. P-OHCA outcomes differed significantly among the poisoning agent groups. The pesticides group showed the worst outcomes, followed by the group of vapors or gases.
Keywords: Poison; Cardiac Arrest; Survival; Pesticides; Vapors; Gases Minjee Kim,1 Sang Do Shin,2
Seungmin Jeong,3 Young Ho Kwak,2 and Gil Joon Suh2
1Department of Medicine, Seoul National University College of Medicine, Seoul, Korea; 2Department of Emergency Medicine, Seoul National University College of Medicine, Seoul, Korea; 3Department of Preventive Medicine, Seoul National University Graduate School of Public Health, Seoul, Korea Received: 20 March 2017
Accepted: 17 September 2017 Address for Correspondence:
Sang Do Shin, MD, PhD
Department of Emergency Medicine, Seoul National University College of Medicine, 103 Daehak-ro, Jongno-gu, Seoul 03080, Korea
E-mail: sdshin@snu.ac.kr
Funding: The study was supported by the Korea Centers for Disease Control and Prevention and approved to use the national out-of-hospital cardiac arrest registry (grant No. 2009- E00543-00, 2010-E33022-00, 2011-E33004-00, 2012-E33010- 00, 2013-E33015-00, 2014-E33011-00, and 2016-E33012-00).
https://doi.org/10.3346/jkms.2017.32.12.2042 • J Korean Med Sci 2017; 32: 2042-2050
INTRODUCTION
Out-of-hospital cardiac arrests (OHCAs) are a major problem that has become a global health burden. The global average in- cidence of emergency medical services (EMSs)-assessed OHCA is 55 adults per 100,000 person-years. The incidence varies among continents, from 52.5 for Asia to 112.9 for Australia (1). OHCAs of non-cardiac etiology vary in their epidemiologic features, with different incidence rates and outcomes (2-4).
One of the major non-cardiac etiologies of OHCAs is poison- ing. An Asian country reported an incidence of OHCAs with non-cardiac origin of 28% (10.58 per 100,000 person-years). Of these, cases caused by intoxication represented 6.7%. The sur- vival to discharge rate for OHCAs with a poisoning etiology was approximately 2.7%, which is lower than that of other etiologies, such as asphyxia (8.5%) and drowning (2.9%) (5). In other coun- tries, the incidence of poisoning-induced out-of-hospital cardi- ac arrest (P-OHCA) varies from 1.8% in Sweden to 3.1% in Fin- land (6-8). Based on many case reports, some of these poison- ing cases occurred by chance, and some were intended to in- duce OHCA as a form of suicide (9).
P-OHCAs may be preventable through primary prevention
interventions. To avoid fatal exposures to poison or to prevent suicide by drugs, the causative agents should be identified and tested for their associations with patient outcomes. Previous studies have found that the causative agents of P-OHCA were associated with the survival to admission and survival to dis- charge rates (10). However, in many cases, the causative agent was unknown (34.6%) or the classification of the agents was in- sufficient, which can lead to difficulty making decisions regard- ing an emergency antidote. Antidote therapy and gastrointesti- nal decontamination that are targeted to a specific agent will save more lives in cases of P-OHCA (11-13).
It is unclear whether specific agent groups are associated with outcomes in P-OHCA. The study aimed to classify poisons into specific agent groups and to compare the outcomes for these groups.
MATERIALS AND METHODS Study setting
Most OHCA patients are transported by single-tiered, govern- ment-based public EMS programs from the sixteen provincial headquarters of the national fire department (14). The Korean Emergency & Critical Care Medicine
2017-03-16 https://crossmark-cdn.crossref.org/widget/v2.0/logos/CROSSMARK_Color_square.svg
EMS is available 24 hours a day, 365 days a year, and provides a basic to intermediate level of ambulance services to approxi- mately 50 million people residing in an area of approximately 100,000 km2. There were approximately 1,400 ambulance sta- tions throughout the nation in 2010 (15). In the case of a patient with P-OHCA, ambulance crews administer cardiopulmonary resuscitation (CPR) at the scene and during transport with au- tomatic external defibrillation. The resuscitation should be con- tinued until the declaration of death by a physician (16). Grade 1 emergency medical technicians can offer advanced airway techniques, including airway insertion, endotracheal intuba- tion and laryngeal mask airway insertion. They also can access a venous line and provide 0.9% normal saline solution under direct medical control. However, medications for advanced car- diac life support are usually not available (17). Antidote therapy and gastric lavage, which are necessary specifically for poisoned patients, cannot be provided in the pre-hospital stage. Ambu- lance crews collect information about the causative agent and the time/amount/route of intake at the scene and inform the emergency medicine (EM) physicians.
All emergency departments (EDs) are formally designated as level 1 to 4 by the government based on their available human resources, essential instruments, equipment, and service level, such as the availability of certain specialists. Level 1 (n = 20) and level 2 (n = 110) EDs have more resources and better facilities for emergency care and must be staffed by emergency physicians 24 hours a day, 365 days a year, by law. Level 3 EDs (n = 330) are basically equipped and can be staffed by general physicians.
Level 4 denotes a non-ED facility. The status of all EDs is evalu- ated annually by an audit committee under the EMS Act (18).
At the hospital, primary stabilization of the patient is provid- ed, followed by a determination of the causative agent, and an- tidote therapy is administered as soon as possible; decontami- nation, hemofiltration, and hemodialysis follow. As the proto- col is not standardized, the physicians follow individual hospital- based protocols. Post-return of spontaneous circulation (ROSC) care, such as mild therapeutic hypothermia, and active cardiac care, including percutaneous coronary intervention, coronary artery bypass surgery and the insertion of an implantable car- dioverter-defibrillator/pacemaker, are provided according to the hospital’s protocols.
Data source
A national OHCA registry database was constructed in two steps based on databases from the Fire and Disaster Headquarters and the Korea Centers for Disease Control and Prevention (CDC).
First, the national registry was generated based on a primary EMS database on OHCA from the Fire and Disaster Headquar- ters, which collects data from ambulance run sheets and the cardiac arrest registries completed by ambulance crews. Most of the Utstein factors, such as bystander CPR, witnessed condi-
tion, place, region, and elapsed time intervals were collected from the EMS database. Values were fully recorded by the EMTs except for a few factors, such as public versus private location (17% unknown). The EMS variables were not cleaned by the quality management committee (QMC).
This step was followed with the addition of information from medical record reviewers from the Korea CDC regarding the hospital outcomes, patient comorbidities, and hospital care pro- cedures. This additional information was based on the medical records of approximately 700 hospitals, to which the OHCA pa- tients were transported by ambulance. Medical records in this study setting are very critical for national health insurance claims.
All diagnosis codes (using the International Classification of Disease, 10th version [ICD-10]) and all procedure codes (using the International Classification of Disease, 9th version [ICD-9]
clinical modification) must be recorded in discharge summary for reimbursement purposes. Most hospitals submit claim data to the national insurance authority for reimbursement. The duty physicians’ records provide the basis for the electronic submis- sion by hospitals. Therefore, the medical record review sources are relatively clear. In particular, the insurance program provides special discounts for rare diseases, including sudden cardiac arrest. This discount is very important for patients. The records are usually clear for these reasons.
Medical record reviewers were educated and trained using the medical record review guidelines prior to joining the proj- ect, and a data QMC worked to maintain the data quality. The QMC provided monthly meetings to obtain feedback on the quality of the data obtained by the medical record reviewers.
The QMC has two roles regarding data quality. The first role is to test internal reliability by comparing the descriptive statistics of each reviewer’s cases. If an outlier was found in the compari- son, the QMC reviewed the cases that were reviewed by that re- viewer. The second role is to provide advice for unclear cases.
For example, a case with a hopeless discharge might be discussed in terms of neurological recovery. The QMC reviewed the cases and provided the level of neurological recovery based on the clinical information provided in the record. When reviewers were uncertain about the exact coding during their work, they could consult a person in charge in the QMC in real time. The QMC consists of statistical experts, epidemiologists, a cardiolo- gist, EM specialists, and medical record review experts (18).
Study population
In this study, EMS-treated patients of all ages with OHCA due to confirmed or presumed poisoning from 2008 to 2013 throug- hout the country were included. A case was defined as having a confirmed or an undetermined causative agent of poisoning, as recorded on the medical record review by the clinician. Poison agents were classified according to the ICD-10. Cases involving patients with an unknown final outcome or who were not treat-
ed by the EMS and ED were excluded.
Main exposure
In this study, poisoning included both chemical poisoning and drug intoxication. Chemical poisoning includes intentional or unintentional intoxication by agents that are not normally con- sumed: carbon monoxide, toxic gas, industrial alcohol (methyl alcohol), ethylene glycol (antifreeze), pesticides, etc. Drug in- toxication includes intentional or unintentional poisoning by prescribed medicines, drugs or alcohol. The etiology of the poi- soning as an exposure variable was further categorized into the following groups according to the ICD-10: X40 X60 Y10 (non- opioid analgesics, antipyretics, and antirheumatics), X41 X61 Y11 (antiepileptic sedative-hypnotic, anti-Parkinsonism, and psychotropic drugs), X42 X62 Y12 (narcotics and psychodyslep- tics [hallucinogens]), X43 X63 Y13 (drugs primarily affecting the autonomic nervous system), X44 X64 Y14 (other and unspeci- fied drugs, medications and biological substances), X47 X67 Y17 (other gases and vapors), X48 X68 Y18 (pesticides), X45 X65 Y15 (alcohol), X46 X66 Y16 (organic solvents and halogenated hydrocarbons and their vapors), and X49 X69 Y19 (other and unspecified chemicals and noxious substances) (Available at http://apps.who.int/classifications/icd10/browse/2016/en#).
As there were too few cases in some of the causative agent cate- gories to analyze, we re-categorized them into five groups: group 1 (medically prescribed drugs; X10–X14, X40–44, Y10–Y14), group 2 (vapors or gases; X17, X47, Y17), group 3 (pesticides; X18, X48, Y18), group 4 (alcohol or organic solvents; X15–X16, X45–X46, Y15–Y16), and group 5 (other unspecified; X19, X49, Y19).
Variables
Additional variables included age, gender, witness (yes or no), region (rural/urban vs. metropolis), place of the event (public, private, or unknown), bystander CPR (yes or no), prehospital defibrillation (yes or no), initial electrocardiogram (ECG) (ven- tricular fibrillation/ventricular tachycardia, pulseless electrical activity, asystole, and unknown), response time from call to am- bulance to arrival at the scene, scene time from arrival at scene to departure to the ED, transport time from departure of scene to arrival at the ED, level of ED (level 1, level 2, level 3, and level 4 classifications), and prehospital ROSC (yes or no).
Outcome measurement
The primary outcome measure was survival to discharge. Sur- vival to discharge was defined when a patient was normally dis- charged or transferred to another facility, such as a rehabilita- tion center. We considered a case as a survival to discharge when it was described in a discharge summary or in other documen- tation. Discharge summaries and other documents were draft- ed by inpatient physicians and reviewed for greater validity by the hospital medical record review team, as these documents
are usually used for national health insurance claims data after discharge. The secondary outcome measure was the patient’s cerebral performance outcome. All patients with survival to discharge were classified using the cerebral performance cate- gories (CPCs) of 1 (good recovery), 2 (moderate disability), 3 (severe disability), 4 (coma or vegetative state), and 5 (brain death). A good neurological status was defined as a CPC score of 1 or 2. Medical record reviewers from the Korean CDC cate- gorized and coded this outcome under the supervision of the project QMC, and codes were decided via on- and off-line con- sultation when the CPC category of the case was controversial.
The outcome measures were determined by the same record reviewer who performed the review for poison source code.
Statistical analysis
The demographic characteristics of the poisoning agent groups were compared using χ2 tests for categorical variables. We com- pared the clinical outcomes according to clinical process (did not survive to ED, survived to ED but died in the ED, survived to admission but died on the ward, survived to discharge with bad CPC, and survived to discharge with good CPC) by poison group.
We developed a multivariable logistic regression analysis mo- del to test the association between causative agents and hospi- tal outcomes while adjusting for confounding factors known to be associated with the outcomes. Adjusted odds ratios (aORs) and 95% confidence intervals (CIs) were calculated. The ele- ments with a significant difference were selected and included in the multivariable model. P values were based on a two-sided significance level of 0.05. The final confounding factors includ- ed age, gender, region, location, bystander CPR, witness status, initial cardiac rhythm, time interval from the call to EMS to the arrival on the scene (response time interval), time interval from the arrival on the scene to departure to the ED (scene time in- terval), and time interval from departure from the scene and arrival to the ED (transport time interval). No collinearity for elapsed time interval factors was detected among the variables when the condition index was less than 10 in the multivariable regression model for co-linearity diagnosis. All statistical analy- sis was performed using SAS software, version 9.4 (SAS Institute, Inc., Cary, NC, USA).
Ethics statement
This study was approved by the Institutional Review Board of Seoul National University Hospital (IRB No. 1103-153-357). In- formed consent was waived by the board.
RESULTS
Demographic findings
Of 139,848 EMS-assessed OHCAs, 2,444 were P-OHCA. Resus-
citation attempts by either EMS or the ED provider occurred for 2,084 patients. Of these, 2,083 cases were eligible for the assess- ment of final outcomes (Fig. 1). Of these 2,083 patients, each poi- soning group was present in the following percentages: prescrib- ed drugs (10.3%), pesticides (52.9%), vapors or gases (23.6%), alcohol or organic solvents (1.4%), and other poisons (13.2%;
Table 1). Children (younger than 15 years) were more repre- sented in the gaseous agents group (46.7%), and elderly people (older than 65 years) were more likely to be exposed to pesti- cides (58.8%; P < 0.001). Residence in a metropolis was signifi- cantly more common in the medically prescribed drug group (48.1%), and rural/urban residence was more prevalent in the pesticides group (23.3%; P < 0.001). The presence of a witness, bystander CPR, and primary ECG differed significantly among poisoning groups (all P < 0.001). The rates of survival to dis-
charge and good neurological recovery were 3.3%/1.3% for all patients, 10.3%/5.6% for the prescribed drugs group, 2.2%/1.0%
for the alcohol or organic solvents group, 2.4%/0.4% for the pes- ticides group, 6.9%/3.4% for the vapors and gases group, and 3.3%/2.4% for other poisons (all P < 0.001; Table 2).
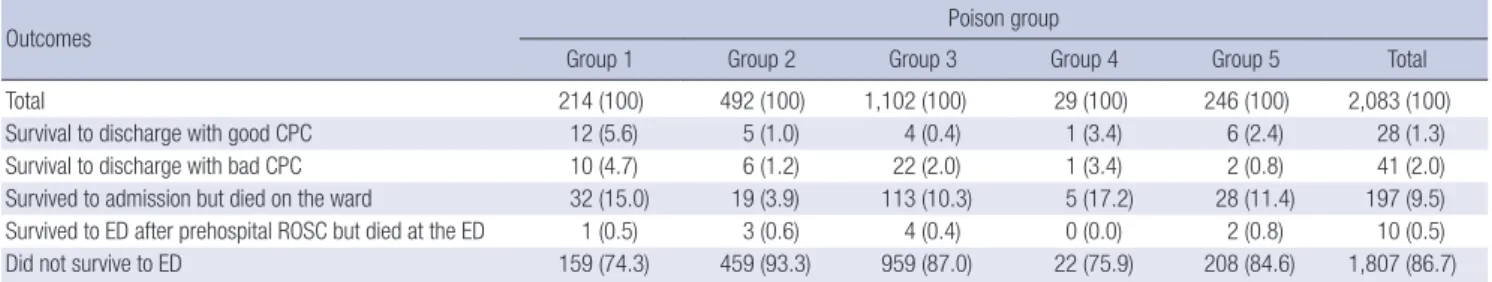
The proportion of patients who did not survive to the ED was 74.3% in group 1 (prescribed drugs) and 93.9% in group 2 (va- pors and gases). The proportion of patients who survived to ad- mission but died on the ward was 15.0% in group 1 (prescribed drug) and 3.9% in group 2 (vapor and gases; Table 3).
Main analysis
The aORs (95% CIs) of the pesticides, alcohol or solvents, and other poisons groups compared with the prescribed drugs group for survival to discharge were 0.34 (0.17–0.68), 0.33 (0.14–0.77), and 0.31 (0.13–0.77), respectively, compared with 0.47 (0.09–
2.51) for the vapors and gases group. The odds ratio (OR) (95%
CIs) for good neurological recovery was significant only in the pesticides group (0.07 [0.02–0.26]); the ORs for the other groups were 0.30 (0.09–1.04) for gases and vapors, 0.45 (0.05–4.48) for alcohol and sorbents, and 0.36 (0.12–1.11) for other poisons (Table 4). Appendix 1 shows the aORs (95% CIs) of potential risk that were used in the final model.
DISCUSSION
We categorized poisoning agents into five groups and determin- ed the differences among them and the outcomes of OHCAs by group. Of the causative toxic agents, pesticides/herbicides rep- resented the largest proportion of OHCAs (52.9%), which is con- sistent with previous studies performed in Korea — 48.6% re- ported by Park et al. (10) and 50.9% by Shin et al. (19). The pre-
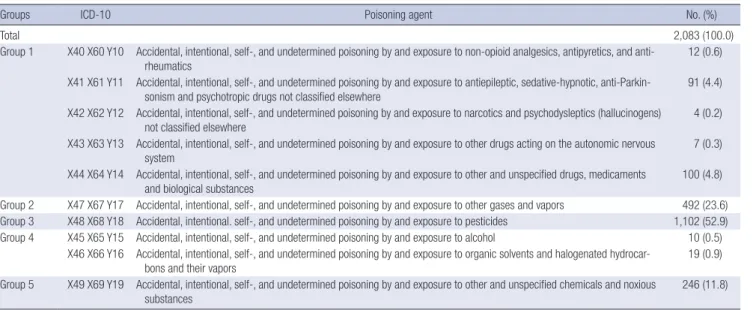
Table 1. Frequency and percentage of poisoning agent by group
Groups ICD-10 Poisoning agent No. (%)
Total 2,083 (100.0)
Group 1 X40 X60 Y10 Accidental, intentional, self-, and undetermined poisoning by and exposure to non-opioid analgesics, antipyretics, and anti-
rheumatics 12 (0.6)
X41 X61 Y11 Accidental, intentional, self-, and undetermined poisoning by and exposure to antiepileptic, sedative-hypnotic, anti-Parkin- sonism and psychotropic drugs not classified elsewhere
91 (4.4) X42 X62 Y12 Accidental, intentional, self-, and undetermined poisoning by and exposure to narcotics and psychodysleptics (hallucinogens)
not classified elsewhere 4 (0.2)
X43 X63 Y13 Accidental, intentional, self-, and undetermined poisoning by and exposure to other drugs acting on the autonomic nervous
system 7 (0.3)
X44 X64 Y14 Accidental, intentional, self-, and undetermined poisoning by and exposure to other and unspecified drugs, medicaments and biological substances
100 (4.8) Group 2 X47 X67 Y17 Accidental, intentional, self-, and undetermined poisoning by and exposure to other gases and vapors 492 (23.6) Group 3 X48 X68 Y18 Accidental, intentional. self-, and undetermined poisoning by and exposure to pesticides 1,102 (52.9) Group 4 X45 X65 Y15 Accidental, intentional, self-, and undetermined poisoning by and exposure to alcohol 10 (0.5)
X46 X66 Y16 Accidental, intentional, self-, and undetermined poisoning by and exposure to organic solvents and halogenated hydrocar-
bons and their vapors 19 (0.9)
Group 5 X49 X69 Y19 Accidental, intentional, self-, and undetermined poisoning by and exposure to other and unspecified chemicals and noxious substances
246 (11.8) ICD-10 = International Classification of Disease, 10th version.
Fig. 1. Study participants.
EMS = emergency medical service, OHCA = out-of-hospital cardiac arrest, P-OHCA
= poisoning-induced out-of-hospital cardiac arrest, CPC = cerebral performance category.
Total EMS-assessed OHCA, 2008–2013 n = 139,848
P-OHCA n = 2,444
EMS-treated P-OHCA n = 2,084
P-OHCA with known outcomes n = 2,083
Other causes, n = 137,404
EMS-not treated, n = 360
Unknown CPC, n = 1
Table 2. Demographic characteristics of the study population by poisoning agent group
Variables Total Group 1 Group 2 Group 3 Group 4 Group 5 P value
All 2,083 (100.0) 214 (100.0) 492 (100.0) 1,102 (100.0) 29 (100.0) 246 (100.0)
Gender < 0.001
Female 716 (34.4) 104 (48.6) 135 (27.4) 391 (35.5) 6 (20.7) 80 (32.5)
Male 1,367 (65.6) 110 (51.4) 357 (72.6) 711 (64.5) 23 (79.3) 166 (67.5)
Age group, yr < 0.001
Child ( < 15) 390 (18.7) 55 (25.7) 230 (46.7) 49 (4.4) 5 (17.2) 51 (20.7)
Adult (15–64) 842 (40.4) 101 (47.2) 209 (42.5) 405 (36.8) 14 (48.3) 113 (45.9)
Elderly ( ≥ 65) 851 (40.9) 58 (27.1) 53 (10.8) 648 (58.8) 10 (34.5) 82 (33.3)
Region < 0.001
Rural or urban 1,434 (68.8) 111 (51.9) 302 (61.4) 845 (76.7) 21 (72.4) 155 (63.0)
Metropolis 649 (31.2) 103 (48.1) 190 (38.6) 257 (23.3) 8 (27.6) 91 (37.0)
Place < 0.001
Public 192 (9.2) 14 (6.5) 94 (19.1) 51 (4.6) 6 (20.7) 27 (11.0)
Private 1,528 (73.4) 180 (84.1) 313 (63.6) 850 (77.1) 20 (69.0) 165 (67.1)
Unknown 363 (17.4) 20 (9.3) 85 (17.3) 201 (18.2) 3 (10.3) 54 (22.0)
Witness < 0.001
Unwitnessed 1,803 (86.6) 165 (77.1) 475 (96.5) 946 (85.8) 19 (65.5) 198 (80.5)
Witnessed 280 (13.4) 49 (22.9) 17 (3.5) 156 (14.2) 10 (34.5) 48 (19.5)
Bystander CPR < 0.001
No 2,036 (97.7) 210 (98.1) 472 (95.9) 1,092 (99.1) 28 (96.6) 234 (95.1)
Yes 47 (2.3) 4 (1.9) 20 (4.1) 10 (0.9) 1 (3.4) 12 (4.9)
Primary ECG < 0.001
VF/pulseless VT 28 (1.3) 6 (2.8) 7 (1.4) 10 (0.9) 0 (0.0) 5 (2.0)
PEA 64 (3.1) 10 (4.7) 10 (2.0) 24 (2.2) 3 (10.3) 17 (6.9)
Asystole 1,991 (95.6) 198 (92.5) 475 (96.5) 1,068 (96.9) 26 (89.7) 224 (91.1)
EMS defibrillation 0.114
No 2,052 (98.5) 207 (96.7) 484 (98.4) 1,091 (99.0) 29 (100.0) 241 (98.0)
Yes 31 (1.5) 7 (3.3) 8 (1.6) 11 (1.0) 0 (0.0) 5 (2.0)
Response time interval, min < 0.001
0–3 114 (5.5) 17 (7.9) 30 (6.1) 51 (4.6) 1 (3.4) 15 (6.1)
4–7 914 (43.9) 124 (57.9) 227 (46.1) 447 (40.6) 11 (37.9) 105 (42.7)
8–11 494 (23.7) 47 (22.0) 104 (21.1) 263 (23.9) 9 (31.0) 71 (28.9)
12–15 247 (11.9) 14 (6.5) 46 (9.3) 160 (14.5) 3 (10.3) 24 (9.8)
≥ 16 314 (15.1) 12 (5.6) 85 (17.3) 181 (16.4) 5 (17.2) 31 (12.6)
Scene time interval, min < 0.001
0–3 453 (21.7) 34 (15.9) 90 (18.3) 280 (25.4) 6 (20.7) 43 (17.5)
4–7 855 (41.0) 88 (41.1) 170 (34.6) 492 (44.6) 12 (41.4) 93 (37.8)
8–11 442 (21.2) 60 (28.0) 111 (22.6) 207 (18.8) 5 (17.2) 59 (24.0)
12–15 160 (7.7) 15 (7.0) 54 (11.0) 67 (6.1) 3 (10.3) 21 (8.5)
≥ 16 173 (8.3) 17 (7.9) 67 (13.6) 56 (5.1) 3 (10.3) 30 (12.2)
Transport time interval, min < 0.001
0–3 239 (11.5) 33 (15.4) 70 (14.2) 108 (9.8) 2 (6.9) 26 (10.6)
4–7 697 (33.5) 95 (44.4) 196 (39.8) 311 (28.2) 12 (41.4) 83 (33.7)
8–11 417 (20.0) 48 (22.4) 105 (21.3) 216 (19.6) 3 (10.3) 45 (18.3)
12–15 270 (13.0) 16 (7.5) 54 (11.0) 161 (14.6) 4 (13.8) 35 (14.2)
≥ 16 460 (22.1) 22 (10.3) 67 (13.6) 306 (27.8) 8 (27.6) 57 (23.2)
Level of ED < 0.001
Level 1 248 (11.9) 29 (13.6) 74 (15.0) 107 (9.7) 9 (31.0) 29 (11.8)
Level 2 824 (39.6) 103 (48.1) 226 (45.9) 366 (33.2) 10 (34.5) 119 (48.4)
Level 3 1,011 (48.5) 82 (38.3) 192 (39.0) 629 (57.1) 10 (34.5) 98 (39.8)
Outcomes
Prehospital ROSC 52 (2.5) 11 (5.1) 12 (2.4) 18 (1.6) 1 (3.4) 10 (4.1) 0.017
Survival to discharge 69 (3.3) 22 (10.3) 11 (2.2) 26 (2.4) 2 (6.9) 8 (3.3) < 0.001
Good CPC 28 (1.3) 12 (5.6) 5 (1.0) 4 (0.4) 1 (3.4) 6 (2.4) < 0.001
Values are presented as number (%). Group 1 (medically prescribed drugs; X10–X14, X40–44, Y10–Y14), group 2 (vapors or gases; X17, X47, Y17), group 3 (pesticides; X18, X48, Y18), group 4 (alcohol or organic solvents: X15–X16, X45–X46, Y15–Y16), and group 5 (other unspecified; X19, X49, Y19).
CPR = cardiopulmonary resuscitation, ECG = electrocardiogram, VF/pulseless VT = ventricular fibrillation/pulseless ventricular tachycardia, PEA = pulseless electrical activity, EMS = emergency medical service, ED = emergency department, ROSC = return of spontaneous circulation, CPC = cerebral performance category.
vious study extracted the poison source from the medical re- cords. However, this study used the information from a review form designed according to International Classification of Ex- ternal Causes of Injuries poison group to reduce the misclassifi- cation bias. Although many unknown values remained in this study, more cases were precisely classified using the data-vari- able dictionary for poison group.
We found that P-OHCA caused by pesticides/herbicides oc- curred mostly in older people living in rural areas. Because of industrialization, many young people have moved to major cit- ies, while older farmers have remained in rural areas. Conse- quently, elderly individuals residing in rural areas are more read- ily exposed to agricultural agents than younger people (20).
Because of the widespread availability of pesticides/herbicides, they have become the most commonly used agent for suicides in developing countries, whereas opioid analgesics are the most commonly used agent in the United States (20-22). Patients in group 3 also had the lowest bystander CPR rate, which suggests that they mostly lived alone, without family, and that rural pop- ulations may have a low level of knowledge of CPR. As metropol- itan areas accommodate more individuals, the transport time
interval was shorter.
Of the various causative agents of P-OHCA, the rates of sur- vival to discharge and good neurological recovery were better for medically prescribed drug-induced OHCAs than for OCHAs induced by other causative groups: gaseous agents, pesticides/
herbicides, and others. A previous epidemiological study found that the survival to discharge rate of P-OHCA patients was re- lated to the causative agent and that prescribed drugs (sedatives, psychotropics) showed the highest survival to discharge rate (14.3% and 7.7%, respectively), which is consistent with our re- sults (10.3%) (10).
In a report on 5,529 cases of individuals intoxicated by recre- ational drugs and new psychoactive substances in Europe, 69.5%
of these individuals went to the hospital by ambulance, 56.9%
of whom were medically discharged from the ED; only 35 (0.6%) presented with cardiac arrest (23). In Germany, a report using poison data from ambulance services found that 10.8% of the 91,285 patients has dysrhythmia, and 111 (0.1%) had cardiac arrest (24). We could not directly compare our findings with the cardiac arrest survival rate of this study due to the lack of infor- mation on survival. Previous studies on poisoning and cardiac Table 3. Clinical outcomes according to poison group
Outcomes Poison group
Group 1 Group 2 Group 3 Group 4 Group 5 Total
Total 214 (100) 492 (100) 1,102 (100) 29 (100) 246 (100) 2,083 (100)
Survival to discharge with good CPC 12 (5.6) 5 (1.0) 4 (0.4) 1 (3.4) 6 (2.4) 28 (1.3)
Survival to discharge with bad CPC 10 (4.7) 6 (1.2) 22 (2.0) 1 (3.4) 2 (0.8) 41 (2.0)
Survived to admission but died on the ward 32 (15.0) 19 (3.9) 113 (10.3) 5 (17.2) 28 (11.4) 197 (9.5)
Survived to ED after prehospital ROSC but died at the ED 1 (0.5) 3 (0.6) 4 (0.4) 0 (0.0) 2 (0.8) 10 (0.5)
Did not survive to ED 159 (74.3) 459 (93.3) 959 (87.0) 22 (75.9) 208 (84.6) 1,807 (86.7)
Values are presented as number (%). Group 1 (medically prescribed drugs; X10–X14, X40–44, Y10–Y14), group 2 (vapors or gases; X17, X47, Y17), group 3 (pesticides; X18, X48, Y18), group 4 (alcohol or organic solvents: X15–X16, X45–X46, Y15–Y16), and group 5 (other unspecified; X19, X49, Y19).
CPC = cerebral performance category, ED = emergency department, ROSC = return of spontaneous circulation.
Table 4. Multivariable logistic regression analysis of hospital outcomes of P-OHCA by poisoning agent group
Outcomes Group Total Positive Crude Adjusted*
Survival to discharge Total 2,083 69 (3.3) - -
Group 1 214 22 (10.3) 1.00 1.00
Group 2 492 11 (2.2) 0.20 (0.10–0.42) 0.33 (0.14–0.77)
Group 3 1,102 26 (2.4) 0.21 (0.12–0.38) 0.34 (0.17–0.68)
Group 4 29 2 (6.9) 0.65 (0.14–2.90) 0.47 (0.09–2.51)
Group 5 246 8 (3.3) 0.29 (0.13–0.67) 0.31 (0.13–0.77)
Good neurological recovery Total 2,083 28 (1.3) - -
Group 1 214 12 (5.6) 1.00 1.00
Group 2 492 5 (1.0) 0.17 (0.06–0.50) 0.29 (0.08–1.00)
Group 3 1,102 4 (0.4) 0.06 (0.02–0.19) 0.07 (0.02–0.26)
Group 4 29 1 (3.4) 0.60 (0.08–4.80) 0.44 (0.04–4.35)
Group 5 246 6 (2.4) 0.42 (0.16–1.14) 0.34 (0.11–1.06)
Values are presented as number (%) or OR (95% CI). Group 1 (medically prescribed drugs; X10–X14, X40–44, Y10–Y14), group 2 (vapors or gases; X17, X47, Y17), group 3 (pesticides; X18, X48, Y18), group 4 (alcohol or organic solvents: X15–X16, X45–X46, Y15–Y16), and group 5 (other unspecified; X19, X49, Y19).
P-OHCA = poisoning-induced out-of-hospital cardiac arrest, OR = odds ratio, CI = confidence interval, ECG = electrocardiogram.
*Adjusted for age, gender, region, place, witness, bystander cardiopulmonary resuscitation, primary ECG, response time interval, scene time interval, transport time interval, and level of emergency department.
arrest outcomes have mostly been case reports on specific agents.
A systematic report form for P-OHCAs will help compare the etiology and outcomes by community.
Recent medical technology can help clinicians save more lives from poisoning through extracorporeal membrane oxy- genation (ECMO) devices. An intoxicated patient who had col- lapsed after amlodipine and metoprolol use was treated with ECMO and showed intact neurologic function. (25,26) Further- more, a patient recovered fully from 82 minutes of no and low flow during arrest and resuscitation after receiving ECMO ther- apy and hypothermia (27). Our data include a very small num- ber of patients (n = 6) who received ECMO treatment (2.3% of 266 survivals to admission). Hypothermia treatment was more common (n = 41 cases, 15.4% of survival to admissions) in our study. This new technology and temperature management should be considered to improve the outcomes after P-OHCA.
We did not include OCHAs caused by poisoning with natural toxins from snakes, bee stings, or foods, which could not be clar- ified in the clinical setting. Those toxins are not obvious or can be confused with anaphylaxis and followed by OHCA. Further studies are needed regarding those natural toxins and OHCA outcomes. We re-categorized the alcohol and organic sorbent materials in this study. Of 10 alcohol-induced and 19 organic sorbent-associated cardiac arrest cases, only 1 person survived with good CPC. We did not separate the patient groups in these categories due to the small sample size. Further studies on these specific poisons are needed.
In this study, only 11.8% of the sample had OHCA due to an unspecified poison. All others had an identified poison source.
If we had known the exact poison at the prehospital stage, we could have applied an antidotal therapy. The most common poison sources were pesticides and herbicides in this study set- ting (52.9%). Several pesticides have exact antidotes that can be used in an emergency setting. For several prescribed drugs, we can also supply EMS providers with specific antidotes to restore cardiac function. This study highlights the need for contempo- rary confirmation of poison sources and the probable availabil- ity of antidotal therapy in the field during resuscitation.
Our study found a greater proportion of pesticide-associated OHCAs than has been reported in other communities. To pre- vent pesticide overuse or suicide, accessibility to pesticides should be reduced by legal control, technical methods, behavioral chan- ges, and public health efforts.
The study has several limitations. First, we only included EMS- transported P-OHCA patients and excluded patients with un- known final outcomes. Some patients may have died without any resuscitation efforts due to prolonged cardiac arrest. Addi- tionally, some patients may not have been identified with P-OH- CA due to a lack of information or bystanders. These cases could have biased the association between poisoning group and out- comes. The total number of deaths due to poisoning reported
during the same study period (2008–2013) by the National Death Certificates was 29,519. Our study collected a total of 2,444 poi- soning-associated OHCAs, comprising approximately 8.3%.
The other 91.7% died without EMS transportation or died dur- ing clinical treatment without any prehospital cardiac arrest in the field. Therefore, we could not estimate the exact proportion of P-OHCA patients who were not enrolled in this study. Sec- ond, based on the ICD-10 codes for poisoning agents, we re- categorized the patients into five groups (medically prescribed drugs, gaseous agents, pesticides/herbicides, and other) to ob- tain a sufficient number of cases for the logistic regression anal- ysis. This categorization may have blurred the effects of each specific causative agent on hospital outcomes. Due to a lack of details regarding the brand names of pesticide or herbicides, we did not analyze the specific effects of the poisons. Third, as the study was performed in the context of basic to intermediate levels of EMS, the study findings should be generalized with caution to other EMS environments.
From a nationwide OHCA registry, we found that survival to discharge and good neurological recovery after P-OHCA were the highest for the prescribed drugs group and the lowest for the pesticides group, followed by the vapors or gases group.
DISCLOSURE
The authors have no potential conflicts of interest to disclose.
AUTHOR CONTRIBUTION
Conceptualization: Shin SD. Data curation: Kim M, Shin SD.
Formal analysis: Kim M. Funding acquisition: Shin SD. Super- vision: Shin SD, Kwak YH, Suh GJ. Writing - original draft: Kim M. Writing - review & editing: Jeong S, Kwak YH, Suh GJ.
ORCID
Minjee Kim https://orcid.org/0000-0001-7007-7407 Sang Do Shin https://orcid.org/0000-0003-4953-2916 Seungmin Jeong https://orcid.org/0000-0002-5409-3324 Young Ho Kwak https://orcid.org/0000-0003-2062-7575 Gil Joon Suh https://orcid.org/0000-0001-5163-2217 REFERENCES
1. Berdowski J, Berg RA, Tijssen JG, Koster RW. Global incidences of out-of- hospital cardiac arrest and survival rates: systematic review of 67 prospec- tive studies. Resuscitation 2010; 81: 1479-87.
2. Kitamura T, Kiyohara K, Sakai T, Iwami T, Nishiyama C, Kajino K, Nishiu- chi T, Hayashi Y, Katayama Y, Yoshiya K, et al. Epidemiology and outcome of adult out-of-hospital cardiac arrest of non-cardiac origin in Osaka: a population-based study. BMJ Open 2014; 4: e006462.
3. Ro YS, Shin SD, Song KJ, Park CB, Lee EJ, Ahn KO, Cho SI. A comparison of outcomes of out-of-hospital cardiac arrest with non-cardiac etiology between emergency departments with low- and high-resuscitation case volume. Resuscitation 2012; 83: 855-61.
4. Salcido DD, Torres C, Koller AC, Orkin AM, Schmicker RH, Morrison LJ, Nichol G, Stephens S, Menegazzi JJ; Resuscitation Outcomes Consortium Investigators. Regional incidence and outcome of out-of-hospital cardiac arrest associated with overdose. Resuscitation 2016; 99: 13-9.
5. Ro YS, Shin SD, Song KJ, Lee EJ, Kim JY, Ahn KO, Chung SP, Kim YT, Hong SO, Choi JA, et al. A trend in epidemiology and outcomes of out-of-hospi- tal cardiac arrest by urbanization level: a nationwide observational study from 2006 to 2010 in South Korea. Resuscitation 2013; 84: 547-57.
6. Pell JP, Sirel JM, Marsden AK, Ford I, Walker NL, Cobbe SM. Presentation, management, and outcome of out of hospital cardiopulmonary arrest:
comparison by underlying aetiology. Heart 2003; 89: 839-42.
7. Hess EP, Campbell RL, White RD. Epidemiology, trends, and outcome of out-of-hospital cardiac arrest of non-cardiac origin. Resuscitation 2007;
72: 200-6.
8. Nielsen N, Hovdenes J, Nilsson F, Rubertsson S, Stammet P, Sunde K, Vals- son F, Wanscher M, Friberg H; Hypothermia Network. Outcome, timing and adverse events in therapeutic hypothermia after out-of-hospital car- diac arrest. Acta Anaesthesiol Scand 2009; 53: 926-34.
9. Bebarta VS, Pitotti RL, Borys DJ, Morgan DL. Seven years of cyanide in- gestions in the USA: critically ill patients are common, but antidote use is not. Emerg Med J 2011; 28: 155-8.
10. Park JH, Shin SD, Song KJ, Park CB, Ro YS, Kwak YH. Epidemiology and outcomes of poisoning-induced out-of-hospital cardiac arrest. Resuscita- tion 2012; 83: 51-7.
11. Sohn CH, Ryoo SM, Lim KS, Kim W, Lim H, Oh BJ. Kind and estimated stocking amount of antidotes for initial treatment for acute poisoning at emergency medical centers in Korea. J Korean Med Sci 2014; 29: 1562- 71.
12. Goel A, Aggarwal P. Pesticide poisoning. Natl Med J India 2007; 20: 182- 91.
13. Moulaert VR, Verbunt JA, van Heugten CM, Wade DT. Cognitive impair- ments in survivors of out-of-hospital cardiac arrest: a systematic review.
Resuscitation 2009; 80: 297-305.
14. Shin SD, Kitamura T, Hwang SS, Kajino K, Song KJ, Ro YS, Nishiuchi T, Iwami T; Seoul–Osaka Resuscitation Study (SORS) Group. Association between resuscitation time interval at the scene and neurological out- come after out-of-hospital cardiac arrest in two Asian cities. Resuscita- tion 2014; 85: 203-10.
15. Ahn KO, Shin SD, Suh GJ, Cha WC, Song KJ, Kim SJ, Lee EJ, Ong ME. Epi-
demiology and outcomes from non-traumatic out-of-hospital cardiac ar- rest in Korea: a nationwide observational study. Resuscitation 2010; 81:
974-81.
16. Lin CH, Ng YY, Chiang WC, Karim SA, Shin SD, Tanaka H, Nishiuchi T, Kajino K, Khunkhlai N, Ma MH, et al. Variation of current protocols for managing out-of-hospital cardiac arrest in prehospital settings among Asian countries. J Formos Med Assoc 2016; 115: 628-38.
17. Choi SW, Shin SD, Ro YS, Song KJ, Lee EJ, Ahn KO. Effect of therapeutic hypothermia on the outcomes after out-of-hospital cardiac arrest accord- ing to initial ECG rhythm and witnessed status: a nationwide observation- al interaction analysis. Resuscitation 2016; 100: 51-9.
18. Kim JY, Shin SD, Ro YS, Song KJ, Lee EJ, Park CB, Hwang SS; CardioVas- cular Disease Surveillance (CAVAS) investigators. Post-resuscitation care and outcomes of out-of-hospital cardiac arrest: a nationwide propensity score-matching analysis. Resuscitation 2013; 84: 1068-77.
19. Shin SD, Suh GJ, Rhee JE, Sung J, Kim J. Epidemiologic characteristics of death by poisoning in 1991–2001 in Korea. J Korean Med Sci 2004; 19:
186-94.
20. Lee WJ, Cha ES, Park ES, Kong KA, Yi JH, Son M. Deaths from pesticide poisoning in South Korea: trends over 10 years. Int Arch Occup Environ Health 2009; 82: 365-71.
21. Warner M, Chen LH, Makuc DM, Anderson RN, Miniño AM. Drug poi- soning deaths in the United States, 1980–2008. NCHS Data Brief 2011:
1-8.
22. Ossiander EM. Using textual cause-of-death data to study drug poisoning deaths. Am J Epidemiol 2014; 179: 884-94.
23. Dines AM, Wood DM, Yates C, Heyerdahl F, Hovda KE, Giraudon I, Sedefov R, Dargan PI; Euro-DEN Research Group. Acute recreational drug and new psychoactive substance toxicity in Europe: 12 months data collec- tion from the European Drug Emergencies Network (Euro-DEN). Clin Toxicol (Phila) 2015; 53: 893-900.
24. von Mach MA, Brinkmann X, Weilemann LS. Epidemiology of cardiac dysrhythmias in acute intoxication. Z Kardiol 2004; 93 Suppl 4: IV9-15.
25. Maskell KF, Ferguson NM, Bain J, Wills BK. Survival after cardiac arrest:
ECMO rescue therapy after amlodipine and metoprolol overdose. Car- diovasc Toxicol 2017; 17: 223-5.
26. Reynolds JC, Judge BS. Successful treatment of flecainide-induced cardi- ac arrest with extracorporeal membrane oxygenation in the ED. Am J Emerg Med 2015; 33: 1542.e1-2.
27. Thooft A, Goubella A, Fagnoul D, Taccone FS, Brimioulle S, Vincent JL, De Backer D. Combination of veno-arterial extracorporeal membrane oxygenation and hypothermia for out-of-hospital cardiac arrest due to Taxus intoxication. CJEM 2014; 16: 504-7.
Appendix 1. Multivariable logistic regression analysis for the effects of potential risk factors on outcomes
Variables Survival to discharge Good CPC
aOR 95% CI aOR 95% CI
Gender
Female 1.00
Male 0.64 0.38–1.09 0.68 0.30–1.56
Age group, yr
Child ( < 15) 1.00
Adult (15–64) 1.41 0.70–2.86 1.27 0.45–3.63
Elderly ( ≥ 65) 0.86 0.38–1.94 1.10 0.33–3.65
Region
Rural or urban 1.00
Metropolis 1.21 0.69–2.11 0.75 0.30–1.87
Place
Public 1.00
Private 0.88 0.37–2.10 1.10 0.22–5.44
Unknown 1.23 0.43–3.53 3.48 0.64–18.89
Witness
Unwitnessed 1.00
Witnessed 3.81 2.15–6.75 5.28 2.17–12.87
Bystander CPR
No 1.00
Yes 1.49 0.39–5.62 < 0.01 < 0.01
Primary ECG
VF/pulseless VT 1.00
PEA 0.35 0.08–1.63 0.56 0.05–1.02
Asystole 0.28 0.08–0.94 0.23 0.18–4.37
Response time interval, min
0–3 1.00 1.00
4–7 0.37 0.16–0.88 0.89 0.18–5.59
8–11 0.45 0.17–1.16 1.01 0.02–3.97
12–15 0.19 0.05–0.75 0.31 0.09–4.87
≥ 16 0.20 0.05–0.71 0.64 0.30–2.58
Scene time interval, min
0–3 1.00
4–7 1.19 0.62–2.28 0.88 0.14–2.16
8–11 0.58 0.24–1.36 0.55 0.30–6.09
12–15 0.58 0.17–1.91 1.34 0.23–4.49
≥ 16 0.39 0.10–1.47 1.01 0.21–2.24
Transport time interval, min
0–3 1.00 1.00
4–7 0.65 0.30–1.40 0.68 0.04–1.26
8–11 0.67 0.28–1.59 0.22 0.07–2.49
12–15 0.61 0.21–1.81 0.40 0.28–4.49
≥ 16 0.67 0.26–1.76 1.11 0.39–3.75
Level of ED
Level 1 1.00 1.00
Level 2 0.31 0.17–0.57 1.21 0.39–3.75
Level 3 0.16 0.08–0.32 0.65 0.18–2.37
CPC = cerebral performance categories, aOR = adjusted odds ratio, CI = confidence interval, CPR = cardiopulmonary resuscitation, ECG = electrocardiogram, VF/pulseless VT = ventricular fibrillation/pulseless ventricular tachycardia, PEA = pulseless electrical activity, ED = emergency department.