A Study on Behavioral Traits of Library and Information
Science Students in South India
ABSTRACT
Human behaviour normally depends on the environment of the incident and the time of its occurrence. The behaviour of people depends on many factors and these behaviour traits are an important aspect in the Library and Information Science (LIS) field. Hence in this paper an attempt has been made to examine the behaviour traits of LIS students in South India. Out of 400 questionnaires distributed 367 have responded and the response rate is 91.75%. In this survey three aspects comprising student behaviour have been analysed such as Work Environment, Natural Environment, and Social Environment. In the case of Work Environment the respondents were grouped as Workaholic, Impatience, Achievement oriented, Rash nature, and Punctuality. Further, in respect to Natural environment, the respondents are grouped as Complacent, Patience, Easygoing, and Relaxed. Last, the respondents were grouped in the Social Environment as Balancing nature, Magnanimity, Naturalistic, Assertive nature, Dependency, Lucrative, Lonely nature, and Time Based personality. Finally the authors conclude that LIS students need to possess these qualities and behaviours to work in different environments.
Keywords
: LIS students, behaviour traits, work environment, natural environment, social environment, India1. INTRODUCTION
There is widespread interest, discussion, and exploration globally regarding school improvement in one form or another. One of the often cited rea-sons for educational change is the need to prepare
the young for participation in new economic and work environments, where the basis of employment is more flexible and the required skills tend to be higher order, more diverse, and continually chang-ing. Today it is seen that academic skills and intelli-gences alone are not sufficient to cope up with the
Received date: December 19, 2012 Accepted date: March 11, 2013 *Corresponding Author: S. Baskaran Technical Officer
Madras University Library University of Madras, India E-mail: baskaranphd@gmail.com
All JISTaP content is Open Access, meaning it is accessible online to everyone, without fee and authors’ permission. All JISTaP content is published and distributed under the terms of the Creative Commons Attribution License (http://creativecom-mons.org/licenses/by/3.0/). Under this license, authors reserve the copyright for their content; however, they permit anyone to unrestrictedly use, distribute, and reproduce the content in any medium as far as the original authors and source are cited. For any reuse, redistribution, or reproduction of a work, users must clarify the license terms under which the work was produced. Open Access
http://dx.doi.org/10.1633/JISTaP.2013.1.1.4
S. Baskaran*
Madras University Library University of Madras, India Email: baskaranphd@gmail.com
B. Ramesha Babu
Dept. of Library and Information Science University of Madras, India
Email: beeraka52@yahoo.com
S. Gopalakrishnan
Madras Institute of Technology Anna University, India
Email: gopallong@gmail.com
global competition. In the field of Library and Information Science (LIS), the possession of skills and competencies are needed which demand that students shall behave properly in their learning and working environments. It has been established that LIS professionals should possess a quality of psy-chological aspects as a built in capability of the pro-fession. Hence multiple intelligences become mandatory coupled with proper behaviour, which in turn refers to behavioral psychology. Behaviour is a manner of behaving or conducting oneself. Condi-tioning, reinforcement, and punishment are key concepts used by behaviorists.
The profiles of behavioral traits are as follows (Friedman and Rosenman, 1959; McAdams, 1996; Vazquez-Carrasco and Foxall, 2006; Wright, 1996):
* Accommodating -concern for group account-ability
* Assertiveness - a measure of generalized self acceptance and confidence
* Attitude -related to stability and poise
* Decisiveness -associated with taking control as well as self -acceptance
* Energy Level -a tendency toward restlessness, activity, and drive
* Independence -individual preference rather than being directed by others
* Manageability -social responsibility and stability * Objective Judgment -a sense of rational
com-petence and objectivity
* Sociability -a measure of social presence and self-confidence
Stogdill (1948) and Mann (1959) reported that many earlier studies on traits attempted to identify personality characteristics that appear to differentiate one from the other. More recently people have tried looking at what combinations of traits might be good for a particular situation. There is some mileage in this. It appears possible to link clusters of personality traits to success in different situations (Wright, 1996).
McAdams (1996) suggests that personality traits, which deal with temporal and situationally invari-ant personal characteristics, distinguish different individuals and lead to consistencies in behavior
across situations and over time. The service indus-tries are always associated with direct personal con-tact such as personality, temperament, and other internal factors (Feng and Zhang, 2009).
There are no studies reported in the context of LIS students and hence this study bridges the gap. In this paper an attempt has been made to study the behavioral traits of Library and Information Science (LIS) students and to categorize them based on ‘Work environment,’ ‘Natural environment,’ and ‘Social environment.’ The study has been carried out with the following objectives:
* To identify the Behavioral traits of ‘Work Envi
-ronment,’ ‘Natural Envi-ronment,’ and ‘Social Environment’ among Library and Information Science students in South India.
* To identify the differences in behavioral traits between male and female Students in Library and Information Science.
* To compare the behavioral traits of the students of Library and Information Science in different geographical environments.
2. RESEARCH DESIGN
This study sought views on behavioural traits of master’s degree students in Library and Information Science in various universities of Southern India. For this purpose a structured questionnaire was administrated among all 400 LIS students (Popu
-lation) of LIS schools spread through four southern States namely Tamil Nadu, Andhra Pradesh, Karna
-taka, Kerala, and one Union Territory, Pondicherry. The survey is based on the census method. There are about 400 master’s students studying in the states of Southern India and the survey has been given to the entire population. Out of 400 question-naires distributed, 367 have responded and the response rate is 91.75%.
The data collected from the respondents were analysed using the SPSS software package. The background information of the respondents is pre-sented in Table 1.
Table 1. Demographic Background Information about the Respondents
Description No. of Respondents Percentage
Gender Male 213 58.04 Female 154 41.96 Age Below 25 years 262 71.39 Between 25 and 29 90 24.52 Above 29 15 4.09 State Tamil Nadu 87 23.71 Andhra Pradesh 102 27.79 Karnataka 134 36.51 Kerala 39 10.63 Pondicherry 5 1.36
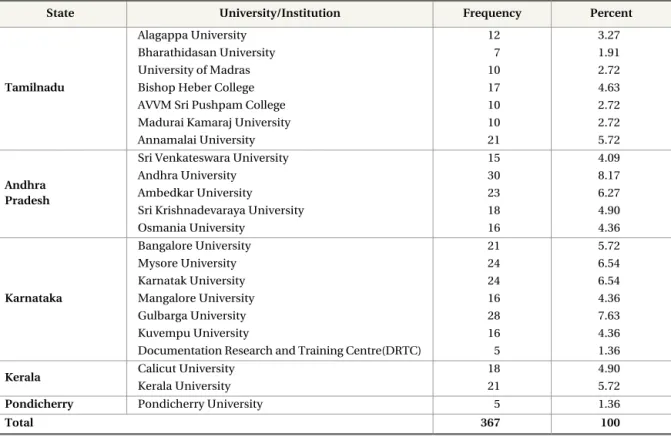
Table 2. University-wise Distribution of Respondents
State University/Institution Frequency Percent
Tamilnadu
Alagappa University 12 3.27
Bharathidasan University 7 1.91
University of Madras 10 2.72
Bishop Heber College 17 4.63
AVVM Sri Pushpam College 10 2.72
Madurai Kamaraj University 10 2.72
Annamalai University 21 5.72
Andhra Pradesh
Sri Venkateswara University 15 4.09
Andhra University 30 8.17
Ambedkar University 23 6.27
Sri Krishnadevaraya University 18 4.90
Osmania University 16 4.36 Karnataka Bangalore University 21 5.72 Mysore University 24 6.54 Karnatak University 24 6.54 Mangalore University 16 4.36 Gulbarga University 28 7.63 Kuvempu University 16 4.36
Documentation Research and Training Centre(DRTC) 5 1.36
Kerala Calicut University 18 4.90
Kerala University 21 5.72
Pondicherry Pondicherry University 5 1.36
Total 367 100
41.96% are female. 71.39% of respondents are in the age group of below 25 years, 24.52% are in the age group of between 25 and 29 years and 4.09% are above 29 years. The largest number of respondents is from Karnataka (36.51%), followed by Andhra Pra
-desh (27.79%), Tamil Nadu (23.71%), and Kerala (10.64%). The lowest number of respondents (1.36%) belong to Pondicherry since there are only 5 PG
stu-dents studying in that university at the time of the survey.
The university-wise distribution of respondents is shown in Table 2.
A total of 22 LIS Schools are listed in four south-ern states, including one Union Territory. Out of these there are 7 each in Tamil Nadu and Karnata
3. RESEARCH ANALYSIS: BEHAVIOR TRAITS
OF LIS STUDENTS
Friedman and Rosenman (1959) first propounded the A/B type of behavioural pattern to describe cer-tain kinds of individuals who, they believed, tended to be overrepresented as clients in their clinical practice. Based on their study, this paper examined the behavioral traits of LIS students in South India and categorized them under three different envi-ronments, namely ‘work environment,’ ‘nature environment,’ and ‘social environment.’ The work environment group has been described as working in the office, the nature environment is described as naturally/habitually showing attitudes irrespective of the environment, and the social environment is described in regard to attitudes toward the society.
In this study the behaviour traits of the LIS stu-dents has been examined in three environments stated above and the number of variables taken up under each are:
* Work Environment -16 variables * Natural Environment -16 variables * Social Environment -27 variables
3.1. Reliability Test
Reliability is concerned with the consistency of a variable. There are two identifiable aspects of this issue: external and internal reliability. Nowadays, the most common method of estimating internal reliability is Cronbach’s alpha (·), which is roughly
equivalent to the average of all possible split-half reliability coefficients for a scale (Zeller and Carmines, 1980). The usual formula is
Here K is the number of items; ≤Ú2
iis the sum of
the total variances of the items; and Ú2
xis the
vari-ance of the total score (Pedhazur and Schmelkin, 1991). As a result, alpha is most appropriately used when the items measure different substantive areas
within a single construct. When the set of items measures more than one construct, coefficient omega_hierarchical is more appropriate (McDonald, 1999; Zinbarg et al. 2005).
Commonly accepted rules for describing internal consistency using Cronbach’s alpha (Cronbach, Lee J., and Shavelson R J, 2004) are ·√0.9 (Excellent), 0.9>·√ 0.8 (Good), 0.8>·√0.7 (Acceptable), 0.7>·√ 0.6 (Questionable), 0.6>·√0.5 (Poor) and 0.5>· (Unacceptable).
Therefore Cronbach’s alpha value has been calcu-lated for the variables taken up for three groups and the same is shown in Table 3.
The Cronbach alpha value indicates that of all the variables taken up for the study are acceptable.
3.2. Work Environment Group
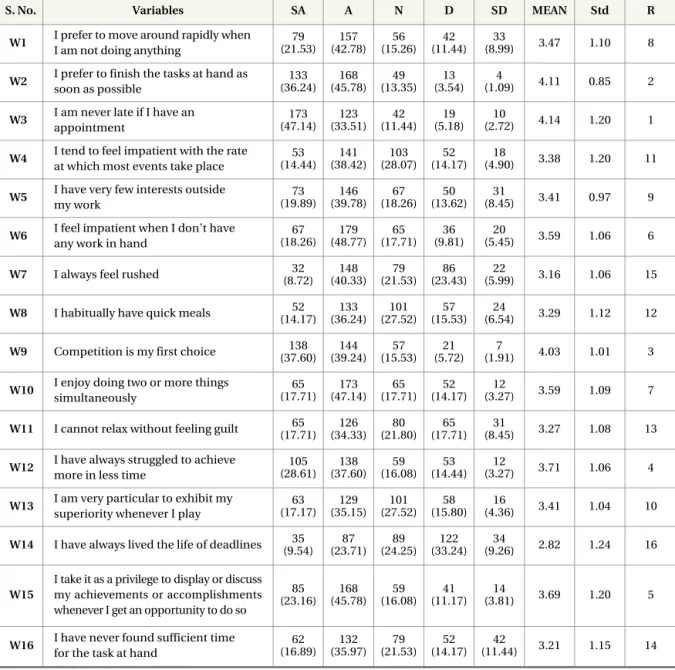
The nature of behaviour is time-bound in the case of work environment. Opinions on 16 variables were taken up in a five point scale such as “strongly agree,” “Agree,” “No opinion,” “Disagree,” and “Strongly Disagree.” The mean and standard devia-tion were calculated based on the opinions. Further ranks were assigned. The opinions, mean, standard deviation, and rank are shown in Table 4.
The mean value in Table 4 shows that the highest value (4.14) is for “I am never late if I have an
ap-pointment,” whereas the same variable shows more variation with the standard deviation value as 1.20.
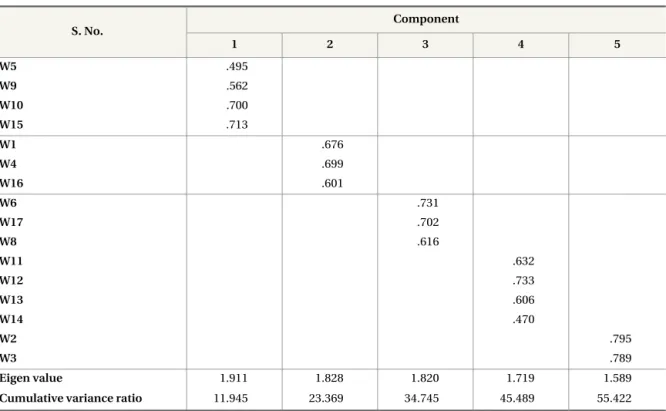
Based on the responses from 367 LIS students for the 16 variables, component factors were adminis-trated. The scores obtained were subjected to factor analysis and five factors have emerged (Table 5).
As can be seen from the table, the variables are grouped into five components. Further Eigen values
Environment No. of
Variables Alpha Value
Work Environment 16 0.7307
Natural Environment 16 0.7271 Social Environment 27 0.9019
Table 3. Reliability Test
·=
i = 1
-1
K
1 -
“
Ú
2L
XÚ
2 Yi X(
K 2)
·
= K“
i =1Ú
K 1 1Ú
2 Yi (1)for the same have been carried out. It can be seen that only the first five factors have Eigen values greater than 1. ‘1’ was the criterion for retention of a factor, which indicates that only the first five factors are to be extracted. It can be seen that the variances were more evenly distributed in the rotated sum of the squared loading (11.945%, 11.424%, 11.376%, 10.744% and 9.933% respectively; Cumulative
vari-ance ratio 55.422%). This indicates that five factors are interpretable.
The components were named based on the vari-able under each component such as Workaholic, Impa-tience, Rash nature, Achievement oriented, and dominating nature. Further, the number of per-sons and the gender under each component has been identified and the same is shown in Table 6.
Table 4. Frequency Data on Behavioural Nature of the Respondents
S. No. Variables SA A N D SD MEAN Std R
W1 I prefer to move around rapidly when I am not doing anything
79 (21.53) 157 (42.78) 56 (15.26) 42 (11.44) 33 (8.99) 3.47 1.10 8
W2 I prefer to finish the tasks at hand as soon as possible 133 (36.24) 168 (45.78) 49 (13.35) 13 (3.54) 4 (1.09) 4.11 0.85 2
W3 I am never late if I have an appointment 173 (47.14) 123 (33.51) 42 (11.44) 19 (5.18) 10 (2.72) 4.14 1.20 1
W4 I tend to feel impatient with the rate at which most events take place
53 (14.44) 141 (38.42) 103 (28.07) 52 (14.17) 18 (4.90) 3.38 1.20 11
W5 I have very few interests outside my work 73 (19.89) 146 (39.78) 67 (18.26) 50 (13.62) 31 (8.45) 3.41 0.97 9
W6 I feel impatient when I don’t have any work in hand
67 (18.26) 179 (48.77) 65 (17.71) 36 (9.81) 20 (5.45) 3.59 1.06 6
W7 I always feel rushed (8.72)32 (40.33)148 (21.53)79 (23.43)86 (5.99)22 3.16 1.06 15
W8 I habitually have quick meals (14.17)52 (36.24)133 (27.52)101 (15.53)57 (6.54)24 3.29 1.12 12
W9 Competition is my first choice (37.60)138 (39.24)144 (15.53)57 (5.72)21 (1.91)7 4.03 1.01 3
W10 I enjoy doing two or more things simultaneously 65 (17.71) 173 (47.14) 65 (17.71) 52 (14.17) 12 (3.27) 3.59 1.09 7
W11 I cannot relax without feeling guilt (17.71)65 (34.33)126 (21.80)80 (17.71)65 (8.45)31 3.27 1.08 13
W12 I have always struggled to achieve more in less time
105 (28.61) 138 (37.60) 59 (16.08) 53 (14.44) 12 (3.27) 3.71 1.06 4
W13 I am very particular to exhibit my superiority whenever I play
63 (17.17) 129 (35.15) 101 (27.52) 58 (15.80) 16 (4.36) 3.41 1.04 10
W14 I have always lived the life of deadlines (9.54)35 (23.71)87 (24.25)89 (33.24)122 (9.26)34 2.82 1.24 16
W15
I take it as a privilege to display or discuss my achievements or accomplishments whenever I get an opportunity to do so
85 (23.16) 168 (45.78) 59 (16.08) 41 (11.17) 14 (3.81) 3.69 1.20 5
W16 I have never found sufficient time for the task at hand
62 (16.89) 132 (35.97) 79 (21.53) 52 (14.17) 42 (11.44) 3.21 1.15 14
It can be seen from Table 6 that the “punctuality” group works out to 25.88%, followed by the “worka-holic” group (21.52%).
From Table 6 it can be observed that ‘Workaholic’ (14.99%) and ‘Punctuality’ (14.99%) are of equally importance among the males, whereas ‘Punctuality’ (10.9%) and ‘Achievement oriented’ (10.35%) are of equally important among the females. While ‘Rash
Nature’ dominates among males (10.63%) in the work environment, on the other hand it has the least impact (5.18) among females. Further, it can be seen that ‘Workaholic’ natures (14.99%) persist among males whereas in the female it is 6.54%. It is also found that ‘Impatience’ nature in the work environment group is almost equal among males and females, i.e. 9.26% and 8.99% respectively.
Table 5. Result of Factor Analysis of Work Environment Variables
1-Workaholic 2-Impatience 3-Rash Nature 4-Achievement Oriented 5-Dominating Nature
S. No. Component 1 2 3 4 5 W5 .495 W9 .562 W10 .700 W15 .713 W1 .676 W4 .699 W16 .601 W6 .731 W17 .702 W8 .616 W11 .632 W12 .733 W13 .606 W14 .470 W2 .795 W3 .789 Eigen value 1.911 1.828 1.820 1.719 1.589
Cumulative variance ratio 11.945 23.369 34.745 45.489 55.422
Table 6. Work Environment vs. Gender
Work Environment
Male Female Total
No. % No. % No. %
Workaholic 55 14.99 24 6.54 79 21.53 Impatience 34 9.26 33 8.99 67 18.26 Rash Nature 39 10.63 19 5.18 58 15.80 Achievement oriented 30 8.17 38 10.35 68 18.53 Punctuality 55 14.99 40 10.90 95 25.89 Total 213 58.04 154 41.96 367 100.00
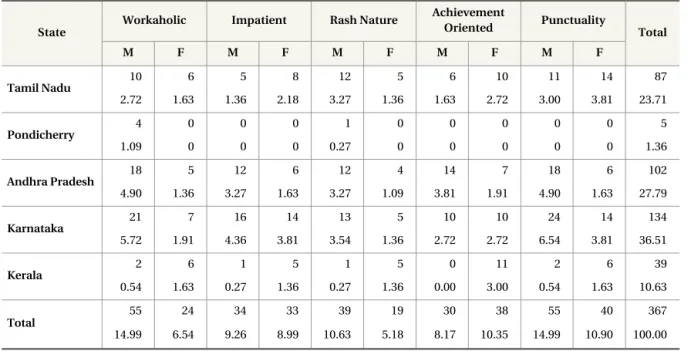
The state-wise distribution of respondents under work environment is shown in Table 7.
The following skills have been identified as distin-guished between genders:
1. In Tamil Nadu, ‘Rash nature’ followed by ‘Pun-ctuality’ are more frequent in males whereas ‘Punctuality’ followed by ‘Achievement orien-ted’ are priorities among females.
2. In Pondicherry all the respondents are male and all favoured the category of ‘Workaholic’ (1.09%) and ‘Rash nature’ (0.27%).
3. In Andhra Pradesh the male group dominates on ‘Workaholic’ and ‘Punctuality’ (4.9%) equal-ly, followed by ‘Achievement oriented’ (3.81%). However, in females ‘Achievement oriented’ (1.91%) dominates, followed by ‘Punctuality’ (1.63%).
4. In Karnataka males fall under the category of ‘Punctuality’ (6.54%), followed by ‘Workaholic’ (5.72%), whereas ‘Punctuality’ and
‘Impatience’ (3.81%) are equally found among females.
5. In Kerala, the male group falls under ‘Worka-holic’ and ‘Punctuality’ (0.54%), followed by ‘Impa-tience’ and ‘Rash nature’ (0.27%),
where-as females have ‘Workaholic’ and ‘Punctuality’ (1.63%), followed by ‘Impatience’ and ‘Rash nature’ (1.36%).
From the data in Table 8, the top priority variables for the students can be presented in Table 8.
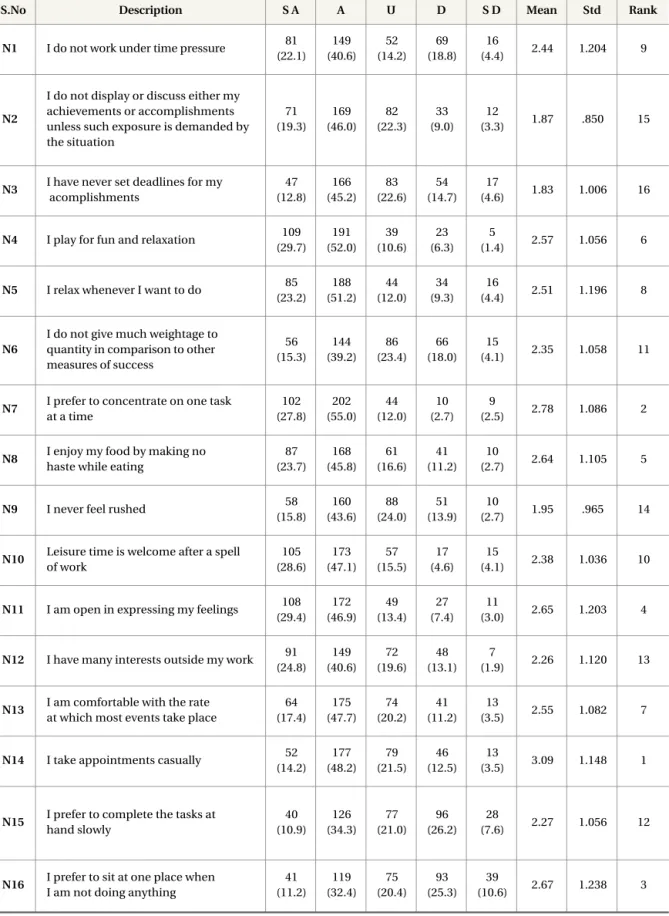
3.3. Natural Environment
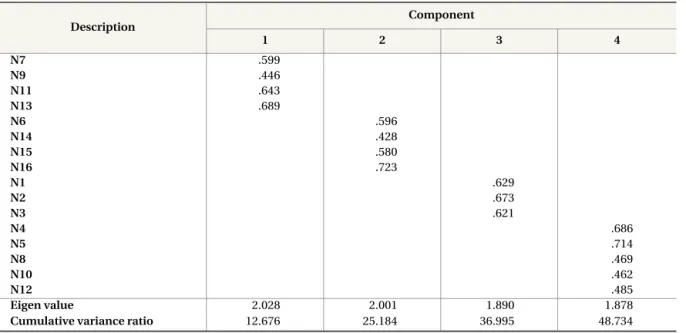
The sixteen variables thus selected to ascertain the natural environment behavioural traits among LIS professionals has been evaluated. From the fac-tor analysis of obtained scores, four facfac-tors emerged and the result is shown in Table 9.
Table 7. Work Environment vs. State of Respondents
State
Workaholic Impatient Rash Nature Achievement
Oriented Punctuality Total
M F M F M F M F M F Tamil Nadu 10 6 5 8 12 5 6 10 11 14 87 2.72 1.63 1.36 2.18 3.27 1.36 1.63 2.72 3.00 3.81 23.71 Pondicherry 4 0 0 0 1 0 0 0 0 0 5 1.09 0 0 0 0.27 0 0 0 0 0 1.36 Andhra Pradesh 18 5 12 6 12 4 14 7 18 6 102 4.90 1.36 3.27 1.63 3.27 1.09 3.81 1.91 4.90 1.63 27.79 Karnataka 21 7 16 14 13 5 10 10 24 14 134 5.72 1.91 4.36 3.81 3.54 1.36 2.72 2.72 6.54 3.81 36.51 Kerala 2 6 1 5 1 5 0 11 2 6 39 0.54 1.63 0.27 1.36 0.27 1.36 0.00 3.00 0.54 1.63 10.63 Total 55 24 34 33 39 19 30 38 55 40 367 14.99 6.54 9.26 8.99 10.63 5.18 8.17 10.35 14.99 10.90 100.00
State Male Female
Tamil Nadu Rash nature Punctuality
Pondicherry Workaholic
-Andhra Pradesh Workaholic Achievement oriented Karnataka Punctuality Punctuality
Kerala Punctuality Punctuality
Table 8. Work Environment - Top Priority Skills of Students in States vs. Gender
S.No Description S A A U D S D Mean Std Rank
N1 I do not work under time pressure 81 (22.1) 149 (40.6) 52 (14.2) 69 (18.8) 16 (4.4) 2.44 1.204 9 N2
I do not display or discuss either my achievements or accomplishments unless such exposure is demanded by the situation 71 (19.3) 169 (46.0) 82 (22.3) 33 (9.0) 12 (3.3) 1.87 .850 15
N3 I have never set deadlines for my acomplishments 47 (12.8) 166 (45.2) 83 (22.6) 54 (14.7) 17 (4.6) 1.83 1.006 16
N4 I play for fun and relaxation 109 (29.7) 191 (52.0) 39 (10.6) 23 (6.3) 5 (1.4) 2.57 1.056 6
N5 I relax whenever I want to do 85 (23.2) 188 (51.2) 44 (12.0) 34 (9.3) 16 (4.4) 2.51 1.196 8 N6
I do not give much weightage to quantity in comparison to other measures of success 56 (15.3) 144 (39.2) 86 (23.4) 66 (18.0) 15 (4.1) 2.35 1.058 11
N7 I prefer to concentrate on one task at a time 102 (27.8) 202 (55.0) 44 (12.0) 10 (2.7) 9 (2.5) 2.78 1.086 2
N8 I enjoy my food by making no haste while eating
87 (23.7) 168 (45.8) 61 (16.6) 41 (11.2) 10 (2.7) 2.64 1.105 5
N9 I never feel rushed 58
(15.8) 160 (43.6) 88 (24.0) 51 (13.9) 10 (2.7) 1.95 .965 14
N10 Leisure time is welcome after a spell of work 105 (28.6) 173 (47.1) 57 (15.5) 17 (4.6) 15 (4.1) 2.38 1.036 10
N11 I am open in expressing my feelings 108 (29.4) 172 (46.9) 49 (13.4) 27 (7.4) 11 (3.0) 2.65 1.203 4
N12 I have many interests outside my work 91 (24.8) 149 (40.6) 72 (19.6) 48 (13.1) 7 (1.9) 2.26 1.120 13
N13 I am comfortable with the rate at which most events take place
64 (17.4) 175 (47.7) 74 (20.2) 41 (11.2) 13 (3.5) 2.55 1.082 7
N14 I take appointments casually 52 (14.2) 177 (48.2) 79 (21.5) 46 (12.5) 13 (3.5) 3.09 1.148 1
N15 I prefer to complete the tasks at hand slowly 40 (10.9) 126 (34.3) 77 (21.0) 96 (26.2) 28 (7.6) 2.27 1.056 12
N16 I prefer to sit at one place when I am not doing anything
41 (11.2) 119 (32.4) 75 (20.4) 93 (25.3) 39 (10.6) 2.67 1.238 3
Table 10. Result of Factor Analysis of Natural Environment Description Component 1 2 3 4 N7 .599 N9 .446 N11 .643 N13 .689 N6 .596 N14 .428 N15 .580 N16 .723 N1 .629 N2 .673 N3 .621 N4 .686 N5 .714 N8 .469 N10 .462 N12 .485 Eigen value 2.028 2.001 1.890 1.878
Cumulative variance ratio 12.676 25.184 36.995 48.734
1-Complacent 2-Patience 3-Easy Going 4-Relaxed
Table 11. Natural Environment Components vs. Gender
Natural Environment Male Female Total
No. % No. % No. %
Complacent 46 12.53 47 12.81 93 25.34
Patient 58 15.80 43 11.72 101 27.52
Easygoing 62 16.89 25 6.81 87 23.71
Relaxed 47 12.81 39 10.63 86 23.43
Total 213 58.04 154 41.96 367 100.00
As can be seen from the table, the variables are grouped into four components. Eigen values were calculated for the same variables. The first four fac-tors have Eigen values greater than 1. ‘1’ was the cri-terion for retention of a factor, which indicates that only the first four factors are to be extracted. It can be seen that the variances were more evenly distrib-uted in the rotated sum of the squared loading (12.676%, 12.508%, 11.811%, and 11.739% respec-tively; Cumulative variance ratio 48.734%), which shows that the four factors are interpretable. The four components have been extracted and named as Complacent, Patience, Easygoing and Relaxed.
Moreover, the number of respondents and the gender under each component is shown in Table 11. It is seen that individuals under each group are
almost evenly distributed ranging from 23.43% to 27.52%. Further, it can be seen that ‘Patience’ (27.52%) in nature dominates and is followed by the ‘Complacent’ group (25.34%).
From Table 11 it can be seen that Easygoing (16.89%) and Patience (15.8%) respectively were given importance among the males, whereas Complacent (12.81%) and Patience (11.72%) were important among the females. Both Complacent and Relaxed (12.53% and 12.81%) are equal in importance among the males, where the females gave less importance to ‘Easygoing’ (6.81%). In gen-eral there is contraction in the natural environment in the case of ‘Easygoing’ more in males and less in females. Similarly the ‘Complacent’ nature was more favored by female than male respondents.
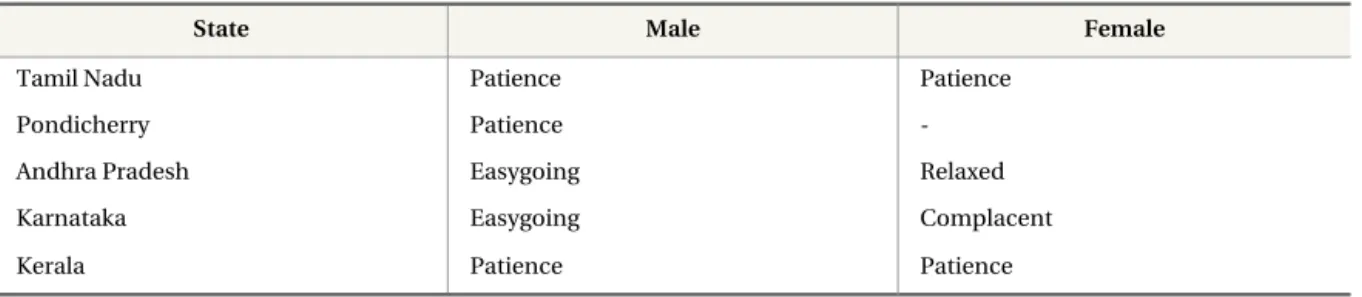
Table 12. Skills on Natural Environment vs. State
States Complacent Patience Easy going Relaxed Total
M F M F M F M F Tamil Nadu 10 12 13 14 12 7 9 10 87 2.72 3.26 3.54 3.81 3.26 1.90 2.45 2.72 23.7 Pondicherry 0 0 4 0 0 0 1 0 5 0 0 1.08 0 0 0 0.27 0 1.36 Andhra Pradesh 16 10 20 4 24 6 14 8 102 4.35 2.72 5.44 1.08 6.53 1.63 3.81 2.17 27.79 Karnataka 20 15 19 12 24 8 21 15 134 5.44 4.08 5.17 3.26 6.53 2.17 5.72 4.08 36.51 Kerala 0 10 2 13 2 4 2 6 39 0 2.72 0.54 3.54 0.54 1.08 0.54 1.63 10.62 Total 46 47 58 43 62 25 47 39 367 12.53 12.80 15.80 11.71 16.89 6.81 12.80 10.62 100
State Male Female
Tamil Nadu Patience Patience
Pondicherry Patience
-Andhra Pradesh Easygoing Relaxed
Karnataka Easygoing Complacent
Kerala Patience Patience
Table 13. Natural Environment - Top Priority among States vs. Gender
Regarding the skills relating to Natural Environ
-ment, the following have been identified among states and gender of the respondents:
1. In Tamil Nadu, “Patience” (3.54%) is followed by “Easygoing” (3.26%) for males. Patient (3.81%) followed by Complacent (3.26%) are strongest among females.
2. In Pondicherry all the respondents are male and all favoured the category of Patience (1.08%) and Relaxed (0.27%).
3. In Andhra Pradesh the male group dominates on Easygoing (6.53%) and Patient (5.44%). This is followed by Complacent (4.35%). Whereas, in females Relaxed (3.81%) is dominant, followed by Complacent (2.72%).
4. In Karnataka males fall under the category of
Easygoing (6.53%), followed by Relaxed (5.72%), whereas in females Complacent and Relaxed (4.08%) had equal importance followed by Patience (3.26%).
5. In Kerala the male group falls under the cate-gories of Patience, Easygoing and Relaxed equal-ly (0.54), whereas Patience (3.54%) is strongest, followed by Complacent (2.72%), among fe
-males.
From Table 12, the top priority variables of the students are summarised and shown in Table 13.
3. 4. Social Environment
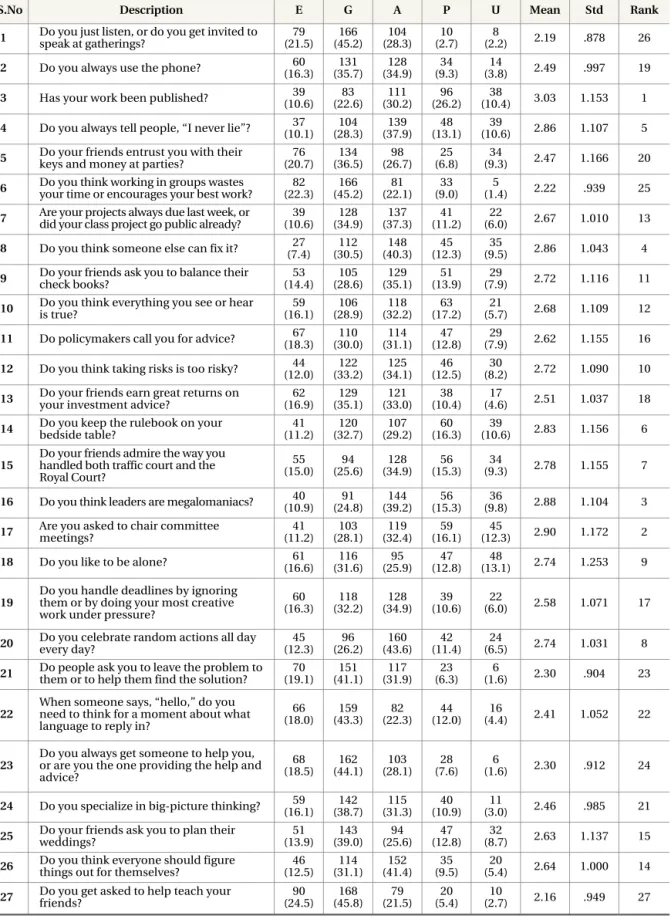
Similar to that of work environment and natural environment, the behavioural natures of LIS stu-dents in the case of Social Environment have been identified by making use of 27 variables (Table 14).
Table 14. Social Environment
S.No Description E G A P U Mean Std Rank
S1 Do you just listen, or do you get invited tospeak at gatherings? (21.5)79 (45.2)166 (28.3)104 (2.7)10 (2.2)8 2.19 .878 26
S2 Do you always use the phone? (16.3)60 (35.7)131 (34.9)128 (9.3)34 (3.8)14 2.49 .997 19
S3 Has your work been published? (10.6)39 (22.6)83 (30.2)111 (26.2)96 (10.4)38 3.03 1.153 1
S4 Do you always tell people, “I never lie”? (10.1)37 (28.3)104 (37.9)139 (13.1)48 (10.6)39 2.86 1.107 5
S5 Do your friends entrust you with theirkeys and money at parties? (20.7)76 (36.5)134 (26.7)98 (6.8)25 (9.3)34 2.47 1.166 20
S6 Do you think working in groups wastesyour time or encourages your best work? (22.3)82 (45.2)166 (22.1)81 (9.0)33 (1.4)5 2.22 .939 25
S7 Are your projects always due last week, ordid your class project go public already? (10.6)39 (34.9)128 (37.3)137 (11.2)41 (6.0)22 2.67 1.010 13
S8 Do you think someone else can fix it? (7.4)27 (30.5)112 (40.3)148 (12.3)45 (9.5)35 2.86 1.043 4
S9 Do your friends ask you to balance theircheck books? (14.4)53 (28.6)105 (35.1)129 (13.9)51 (7.9)29 2.72 1.116 11
S10 Do you think everything you see or hearis true? (16.1)59 (28.9)106 (32.2)118 (17.2)63 (5.7)21 2.68 1.109 12
S11 Do policymakers call you for advice? (18.3)67 (30.0)110 (31.1)114 (12.8)47 (7.9)29 2.62 1.155 16
S12 Do you think taking risks is too risky? (12.0)44 (33.2)122 (34.1)125 (12.5)46 (8.2)30 2.72 1.090 10
S13 Do your friends earn great returns onyour investment advice? (16.9)62 (35.1)129 (33.0)121 (10.4)38 (4.6)17 2.51 1.037 18
S14 Do you keep the rulebook on your bedside table? (11.2)41 (32.7)120 (29.2)107 (16.3)60 (10.6)39 2.83 1.156 6
S15
Do your friends admire the way you handled both traffic court and the Royal Court? 55 (15.0) 94 (25.6) 128 (34.9) 56 (15.3) 34 (9.3) 2.78 1.155 7
S16 Do you think leaders are megalomaniacs? (10.9)40 (24.8)91 (39.2)144 (15.3)56 (9.8)36 2.88 1.104 3
S17 Are you asked to chair committee meetings? (11.2)41 (28.1)103 (32.4)119 (16.1)59 (12.3)45 2.90 1.172 2
S18 Do you like to be alone? (16.6)61 (31.6)116 (25.9)95 (12.8)47 (13.1)48 2.74 1.253 9
S19 Do you handle deadlines by ignoringthem or by doing your most creative work under pressure?
60 (16.3) 118 (32.2) 128 (34.9) 39 (10.6) 22 (6.0) 2.58 1.071 17 S20 Do you celebrate random actions all dayevery day? (12.3)45 (26.2)96 (43.6)160 (11.4)42 (6.5)24 2.74 1.031 8
S21 Do people ask you to leave the problem tothem or to help them find the solution? (19.1)70 (41.1)151 (31.9)117 (6.3)23 (1.6)6 2.30 .904 23
S22
When someone says, “hello,” do you need to think for a moment about what language to reply in?
66 (18.0) 159 (43.3) 82 (22.3) 44 (12.0) 16 (4.4) 2.41 1.052 22
S23 Do you always get someone to help you,or are you the one providing the help and advice?
68
(18.5) (44.1)162 (28.1)103 (7.6)28 (1.6)6 2.30 .912 24 S24 Do you specialize in big-picture thinking? (16.1)59 (38.7)142 (31.3)115 (10.9)40 (3.0)11 2.46 .985 21
S25 Do your friends ask you to plan theirweddings? (13.9)51 (39.0)143 (25.6)94 (12.8)47 (8.7)32 2.63 1.137 15
S26 Do you think everyone should figurethings out for themselves? (12.5)46 (31.1)114 (41.4)152 (9.5)35 (5.4)20 2.64 1.000 14
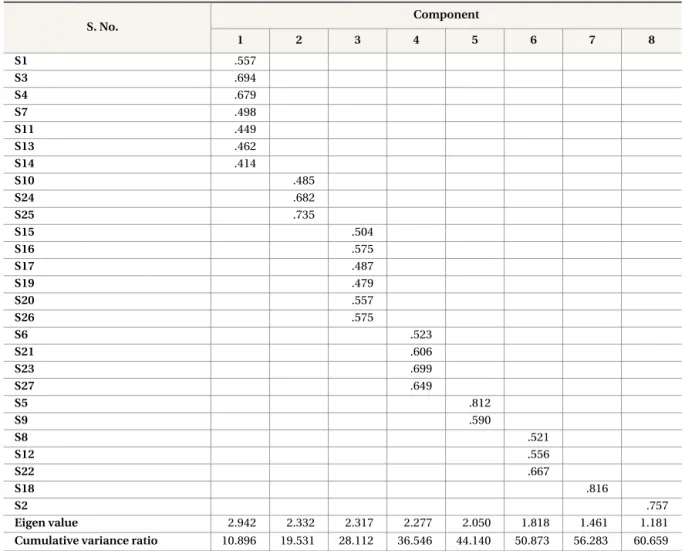
Table 15. Result of Factor Analysis of Social Environment S. No. Component 1 2 3 4 5 6 7 8 S1 .557 S3 .694 S4 .679 S7 .498 S11 .449 S13 .462 S14 .414 S10 .485 S24 .682 S25 .735 S15 .504 S16 .575 S17 .487 S19 .479 S20 .557 S26 .575 S6 .523 S21 .606 S23 .699 S27 .649 S5 .812 S9 .590 S8 .521 S12 .556 S22 .667 S18 .816 S2 .757 Eigen value 2.942 2.332 2.317 2.277 2.050 1.818 1.461 1.181
Cumulative variance ratio 10.896 19.531 28.112 36.546 44.140 50.873 56.283 60.659
1-Balancing Nature 2-Magnanimity 3-Naturalistic 4-Assertive Nature 5-Dependency 6-Lucrative 7-Lonely Nature 8-Time Based Personality
The factor analyses of obtained scores for social environment under a rotated component matrix and eight components which emerged are present-ed in Table 15.
The Eigen values thus calculated for the above variables are shown in Table 15. It can be seen that only the first eight factors have Eigen values greater than 1. ‘1’ was the criterion for retention of a factor, which indicates that only the first five factors are to be extracted. Even though the variances were not evenly distributed in the rotated sum of the squared loading (percentages ranges between 4.376% and 10.896%; cumulative variance ratio 60.659%), the Eigen values are in ranges between 1.181 and 2.942.
This indicates that the eight factors are interpretable. The variables grouped into eight components are Balancing nature, Magnanimity, Naturalistic, Asser
-tive nature, Dependency, Lucra-tive, Loneliness, and Time Based activity.
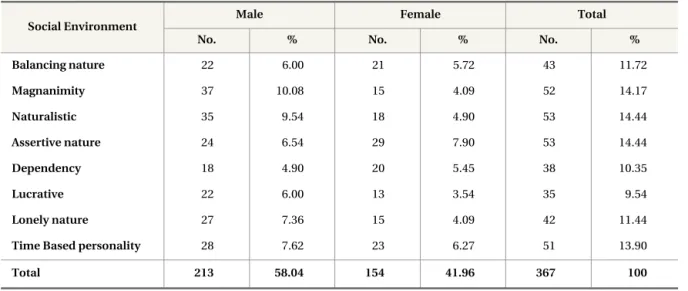
The number of respondents and the gender un
-der each component is shown in Table 16. It can be seen that persons under each group are evenly dis-tributed ranging from 9.54% to 14.442%. Further, it can be seen that ‘Naturalistic’ and ‘Assertive nature’ (14.44%) were equally given importance in the So
-cial environment, followed by the ‘Time based’ per-sonality group (13.9%).
Table 16. Social Environment Components vs. Gender
Social Environment
Male Female Total
No. % No. % No. %
Balancing nature 22 6.00 21 5.72 43 11.72 Magnanimity 37 10.08 15 4.09 52 14.17 Naturalistic 35 9.54 18 4.90 53 14.44 Assertive nature 24 6.54 29 7.90 53 14.44 Dependency 18 4.90 20 5.45 38 10.35 Lucrative 22 6.00 13 3.54 35 9.54 Lonely nature 27 7.36 15 4.09 42 11.44
Time Based personality 28 7.62 23 6.27 51 13.90
Total 213 58.04 154 41.96 367 100
From the table, it can be seen that Magnanimity (10.08%) and Naturalistic (9.54%) respectively were prominent among the males, whereas Assertive nature (7.9%) and Time Based personality (6.27%) were given importance among the females. In males this was followed by Lonely nature (7.36%) and Time Based personality (7.62%), where in females it was ‘Balancing nature’ (5.72%) and ‘Dependency’ (5.45%). In general there is contraction in the case of Magnanimity-more in males and less in fe
-males. Similarly the case of ‘Naturalistic’ features more in males and less in females.
The skills of the respondents have been identified among states and sex as follows:
1. In Tamil Nadu, ‘Magnanimity’ and ‘Naturalis-tic’ (2.72%) are equally considered among male students, followed by ‘Balancing nature’ and ‘Lonely nature’ (1.36%) in equal rank as well. ‘Assertive nature’ and ‘Naturalistic’ (2.18%) are equal among female respondents followed by ‘Balancing nature’ and ‘Magnanimity’ (1.63%), also in equal rank.
2. In Pondicherry, all of the respondents are male and all favoured the category of ‘Magnanimity’ and ‘Time Based’ personality (0.54%) equally, followed by ‘Assertive nature’ (0.27%).
3. In Andhra Pradesh, the male group dominates on ‘Lonely nature’ (3.81%), followed by ‘Magna-nimity’ and ‘Time Based’ personality (both
3.00%) These are followed by ‘Assertive nature’ and ‘Lucrative’ (2.72%) equally. Whereas, for females ‘Time based’ personality (2.18%) is fol-lowed by ‘Assertive nature’ (1.09%).
4. In Karnataka, males fall under the category of ‘Naturalistic’ (5.72%) followed by ‘Balancing nature’ and ‘Time based’ personality (3%), whereas for females ‘Dependency’ (3.27%) and ‘Assertive nature’ (3%) dominate, followed by ‘Naturalistic’ and ‘Lucrative’ (both 1.63%). 5. In Kerala, the male group falls under the
cate-gories of ‘Dependency’ and ‘Lucrative’ (0.54%) equally whereas among females ‘Balancing nature’ (2.45%) is followed by ‘Assertive nature’ (1.63%).
From Table 17, the top priority variables for the students are identified and the same results are pre-sented in Table 18.
In order to identify the overall view of the three environments such as Work Environment, Natural Environment, and Social Environment, their rela-tionship to states of south India and gender is shown in Table 19.
Rash nature, Workaholic, Punctuality, Patience, Easygoing, Magnanimity, Lonely Nature, Natural
-istic, and Dependency are some of the behavioral traits thus existing among male LIS professionals. Similarly Punctuality, Achievement oriented, Patience, Relaxed, Complacent, Assertive, Time
Table 17. Social Environment Components vs. States vs. Gender States Balancing Nature Magnani-mity Naturalistic Assertive Nature
Depen-dency Lucrative Loneliness
Time Based Activity Total M F M F M F M F M F M F M F M F Tamil Nadu 5 6 10 6 10 8 3 8 3 4 4 1 5 3 4 7 87 1.36 1.63 2.72 1.63 2.72 2.18 0.82 2.18 0.82 1.09 1.09 0.27 1.36 0.82 1.09 1.91 23.71 Pondi-cherry 0 0 2 0 0 0 1 0 0 0 0 0 0 0 2 0 5 0.00 0.00 0.54 0.00 0.00 0.00 0.27 0.00 0.00 0.00 0.00 0.00 0.00 0.00 0.54 0.00 1.36 Andhra Pradesh 5 1 11 1 4 2 10 4 9 2 10 3 14 7 11 8 102 1.36 0.27 3.00 0.27 1.09 0.54 2.72 1.09 2.45 0.54 2.72 0.82 3.81 1.91 3.00 2.18 27.79 Karna-taka 11. 5 14 3 21 6 9 11 4 12 6 6 8 2 11 5 134 3.00 1.36 3.81 0.82 5.72 1.63 2.45 3.00 1.09 3.27 1.63 1.63 2.18 0.54 3.00 1.36 36.51 Kerala 1 9 0 5 0 2 1 6 2 2 2 3 0 3 0 3 39 0.27 2.45 0.00 1.36 0.00 0.54 0.27 1.63 0.54 0.54 0.54 0.82 0.00 0.82 0.00 0.82 10.63 Total 22 21 37 15 35 18 24 29 18 20 22 13 27 15 28 23 367 5.99 5.72 10.08 4.09 9.54 4.90 6.54 7.90 4.90 5.45 5.99 3.54 7.36 4.09 7.63 6.27 100.00
State Male Female
Tamil Nadu Magnanimity Assertive
Pondicherry Magnanimity
-Andhra Pradesh Lonely nature Time base personality
Karnataka Naturalistic Dependency
Kerala Dependency Balancing nature
Table 18. Top Priority Variables in Social Environment among States vs. Gender
Table 19. Comparison of Top Priority Variables in Three Environment among States vs. Gender
State Work Environment Natural Environment Social Environment
Male Female Male Female Male Female
Tamil Nadu Rash nature Punctuality Patience Patience Magnanimity Assertive
Pondicherry Workaholic - Patience - Magnanimity
-Andhra Pradesh Workaholic Achievement
oriented Easy going Relaxed Lonely nature
Time based personality Karnataka Punctuality Punctuality Easy going Complacent Naturalistic Dependency
Kerala Punctuality Punctuality Patience Patience Dependency Balancing nature
based, Dependency and Balancing nature exist among female LIS students.
4. CONCLUSIONS
It is often said that people’s behaviour is purely based on the environment and differs from one pro-fession to another and from person to person. Further, it depends on culture, sex, and state of mind. This study helped to identify the behavioral psychology of LIS students in South India. Attitude is of outmost importance as it can make or mar the li-brary professional par excellence. The importance of optimism, enthusiasm, courage, confidence, sense of humor, empathy, sympathy, patience, altruism, and intellectual curiosity should be the focus of library professionals. Their qualities in fact should be a combination of knowledge, skills, and attitudes that these authors also seek from the new breed of librarians. The respondents exhibit a sense of values and standards, a public service orienta-tion, and above all the commitment to the funda-mental values of access to information. This study also demonstrates that LIS students shall need to possess these qualities, including risk taking, adapt-ability, assertiveness, and willingness to embrace approaches from outside the library world.
This study discusses research results on the behavioral traits of Indian LIS students using descriptive inferential statistics. Future studies can replicate its methods in various nations and/or regions with various groups of users in various types of libraries. Further studies and inferential analysis on the relationships between behavioral traits and customer satisfaction and loyalty can suggest much more beneficial information for library manage-ment as well.
REFERENCES
Cronbach, L. J., & Shavelson, R. J. (2004). My current thoughts on coefficient alpha and successor procedures. Educational and Psychological Measurement, 64(3), 391-418.
Feng, X., & Zhang, M. l. (2009). Impact of personality traits on perception of relational benefits: an
empirical study in service context. In First inter-national conference on Infor-mation Science and engineering. (pp. 4326-4329) Beijing, China: IEEE Conference Publications. Retrieved from http://ieeeexplore.ieee.org/ielx5/5454173/0545 5189.pdf.
Friedman, M., & Rosenman R. H. (1959). Association of specific overt behavior pattern with blood and cardiovascular findings blood cholesterol level, blood clotting time, incidence of arcus senilis, and clinical coromary artery disease. Journal of American Medical Association, 169(12), 1286-1296.
Mann, R. D. (1959). A review of the relationships between personality and performance in small groups. Psychological Bulletin, 56(4), 241-270. McAdams, D. P. (1996). Personality, modernity, and
the storied self: A contemporary framework for studying persons. Psychological Inquiry, 7(4), 295-321.
McDonald, R. P. (1999). Test theory: A unified treat-ment. Hillsdale, NJ: Lawrence Erlbaum.
Pedhazur, E. J., & Schmelkin, L. P. (1991). Measure
-ment, design, and analysis: An integrated app
-roach. Hillsdale, NJ: Lawrence Erlbaum.
Stogdill, R. M. (1948). Personal factors associated with leadership: A survey of the literature. The Journal of Psychology, 25(1), 35-71.
Vazquez-Carrasco, R., & Foxall, G. R. (2006). Influ
-ence of personality traits on satisfaction, percep-tion of relapercep-tional benefits, and loyalty in a per-sonal service context. Journal of Retailing and Consumer Services, 13(3), 205-219.
Wright, P. L. (1996). Managerial leadership. London: Thomson Learning.
Zeller, R. A., & Carmines, E. G. (1980). Measurement in the social sciences: The link between theory and data. Cambridge University Press.
Zinbarg, R. E., Revelle, W., Yovel, I., & Li, W. (2005). Cronbach’s ·, Revelle’s ‚, and Mcdonald’s ¯H: their relations with each other and two alterna-tive conceptualizations of reliability. Psychomet