Transl Clin Pharmacol
TCP
Copyright © 2019 Translational and Clinical Pharmacology
It is identical to the Creative Commons Attribution Non-Commercial License (http://creativecommons.org/licenses/by-nc/3.0/).
This paper meets the requirement of KS X ISO 9706, ISO 9706-1994 and ANSI/NISO Z.39.48-1992 (Permanence of Paper).
Introduction
The risk of venous thromboembolism increases in patients post-surgically, such as after hip or knee replacement, fracture surgery, or atrial fibrillation.[1,2] Generally, vitamin K antago- nists such as warfarin, phenprocoumon, and acenocoumarol are used to prevent thromboembolism risk,[3] but they have
some disadvantages. First, international normalized ratio (INR) monitoring is commonly required for patients on vitamin K antagonists because of their narrow therapeutic index.[4,5]
Second, vitamin K antagonists have long half-lives of approxi- mately 40 h, so anticoagulant effects remain after treatment has been discontinued.[6] Finally, vitamin K antagonists have high inter-individual variabilities according to the cytochrome P450 2C9 (CYP2C9) and vitamin K epoxide reductase 1 (VKORC1) enzyme genotypes.[7-9] Furthermore, dietary control is rec- ommended such as limiting vitamin K-rich foods.[10] Novel oral anticoagulants (NOACs) such as apixaban, rivaroxaban, edoxaban, and dabigatran have been developed to overcome these disadvantages.[11] NOACs have shorter half-lives (ap-
Reviewer
This article reviewed by peer experts who are not TCP editors.
Quantification of apixaban in human plasma using ultra performance liquid chromatography coupled with tandem mass spectrometry
Hyeon-Cheol Jeong
1, Tae-Eun Kim
2and Kwang-Hee Shin
1*
1College of Pharmacy, Research Institute of Pharmaceutical Sciences, Kyungpook National University, Daegu 41566, Korea
2Department of Clinical Pharmacology, Konkuk University Medical Center, Seoul 05030, Republic of Korea
*Correspondence: K. H. Shin; Tel: +82-53-950-8582, Fax: +82-53-950-8557, E-mail: [email protected]
Apixaban, an inhibitor of direct factor Xa, is used for the treatment of venous thromboembolic events or prevention of stroke. Unlike many other anticoagulant agents, it does not need periodic monitoring. However, monitoring is still required to determine the risk of bleeding due to overdose or surgery. Usually, apixaban concentrations are indirectly quantified using an anti-factor Xa assay.
However, this method has a relatively narrow analytical concentration range, poor selectivity, and requires an external calibrator. Therefore, the goal of current study was to establish an analytical method for determining plasma levels of apixaban using ultra performance liquid chromatography- tandem mass spectrometry (UPLC-MS/MS). To this end, apixaban was separated using 2.5 mM ammonium formate (pH 3.0) (A) and 100% methanol containing 0.1% formic acid (B) using the gradient method with a Thermo hypersil GOLD column. The mass detector condition was opti- mized using the electrospray ionization (ESI) positive mode for apixaban quantification. The de- veloped method showed sufficient linearity (coefficient of determination [r2 ≥ 0.997]) at calibration curve ranges. The percentage (%) changes in accuracy, precision, and all stability tests were within 15% of the nominal concentration. Apixaban concentration in plasma from healthy volunteers was quantified using the developed method. The mean maximum plasma concentration (Cmax) was 371.57 ng/mL, and the median time to achieve the Cmax (Tmax) was 4 h after administration of 10 mg apixaban alone. Although the results showed low extraction efficiency (~16%), the reproducibility (% change was within 15% of nominal concentration) was reliable. Therefore, the developed meth- od could be used for clinical pharmacokinetic studies.
Received 13 Feb 2019 Revised 11 Mar 2019 Accepted 11 Mar 2019
Keywords
Anticoagulant, Apixaban, Bioanalytical method, UPLC-MS/MS pISSN: 2289-0882 eISSN: 2383-5427
TCP
Transl Clin Pharmacol2019;27(1):33-41 https://doi.org/10.12793/tcp.2019.27.1.33
ORIGINAL ARTICLE
TCP
Transl Clin PharmacolUPLC-MS/MS method for apixaban
proximately 8–15, 5–13, 6–11, and 12–14 h for apixaban, riva- roxaban, edoxaban, and dabigatran, respectively) than that of warfarin (approximately 40 h), so their anticoagulant effects are easily controlled.[4,12,13] Furthermore, dietary limitations are not required for these drugs.[14,15]
Unlike conventional anticoagulants, apixaban does not re- quire periodic monitoring, however, it does require monitor under certain situations such as following the administration of an overdose or before surgery.[6] Generally, the chromogenic anti-Xa assay is used for monitoring apixaban concentra- tions clinically.[16] Specific external calibrators are required to quantify apixaban or rivaroxaban because this method was originally designed to quantify plasma heparin concentrations.
[17] In addition, the sensitivities of the chromogenic assay and dilute Russell viper venom time (DRVV-T) method were 10–25 and 100–200 ng/mL, respectively.[18,19] Furthermore, these methods have poor selectivity for apixaban quantification. For example, in a previous study, apixaban was even detected in the control group that was not administered an anticoagulant.[20]
Therefore, more sensitive and selective analytical methods for apixaban are required for pharmacokinetic studies and effective drug concentration monitoring.
Liquid chromatography-mass spectrometry (LC-MS) is gen- erally used for analysis in various fields and is mainly used to quantify drug concentrations clinically. Once the method is established, analytes can be rapidly analyzed daily and it has the advantage of high sensitivity.[21-23] Recently, published articles suggest that analytical methods using LC-MS can be used to quantify not only apixaban but also other NOACs such as riva- roxaban simultaneously.[21,24] The objective of current study was to establish a quantification method for detecting apixaban in human plasma using UPLC-MS/MS and to apply the method to a clinical studies.
Methods
Reagents
Apixaban and apixaban-d3 (internal standard, IS) were ob- tained from Toronto Research Chemicals (Ontario, Canada).
Methanol, ammonium formate, and formic acid were obtained from Sigma-Aldrich (St. Louis, MO, USA) and Duksan (Korea).
All reagents used in this study were either LC grade or extra- pure grade. Millipore Milli-Q system at 18.2 MΩ (Billerica, MA, USA) was used to obtain deionized water. Drug-free blank plasma containing ethylenediaminetetraacetic acid (EDTA)-K3 was bought from Biochemed (Winchester, VA, USA).
Chromatographic methods
The analysis was performed on the AcquityTM UPLC (Waters, MA, USA) and Xevo TQ-MS Triple Quadrupole Tandem Mass Spectrometer (Waters, MA, USA). The separation of apixaban in plasma was conducted using a mobile phase consisting of 2.5 mM ammonium formate (pH 3.0) (A) and 100% methanol con-
taining 0.1% formic acid (B) on the Thermo Hypersil Gold C18 column (150 × 2.1 mm, 1.9 μm). The run time using the gradi- ent method was 3 min. Gradient method was applied as follows:
0–0.2 min (45% A), 0.2–0.5 min (15% A), 0.5–2.0 min (15% A), 2.0–2.1 min (45% A), and 2.1–3.0 min (45% A). The flow rate was 0.35 mL/min. The column oven and autosampler tempera- tures were set to 40°C and 10°C, respectively, and maintained during analysis. Mass detection was conducted on positive ionization using multiple reaction monitoring (MRM). Mass transitions were set to m/z 460.17 → 199.09 for apixaban and m/
z 463.13 → 202.09 for the IS. The analyzed data were handled by Masslynx version 4.1 (Waters, MA, USA).
Stock and working solutions
Apixaban and the IS stock solution (1 mg/mL) were dissolved in 100% methanol. All of the calibration curve and quality con- trol (QC) working solutions for apixaban were prepared by dilu- tion using methanol. Calibration curve working solutions were prepared to 10, 20, 50, 100, 200, 500, 1000, and 5000 ng/mL.
Working solutions for low, medium, high, and dilution integrity QC (LoQC, MeQC, HiQC, and DiQC, respectively) samples were prepared to 20, 150, 4,000, and 10,000 ng/mL, respectively.
The IS was diluted to 1 μg/mL.
Sample preparation
The plasma completely thawed at ambient temperature (18–
21°C) and was then briefly vortexed. Apixaban was extracted by protein precipitation (PP) from the plasma, and then 100 μL sample was transferred into a microcentrifuge tube to which 50 μL IS (apixaban-d3, 1 µg/mL in 100% methanol) was added.
Then 450 μL of 100% methanol (3-fold volume of the sample) was added to the sample, followed by gentle vortexing for 5 min and centrifugation for 10 min at 13,000 rpm. The methanol phase was transferred into a vial for subsequent analysis.
Validation
Validation of the analytical method was performed in accor- dance to “Guidance for Industry Bioanalytical Method Valida- tion” published by the US Food and Drug Administration and
“Guideline on Bioanalytical Method Validation” published by the Korean Ministry of Food and Drug Safety (MFDS).[25,26]
Accuracy and precision
To measure accuracy and precision, lower limit of quantifica- tion (LLOQ), LoQC, MeQC, and HiQC samples were analyzed five times within each batch (intra-batch), and consecutively analyzed for three independent batches (inter-batch). The ac- ceptance criteria of accuracy and precision were within ± 20%
for the LLOQ and ± 15% for the LoQC, MeQC, and HiQC.
Linearity and sensitivity
Calibration standards for apixaban were made by spiking the working solution into drug-free blank plasma. The calibration
TCP
Transl Clin Pharmacol
Hyeon-Cheol Jeong, et al.
standards included a double blank (no apixaban or IS), blank (only IS), and eight-point samples (both apixaban and IS). Lin- earity was evaluated at a concentration range of 1–500 ng/mL.
The coefficient of correlation (r) of linear regression was used to determine if this value was greater than 0.997.
Carry-over and matrix effect
Carry-over was performed to determine if a high concentra- tion of sample would affect the analysis of the next sample. A volume of 1,000 ng/mL sample (upper limit of quantification, ULOQ) was injected prior to injection of the double blank sam- ple five times. When injecting the blank sample, the peak areas of apixaban and IS were less than 20% and 5% of LLOQ, respec- tively. The matrix effects were performed to assess the effects of the endogenous compounds on the analysis. LoQC and HiQC samples were prepared using six different individual plasma.
The matrix effect calculated the peak area ratios for the analyte and IS of six independent LoQC and HiQC samples, and evalu- ated whether the CV (%) was within 15%.
Extraction efficiency and dilution integrity
The assessment of extraction efficiency was performed by comparing the apixaban area ratios of samples added before and after extraction. To assess the impact of dilution on analyte quantification, the DiQC sample was diluted 1:10 and 1:50, and then the diluted samples were analyzed. The apixaban concen- tration in the diluted sample was back-calculated by multiplying the result by the dilution factor.
Stability
Sample stability was assessed by analyzing post-processed samples that were stored in an autosampler at 10°C overnight.
Short-term working solution and stock solution stability were assessed after the sample was kept at laboratory temperatures (18–21°C) for 10 h. We compared the apixaban peak area ratio of the sample left on the table with the newly prepared sample to obtain short-term stability. The freeze-thaw stability was measured by analyzing the apixaban concentration after repeat- ing three cycles of freeze-thaw at -80°C and laboratory tempera- ture for the LoQC and HiQC samples. Reproducibility of re-in- jection was assessed by comparing the measured concentrations of the LoQC and HiQC samples analyzed in the previous batch with the freshly prepared QC samples. The acceptance criteria of the stability were that the percentage (%) change of the cal- culated concentration should be within 15% of the theoretical concentration.
Clinical study design
The clinical study was conducted at Clinical Trial Center of Konkuk University Medical Center (Seoul, South Korea) in 23 subjects who voluntarily agreed to participate. Approval of the clinical study was obtained by the Institutional Review Board of Konkuk University Medical Center (IRB No. KUH1280105).
In the first period, the 23 subjects were administered a 10 mg apixaban tablet (Eliquis, BMS Pharmaceutical Korea Ltd., Seoul, South Korea) alone, followed by a wash-out period. In the sec- ond period, 16 patients were administered 10 mg apixaban with 20 mg rosuvastatin (Crestor Tab., AstraZeneca, Seoul, South Korea) and 7 were administered 10 mg apixaban and 250 mg lapatinib tablets (Tykerb Tab., Novartis Korea, Seoul, South Korea). To quantify apixaban, whole blood was collected at pre- dose (0 h) and 1, 2, 3, 4, 6, 8, 11, and 24 h after administration in EDTA-K3 tube. The plasma was isolated by centrifugation of the collected blood at 3,000 rpm for 10 min at 4°C and transferred into microcentrifuge tubes. The plasma was stored at -70°C un- til subsequent analysis.
Results
Method development
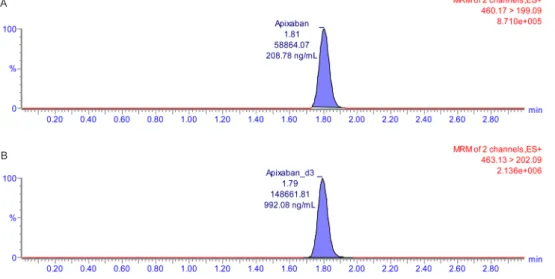
The mass spectra and chemical structures of apixaban and IS are presented in Figure 1. In the electrospray ionization (ESI) positive mode, apixaban and IS showed good responses. Iso- cratic and gradient methods were tested for sample separation using deionized water, 0.1% formic acid, ammonium formate solution, 100% methanol, 100% methanol containing 0.1% for- mic acid, 100% acetonitrile, and 100% acetonitrile containing 0.1% formic acid. The results showed that the gradient method was more appropriate than the isocratic method. The separa- tion method was developed based on a previous report,[21] and modified with 2.5 mM ammonium formate (pH 3.0) (a) and methanol containing 0.1% formic acid (b).
Method validation Accuracy and precision
The accuracy ranged from 94.8% to 111.4% and from 98.8%
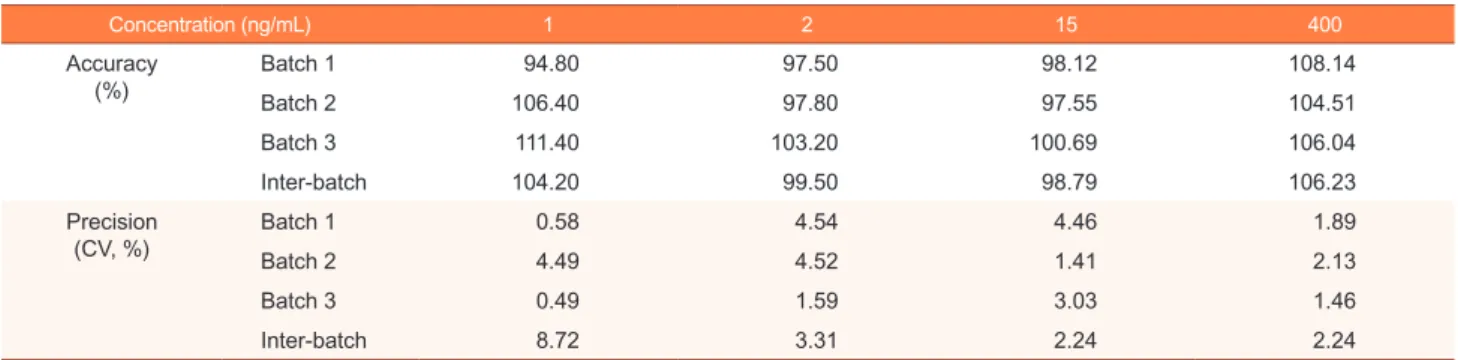
to 106.2% for the intra-batch and inter-batch, respectively. The precision range was 0.49–4.54% and 2.24–8.72% for the intra- batch and inter-batch, respectively. The accuracies and preci- sions of the inter-batch and intra-batch are shown in Table 1.
Linearity and sensitivity
The calibration curve with a weighting factor of 1/x2 showed good linearity ranging from 1 to 500 ng/mL (r ≥ 0.998 and r2
≥ 0.997). In the LLOQ (1 ng/mL), signal-to-noise was >10.
The double blank sample and chromatogram of the LLOQ are shown in Figure 2 and 3.
Carry-over and matrix effect
To determine the carry-over effect, the ULOQ sample (500 ng/mL) was injected and then five double blank samples were injected. The results indicated that there was no interference af- ter injecting the double blank sample. After injecting the LoQC and HiQC samples prepared from six different individual plasma samples, the percentage coefficient of variation (% CV)
TCP
Transl Clin PharmacolUPLC-MS/MS method for apixaban
Table 1. Intra-batch and inter-batch accuracy and precision of validation batches
Concentration (ng/mL) 1 2 15 400
Accuracy
(%) Batch 1 94.80 97.50 98.12 108.14
Batch 2 106.40 97.80 97.55 104.51
Batch 3 111.40 103.20 100.69 106.04
Inter-batch 104.20 99.50 98.79 106.23
Precision
(CV, %) Batch 1 0.58 4.54 4.46 1.89
Batch 2 4.49 4.52 1.41 2.13
Batch 3 0.49 1.59 3.03 1.46
Inter-batch 8.72 3.31 2.24 2.24
Figure 1. Mass spectra and chemical structures of (A) apixaban and (B) deuterated internal standard (apixaban-d3) in electrospray ionization (ESI) positive mode. The blue arrows indicate spectral peaks corresponding to each structure.
A
B
TCP
Transl Clin Pharmacol
Hyeon-Cheol Jeong, et al.
Figure 2. Representative chromatogram of (A) double blank human plasma and (B) lower limit of quantification samples.
A
B
Figure 3. Representative chromatogram of (A) apixaban and (B) internal standard in plasma after oral administration of apixaban 10 mg.
B A
TCP
Transl Clin PharmacolUPLC-MS/MS method for apixaban
for apixaban at the LoQC and HiQC were 4.08% and 2.39%, respectively. No significant matrix effect appeared in the human plasma with the LoQC and HiQC samples.
Extraction efficiency and dilution integrity
The extraction efficiency was evaluated at three QC concen- trations, LoQC, MeQC, and HiQC, which showed recoveries of 16.57%, 15.24%, and 14.66%, respectively. The dilution integrity was assessed by diluting the DiQC (1,000 ng/mL) by 50- and 10-fold, respectively. The back-calculated nominal concentra- tions were 1042.8 and 1043.5 ng/mL for each sample. The accu- racy and precision of the 50-fold dilution were 102.79–108.29%
and 2.20%, respectively, and values for the 10-fold dilution were 102.33–108.67% and 2.43%, respectively. The results of the dilu- tion integrity are presented in Table 2.
Stability
The stability of the apixaban working and stock solutions were evaluated under various conditions, and the results are presented in Table 3. The processed sample was stable for 24 h in the autosampler. The apixaban working and stock solutions were stable at laboratory temperatures for 10 h. Six LoQC and HiQC samples were within 15% of the nominal concentration change measured after three repeated freeze-thaw cycles. The re-injection change was within 15% of the nominal concentra- tion compared with the test and reference samples. The results indicated that the developed method could be used to analyze
apixaban under the investigated conditions.
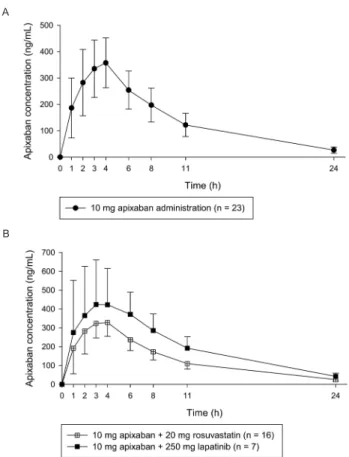
Application of the analysis method to a pharmacokinetic study The validated analytical method was applied to quantify apixa- ban in a clinical study. In Figure 4, the mean plasma apixaban concentration-time profiles for each group were presented. The mean ± standard deviation (SD) values of the maximum plasma concentration (Cmax) and median (range) time to reach the Cmax (Tmax) in the 10 mg apixaban single administration group
Figure 4. Mean time-concentration profile after (A) administration of single dose of apixaban 10 mg and (B) co-administration with 20 mg rosuvastatin (crossed square) or 250 mg lapatinib (solid square). Error bars represent the standard deviation (SD).
B Table 3. Stability tests under various temperatures A
Concentration (ng/mL) 2 400
Re-injecta -0.66 0.60
Processed sampleb -0.34 -0.21
Freeze-thawc -3.57 -4.61
Short-termd 3.74 2.42
Stock short-terme -5.56 13.13
aAfter three re-injections. bAfter 24 h in an autosampler at 10°C.
cAfter three freeze-thaw cycles. dAfter 20 h at room temperature.
eAfter 24 h at room temperature.
All of the results are presented as percentage (%) change.
Table 2. Dilution integrity of apixaban in human blank plasma
N = 5
50-fold dilution 10-fold dilution
Back-calculated
concentration (ng/mL) Accuracy (%) Precision (% CV) Back-calculated
concentration (ng/mL) Accuracy (%) Precision (% CV)
1 1082.90 108.29
2.20
1043.50 104.37
2.43
2 1037.40 103.74 1037.50 103.77
3 1037.70 103.77 1026.50 102.66
4 1028.10 102.81 1086.50 108.67
5 1027.90 102.79 1023.50 102.33
Mean ± SD 1042.80 ± 22.92 104.28 - 1043.50 ± 25.37 104.36 -
TCP
Transl Clin Pharmacol
Hyeon-Cheol Jeong, et al.
were 371.57 ± 95.23 ng/mL and 4 (1–4) h, respectively. The mean Cmax and median Tmax values of the 20 mg rosuvastatin co-administered group were 347.65 ± 73.63 ng/mL and 3 (2–4) h, respectively. The mean Cmax and median Tmax of the 250 mg lapatinib co-administered group were 529.01 ± 162.83 ng/mL and 3 (1–6) h.
Discussion
An analytical method used for the measurement of apixaban concentration was developed and validated in this study. The percentage change in accuracy, precision, and stability under various temperature conditions in validation batches were with- in 15% of the nominal concentration at the LoQC, MeQC, and HiQC. Three different concentrations of QC samples did not show significant changes after repeated freeze-thaws for three cycles at -80°C, and no significant changes were observed com- pared with the nominal concentration even at laboratory and autosampler temperature conditions (10 and 24 h, respectively).
The time-concentration profiles for apixaban were determined using the developed method. Analyte ionization was performed in the ESI positive mode according to a previous report.[27,28]
Comparing the positive and negative ionization mode, apixaban was detected in the positive ionization mode with high sensitiv- ity. The mobile phases were evaluated using deionized water containing 0.1% formic acid, 2.5 mM ammonium formate (pH 3.0), methanol containing 0.1% formic acid, and acetonitrile containing 0.1% formic acid using the Thermo Hypersil Gold C18 column. Among them, 2.5 mM ammonium formate (pH 3.0) and methanol containing 0.1% formic acid (mobile phase A and B, respectively) showed the best peak shapes and excellent separation. Sample preparation using methanol showed better peak shape and reproducibility than those using acetonitrile did.
Generally, the chromogenic anti-factor Xa assay is used to quantify apixaban concentrations.[16,17] The correlation of apixaban concentrations and factor-Xa activity at the thera- peutic range has been shown to be linear.[29-32] The dynamic ranges for apixaban were approximately 20–500 ng/mL.[17]
This method was an indirect quantification method for apixa- ban using factor Xa activity with residual activated factor Xa.[18,29] Changes in the coagulation factor or other antico- agulants may affect apixaban quantification.[21] Chromogenic assay agents are generally stable for up to 4 months depending on the storage temperature conditions after reconstitution.[33]
For example, STA®-Liquid Anti-Xa (Stago Group, France) is stable for 3 months at 2–8°C and Technochrom® anti-Xa (Di- aPharma Group, Inc., West Chester Township, OH, USA) is stable for 4 months at 2–8°C. The direct quantification of apixa- ban using LC-MS could solve these drawbacks, as the analysis with this technique has high sensitivity and specificity.[34] In addition, relatively flexible ranges of the calibration curve could be used according to the study specification or sample status.
Chromogenic or clotting-based assays such as prothrombin
time (PT), thrombin time (TT), the chromogenic factor-Xa assay, and other methods indirectly quantify coagulation activ- ity,[21] whereas the analytical method using LC-MS enables the direct quantification of anticoagulant concentrations.[21]
The other advantage of using LC-MS is that it is not affected by changes in other anticoagulants or coagulation factors. In previously reported studies, apixaban was shown to be stable at -50°C and -80°C for 6 and 8 months, respectively.[27,32]
Therefore, the analysis method using LC-MS may be useful for apixaban analysis that requires high selectivity and sensitivity such as for pharmacokinetic studies. Compared with previ- ously reported methods,[12,21,28,35,36] the concentration of apixaban analyzed within 3 min on a C18 column with reliable reproducibility (accuracy and precision were within 15% range).
Sample preparation with protein precipitation (PP) was used in the current study. PP is a simple and rapid preparation method compared with solid-phase extraction (SPE) or liquid-liquid extraction (LLE).[37,38] As the current method was rapid and relatively simple, it might be suitable for therapeutic monitor- ing or large scale sample analysis. A limitation of this study was that the method showed lower extraction efficiency than that of previous studies.[21,39] The three-replicated mean extraction efficiencies were calculated to be 16.57%, 15.24%, and 14.66%
for the LoQC, MeQC, and HiQC, respectively. In the other reported studies, the extraction efficiencies were 104% [21] and ranged from 101.8% to 102.7%.[39] The extraction efficiency range in this study was 82% to 84% when it was calculated us- ing the same method as that used in previous studies.[21,39]
Although the extraction efficiency in this study was relatively lower than that previously reported, the relative SD (RSD) of the mean extraction efficiency was 6.5% (within 15%), indicat- ing the reproducibility of the validation method; therefore, this method was considered reliable.
The Cmax and Tmax values were compared with other previous studies. In this study, the arithmetic mean and geometric mean
± standard deviation (SD) of Cmax were 371.57 ± 95.23 ng/mL and 358.50 ± 1.32 ng/mL, respectively. Median Tmax (range) was 4 (1-4) h. Frost, C. et al. reported the arithmetic mean ± SD of Cmax and median (range) Tmax were 176.3 ± 42 ng/mL and 3.0 (2.5-4.0) h after the single administration of apixaban 10 mg in healthy White and Black volunteers.[40] Upreti, V. V. et al.
reported the geometric mean ± SD of Cmax and median Tmax
(range) were 207 ± 24 ng/mL and 3.03 (2.0-6.0) h after single administration of apixaban 10 mg in healthy White, Black and Asian volunteers.[41] Moreover Cui, Y. et al. reported the geo- metric mean Cmax (CV) and median Tmax (min, max) were 233.9 (26) ng/mL and 3 (2, 4) h after the same dosage administration in healthy Chinese volunteers.[42] The Tmax was comparable with other reports, whereas the Cmax was higher than the com- pared results. Apixaban was known as primarily metabolized by CYP3A4 and is a substrate of P-gp and BCRP. Genetic polymor- phism, such as the ABCB1, ABCB2 and CYP3A5 gene, affected the disposition of apixaban.[43,44] Further studies with phar-
TCP
Transl Clin PharmacolUPLC-MS/MS method for apixaban
macogenetics approach might be needed to identify the cause of the differences of apixaban pharmacokinetic parameters in a different population.
Conclusions
An analytical method for the determination of apixaban was developed using UPLC-MS/MS. Previous anti-factor Xa as- says indirectly measured the concentrations of apixaban. These methods were affected by changes in coagulant factors or co- administered drugs. However, the developed method using LC- MS in this study could be directly used to quantify the concen- tration of apixaban and had an LLOQ value of 1 ng/mL, which was lower than that of the anti-factor Xa assay method (ap- proximately 20 ng/mL). Therefore, the LC-MS-based analytical method may be useful for pharmacokinetic studies and clinical applications.
Acknowledgments
This research was supported by the Bio & Medical Technol- ogy Development Program of the National Research Foun- dation (NRF) and was funded by the Korean government (MSIP&MOHW) (No. NRF-2015M3A9E1028327).
Conflict of interest
- Authors: All authors declare no competing financial interests.
- Reviewers: Nothing to declare - Editors: Nothing to declare
References
1. Hart RG, Pearce LA, Aguilar MI. Meta-analysis: antithrombotic therapy to prevent stroke in patients who have nonvalvular atrial fibrillation. Ann In- tern Med 2007;146:857-867.
2. Wolf PA, Abbott RD, Kannel WB. Atrial fibrillation as an independent risk factor for stroke: the Framingham Study. Stroke 1991;22:983-988.
3. Favaloro EJ, Lippi G. Laboratory testing in the era of direct or non-vitamin K antagonist oral anticoagulants: a practical guide to measuring their ac- tivity and avoiding diagnostic errors. Semin Thromb Hemost 2015;41:208- 227. doi: 10.1055/s-0035-1546827.
4. Gage BF, Fihn SD, White RH. Management and dosing of warfarin thera- py. Am J Med 2000;109:481-488. doi: https://doi.org/10.1016/S0002- 9343(00)00545-3.
5. Granger CB, Alexander JH, McMurray JJ, Lopes RD, Hylek EM, Hanna M, et al. Apixaban versus Warfarin in Patients with Atrial Fibrillation. N Engl J Med 2011;365:981-992. doi: 10.1056/NEJMoa1107039.
6. Conway SE, Hwang AY, Ponte CD, Gums JG. Laboratory and clinical monitoring of direct acting oral anticoagulants: what clinicians need to know. Pharmacotherapy 2017;37:236-248. doi: 10.1002/phar.1884.
7. Johnson JA, Gong L, Whirl-Carrillo M, Gage BF, Scott SA, Stein CM, et al.
Clinical Pharmacogenetics Implementation Consortium Guidelines for CYP2C9 and VKORC1 genotypes and warfarin dosing. Clin Pharmacol Ther 2011;90:625-629. doi: 10.1038/clpt.2011.185.
8. Ansell J, Hirsh J, Hylek E, Jacobson A, Crowther M, Palareti G. Pharma- cology and Management of the Vitamin K Antagonists: American College of Chest Physicians Evidence-Based Clinical Practice Guidelines (8th Edition). Chest 2008;133:160S-198S. doi: 10.1378/chest.08-0670.
9. Ufer M. Comparative pharmacokinetics of vitamin K antagonists: warfarin, phenprocoumon and acenocoumarol. Clin Pharmacokinet 2005;44:1227- 1246. doi: 10.2165/00003088-200544120-00003.
10. Wells PS, Holbrook AM, Crowther NR, Hirsh J. Interactions of warfarin with drugs and food. Ann Intern Med 1994;121:676-683.
11. Harder S, Graff J. Novel oral anticoagulants: clinical pharmacology, indi- cations and practical considerations. Eur J Clin Pharmacol 2013;69:1617- 1633. doi: 10.1007/s00228-013-1510-z.
12. Gous T, Couchman L, Patel JP, Paradzai C, Arya R, Flanagan RJ. Mea- surement of the direct oral anticoagulants apixaban, dabigatran, edoxa- ban, and rivaroxaban in human plasma using turbulent flow liquid chroma- tography with high-resolution mass spectrometry. Ther Drug Monit 2014;36:597-605. doi: 10.1097/FTD.0000000000000059.
13. Wong PC, Pinto DJ, Zhang D. Preclinical discovery of apixaban, a direct and orally bioavailable factor Xa inhibitor. J Thromb Thrombolysis 2011;31:478-492. doi: 10.1007/s11239-011-0551-3.
14. Weitz JI. Meeting the unmet needs in anticoagulant therapy. Eur J Hae- matol Suppl 2010:1-28. doi: 10.1111/j.1600-0609.2010.01461.x.
15. Song Y, Chang M, Suzuki A, Frost RJ, Kelly A, LaCreta F, et al. Evaluation of Crushed Tablet for Oral Administration and the Effect of Food on Apixa- ban Pharmacokinetics in Healthy Adults. Clin Ther 2016;38:1674-1685.
e1671. doi: https://doi.org/10.1016/j.clinthera.2016.05.004.
16. Hillarp A, Gustafsson KM, Faxälv L, Strandberg K, Baghaei F, Blixter IF, et al. Effects of the oral, direct factor Xa inhibitor apixaban on routine coagu- lation assays and anti-FXa assays. J Thromb Haemost 2014;12:1545- 1553. doi: 10.1111/jth.12649.
17. Beyer J, Trujillo T, Fisher S, Ko A, Lind SE, Kiser TH. Evaluation of a Heparin-Calibrated Antifactor Xa Assay for Measuring the Anticoagulant Effect of Oral Direct Xa Inhibitors. Clin Appl Thromb Hemost 2016;22:423- 428. doi: 10.1177/1076029616629759.
18. Douxfils J, Pochet L, Lessire S, Vancraeynest C, Dogné J-M, Mullier F.
Mass spectrometry in the therapeutic drug monitoring of direct oral antico- agulants. Useful or useless? TrAC Trends Analyt Chem 2016;84:41-50.
doi: https://doi.org/10.1016/j.trac.2016.01.029.
19. Lim MS, Chapman K, Swanepoel P, Enjeti AK. Sensitivity of routine co- agulation assays to direct oral anticoagulants: patient samples versus commercial drug-specific calibrators. Pathology 2016;48:712-719. doi:
https://doi.org/10.1016/j.pathol.2016.07.008.
20. Harenberg J, Kraemer S, Du S, Giese C, Schulze A, Kraemer R, et al.
Determination of direct oral anticoagulants from human serum samples.
Semin Thromb Hemost 2014;40:129-134. doi: http://dx.doi.org/10.1055/
s-0033-1363462.
21. Schmitz EM, Boonen K, van den Heuvel DJ, van Dongen JL, Schellings MW, Emmen JM, et al. Determination of dabigatran, rivaroxaban and apixaban by ultra-performance liquid chromatography - tandem mass spectrometry (UPLC-MS/MS) and coagulation assays for therapy moni- toring of novel direct oral anticoagulants. J Thromb Haemost 2014;12:
1636-1646. doi: 10.1111/jth.12702.
22. Saint-Marcoux F, Sauvage FL, Marquet P. Current role of LC-MS in thera- peutic drug monitoring. Anal Bioanal Ch 2007;388:1327-1349.
23. Lim CK, Lord G. Current developments in LC-MS for pharmaceutical analysis. Biol Pharm Bull 2002;25:547-557.
24. Baldelli S, Cattaneo D, Pignatelli P, Perrone V, Pastori D, Radice S, et al.
Validation of an LC–MS/MS method for the simultaneous quantification of dabigatran, rivaroxaban and apixaban in human plasma. Bioanalysis 2016;8:275-283. doi: 10.4155/bio.15.261.
25. Guidance for Industry - Bioanalytical Method Validation (2013) FDA.
https://www.fda.gov/downloads/drugs/guidances/ucm368107.pdf. Accessed 21 June 2018
26. Guideline on bioanalytical method validation (2013) Korea Ministry of Food and Drug Safety. http://nifds.go.kr/_custom/nifds/_common/board/
download.jsp?attach_no=18470. Accessed 21 June 2018
27. Baig MLA, Ali SA. A Validated LC-MS/MS Method for the Estimation of Apixaban in Human Plasma. J App Pharm Sci 2017;7:044-052.
28. Zhang WL, Lou D, Zhang DT, Zhang Y, Huang HJ. Determination of rivar- oxaban, apixaban and edoxaban in rat plasma by UPLC–MS/MS method.
J Thromb Thrombolysis 2016;42:205-211. doi: 10.1007/s11239-016- 1367-y.
29. Douxfils J, Chatelain C, Chatelain B, Dogné JM, Mullier F. Impact of apix- aban on routine and specific coagulation assays: a practical laboratory guide. Thromb Haemost 2013;110:283-294. doi: 10.1160/TH12-12-0898.
30. Shin H, Cho MC, Kim RB, Kim CH, Choi NC, Kim SK, et al. Laboratory measurement of apixaban using anti-factor Xa assays in acute ischemic stroke patients with non-valvular atrial fibrillation. J Thromb Thrombolysis
TCP
Transl Clin Pharmacol
Hyeon-Cheol Jeong, et al.
2018;45:250-256. doi: 10.1007/s11239-017-1590-1.
31. Gouin-Thibault I, Flaujac C, Delavenne X, Quenet S, Horellou MH, La- porte S, et al. Assessment of apixaban plasma levels by laboratory tests:
suitability of three anti-Xa assays. Thromb Haemo 2014;112:240-248. doi:
10.1160/TH13-06-0470.
32. Derogis PB, Sanches LR, de Aranda VF, Colombini MP, Mangueira CL, Katz M, et al. Determination of rivaroxaban in patient’s plasma samples by anti-Xa chromogenic test associated to High Performance Liquid Chroma- tography tandem Mass Spectrometry (HPLC-MS/MS). PLoS One 2017;12:e0171272. doi: 10.1371/journal.pone.0171272.
33. Newall F. Anti-factor Xa (Anti-Xa) Assay. In: Monagle P (ed) Haemostasis:
Methods and Protocols. Humana Press, Totowa, NJ, 2013;265-272.
doi:10.1007/978-1-62703-339-8_19
34. Vogeser M, Seger C. A decade of HPLC–MS/MS in the routine clinical laboratory — Goals for further developments. Clin Biochem 2008;41:649- 662. doi: 10.1016/j.clinbiochem.2008.02.017.
35. Skeppholm M, Al-Aieshy F, Berndtsson M, Al-Khalili F, Rönquist-Nii Y, Söderblom L, et al. Clinical evaluation of laboratory methods to monitor apixaban treatment in patients with atrial fibrillation. Thromb Res 2015;136:148-153. doi: https://doi.org/10.1016/j.thromres.2015.04.030.
36. Pursley J, Shen JX, Schuster A, Dang OT, Lehman J, Buonarati MH, et al.
LC–MS/MS determination of apixaban (BMS-562247) and its major me- tabolite in human plasma: an application of polarity switching and mono- lithic HPLC column. Bioanalysis 2014;6:2071-2082. doi: 10.4155/bio.14.66.
37. Ashri NY, Abdel-Rehim M. Sample treatment based on extraction tech- niques in biological matrices. Bioanalysis 2011;3:2003-2018. doi: 10.4155/
bio.11.201.
38. Kole PL, Venkatesh G, Kotecha J, Sheshala R. Recent advances in sam- ple preparation techniques for effective bioanalytical methods. Biomed Chromatogr 2011;25:199-217. doi: 10.1002/bmc.1560.
39. Wiesen MH, Blaich C, Streichert T, Michels G, Müller C. Paramagnetic micro-particles as a tool for rapid quantification of apixaban, dabigatran, edoxaban and rivaroxaban in human plasma by UHPLC-MS/MS. Clin Chem Lab Med 2017;55:1349-1359. doi: 10.1515/cclm-2016-0888.
40. Frost C, Wang J, Nepal S, Schuster A, Barrett YC, Mosqueda-Garcia R, et al. Apixaban, an oral, direct factor Xa inhibitor: single dose safety, pharma- cokinetics, pharmacodynamics and food effect in healthy subjects. Br J Clin Pharmacol 2013;75:476-487. doi: 10.1111/j.1365-2125.2012.04369.x.
41. Upreti VV, Wang J, Barrett YC, Byon W, Boyd RA, Pursley J, et al. Effect of extremes of body weight on the pharmacokinetics, pharmacodynamics, safety and tolerability of apixaban in healthy subjects. Br J Clin Pharmacol 2013;76:908-916. doi: 10.1111/bcp.12114.
42. Cui Y, Song Y, Wang J, Yu Z, Schuster A, Barrett YC, et al. Single-and multiple-dose pharmacokinetics, pharmacodynamics, and safety of apixa- ban in healthy Chinese subjects. Clin Pharmacol 2013;5:177-184. doi:
10.2147/CPAA.S51981.
43. Dimatteo C, D'Andrea G, Vecchione G, Paoletti O, Tiscia GL, Santacroce R, et al. ABCB1 SNP rs4148738 modulation of apixaban interindividual vari- ability. Thromb Res 2016;145:24-26 doi: 10.1016/j.thromres.2016.07.005.
44. Ueshima S, Hira D, Fujii R, Kimura Y, Tomitsuka C, Yamane T, et al. Impact of ABCB1, ABCG2, and CYP3A5 polymorphisms on plasma trough concentra- tions of apixaban in Japanese patients with atrial fibrillation. Pharmacogenet Genomics 2017;27:329-336. doi: 10.1097/FPC.0000000000000294.