Print ISSN: 2233-4165 / Online ISSN 2233-5382 doi:http://dx.doi.org/10.13106/ijidb.2019.vol10.no12.7
A Study on the Effect of Win-win Growth Policies on Sustainable Supply Chain and Logistics Management in South Korea
Ki-Hyung KIM*, Sang Hwa SONG**
Received: October 27, 2019 Revised: November 15, 2019 Accepted: December 05, 2019
Abstract
Purpose: In Korea, win-win growth policy has been successfully implemented in supply chain and logistics management. In the policy, it is recommended to support supply chain partners with various mechanisms including financial and technical aids. This study attempts to scientifically analyze the effects of direct and indirect win-win growth policy factors on supply chain and logistics management performance through partnership factors. Research design, data and methodology: This study builds a structural equation model reflecting the relationship between the win-win growth policy, partnership and performance factors. The proposed model is verified with the PLS (Partial Least Squares regression) methodology. Data from shipper and logistics companies were collected and analyzed by the PLS model. Results: The analysis showed that both direct and indirect policy factors are meaningful to improve supply chain and logistics performance. Indirect support factors including R&D, management innovation, human resources development and educational supports have positive impacts on partnership factors.
Direct support factors including financial aids and fairness also have positive impacts on the performance. Conclusions: This study is meaningful in that it suggests a turning point in which supply chain Win-win growth and partnership efforts are perceived as new value-creating mechanism rather than unilateral cost reduction for logistics industry.
Keywords: Supply Chain Management, Win-win Growth, Partnership, Structural Equation JEL Classification Code: A13, H11, M14
1. Introduction 1
The rapid changes in today's business environment are driving companies to develop value-added processes that deliver timely, innovative, high-quality, affordable products at a faster rate and more responsive manner. In this process, companies have realized that it is difficult to connect and optimize the entire process, only utilizing a single organizational upgrade for each company and to focus on supply chain management (SCM) to integrate resources across organizational and intercompany boundaries (Fawcett & Magnan, 2001).
Due to the characteristics of the Korean economy, the relationship between large corporations and SMEs has a
1 Ph.D. Student, Graduate School of Logistics, Incheon National University, Korea, Email: [email protected]
2 Corresponding Author: Professor, Graduate School of Logistics, Incheon National University, Korea, Email: [email protected]
© Copyright: Korean Distribution Science Association (KODISA)
This is an Open Access article distributed under the terms of the Creative Commons Attribution Non- Commercial License (https://creativecommons.org/licenses/by-nc/4.0/) which permits unrestricted non- commercial use, distribution, and reproduction in any medium, provided the original work is properly cited.
unique structure of asymmetric subcontracting, and economic imbalances persist. Short- and long-term social institutions and infrastructure and establishing a cooperative relationship between large companies and SMEs are necessary to solve this problem. However, voluntary participation is low because Win-win growth activities are linked to costs related to social contribution.
Therefore, in order to encourage and reinforce corporate Win-win growth activities, it is necessary to establish policy support measures by government authorities that can function properly.
According to the results of the 2018 Small and Medium Business Survey conducted by the Korea Commission on Win-win growth among 14,065 large companies in 2018, the average score for Win-win growth was 79.3 points, down 1.2 points from the previous year. In the case of 'trade relations,' the index was the same as the previous year, at 88.2 points but the 'cooperation relationship' was down 2.9 points to 56.4 points. Secondary supplier sentiment was also down 1.7 points year-on-year to 64.5 points. For SMEs, these activities are limited to short-term, one-off financial support from large companies, and do not
establish long-term partnerships.
The Commission on Win-win growth defined the cooperative interrelationships between large and small businesses as value-creating indirect support, including establishing a partnership culture, which requires long-term time and investment, and support for research/technology, management innovation and education.
Based on the structural model of the partnership, this study will scientifically analyze the effects of Win-win growth direct and indirect support factors on SCM performance through partnership, proving the relevance of Win-win growth strategies and presenting their strategic
direction.
The composition of this study follows the introduction.
Chapter 2 describes the theoretical background and Chapter 3 describes the necessary contents to present the research hypothesis and prove the research purpose.
Chapter 4 presents the results of the verification of the research model to suit the purpose of the study, and Section 5 summarizes the results and limitations.
2. Theoretical Background
2.1. Win-win Supply Chain Growth
Win-win growth entails Win-win growth and development influenced by the will of the counterparties between companies in supply chain. However, few studies have empirically analyzed the effects of SCM performance by analyzing Win-win growth, partnerships, and causality in South Korea. The strategies for Win-win growth are necessary to resolve the polarization and conflict between large and small businesses. Win-win growth should go beyond inter-enterprise issues and draw on its members' potential and innovative efforts from the perspective of the supply chain ecosystem (Lansiti & Levien, 2004). Hahn and Kim (2016) investigated the relationship between corporate social responsibility on business performances.
In this study, the contractual relationship is defined as the "direct support factor" and the cooperative relationship as the "indirect support factor" based on the assessment of small business Win-win growth sentiment among the Commission for Win-win growth index. It defines supply chain Win-win growth as an effort to generate SCM performance through active member participation based on government strategies in the supply chain.
2.2. Supply Chain Partnership
In order to build a successful supply chain, the company’s relationship, or partnership, with suppliers is important. The more successful a partnership is among the
members of the supply chain, the more economical service performance will be. Based on mutual trust, the partnership defined risks and rewards as creating greater results than individual company efforts (Lansiti & Levien, 2004).
Supply chain partnership is defined as a cooperative relationship in which profits, information, and risks are shared based on mutual trust, and customer value is maximized for supply chain performance. Additionally, the supply chain partnership properties were divided into emotional and behavioral factors; emotional factors being relationship immersion and trust, and the behavioral factor being cooperation. Relationship immersion is defined as a desire to maintain a buyer-provider relationship, and trust is defined as respect for the other party based on mutual beliefs. Cooperation is defined as participation in achieving performance with partners (Morgan & Hunt, 1994).
2.3. SCM Performance
Typical corporate performance is regarded as operational performance, including reducing costs, improving product quality, improving reliability of the delivery period and improving the efficiency of production activities, or analyzed as financial performance, including increased sales, increased market share, and return on investment (Zelbst, Green, & Reyes, 2012). Ishaq (2012) reviewed triple-A supply chain performances including agility, adaptability and alignment. Nong and Ho (2019) studied supplier selection strategies, which have impacts on supply chain performances and Potluri, Lee, and Potluri (2017) looked at Halal supply chain performances in Indian industry.
SCM performance can be divided into quantitative and qualitative performance. More specifically, financial performance such as cost performance, profitability, investment performance, and growth were classified in detail by qualitative performance, including reducing lead time, product inventory rate, logistics cost, long-term storage materials, and work-process efficiency as well as improving productivity (Harland, 1996). Ryu (2019) studied the impact of quick response strategy on SCM performance and Suong (2017), Song and Park (2016), and Kim and Song (2013) investigated the influence of business factors on supply chain performances.
In this study, sales and profit financial indicators and productivity maximization, a measure of production operation, were defined as SCM performance. The previous research focused on the supply chain partnership factors on performances and concluded that better partnership arrangement have positive impacts on performances. However, it was not clear how win-win growth policies – direct and indirect – have influences on performances.
3. Research Model and Hypothesis
3.1. Research Model and Hypothesis Setting
This study defines Win-win growth as Win-win growth and development influenced by the will of the business partners, while Lansiti and Levien (2004) define supply chain partnership as creating more common results than the companies' individual efforts based on mutual trust.
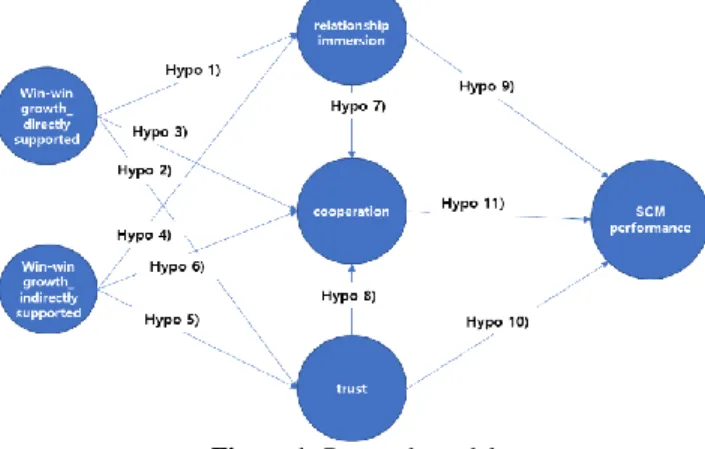
Figure 1: Research model
This study sets up the following research models to analyze the effects of Win-win growth factors on partnership and SCM performance.
By referring to the major assessment items of the Commission on Win-win growth for Small and Medium Businesses, the Commission classified these items into direct and indirect support for Win-win growth. The emotional properties of the partnership are defined as relationship immersion and trust, and the behavioral properties as cooperation, which have a positive effect on SCM performance. Thus, assuming Win-win growth and partnership factors have a significant impact on SCM performance, the hypothesis was established as follows.
Based on the theory that direct support, such as contracts and funding, and indirect support, such as research/technology support, and value-creating interrelationships, such as management innovation and educational support, have positive effects on the partnership, the following research theory was established.
In addition, the following study was established by referring to the study on the effects of supply chain partnership factors on SCM performance (Morgan & Hunt, 1994).
Table 1: Operational Definition and Measurement Factors of Variables
Organization concept Survey Items Soueses
Win-win Growth
Direct support
Fairness and degree of fairness in terms of business conditions
between partners, and the provision of a funding system Key Assessment Items for the Small and Medium Business Win-win growth Sensitivity Survey (Basic structure for calculating the Win-win growth index of the growth committee)
Indirect support
Level of R&D and technical support among partners, management innovation support, human resources development and educational support, etc.
Supply Chain Partnership Properties
Emotional Factors
Relationshi p immersion
Recognize the importance of relationships among partners, make efforts to maintain and support them
Spekman et al. (1998), Anderson & Narus (1990), Anderson & Weitz (1992), Mohr & Spekman (1994), Morgan & Hunt (1994)
Trust
Degree of trust between partners, degree of confidence in appointments or transactions, expectations of positive behavior
Anderson & Narus (1990), Morgan & Hunt (1994), Doney & Cannon (1997), Kumar et al. (1996) Behavioral
Factors
Cooperatio n
Partner-to-partner efforts to achieve joint goals, degree of formal and informal cooperation, and sharing of tangible and intangible resources
Khan (1996), Kwon & Suh (2004) SCM
Performanc e
Profit Degree of improvement in profit Harland (1996),
Morgan & Hunt (1994), Zelbst, Green, & Reyes (2012) Productivity Increase productivity through transactions
H1: Directly supported Win-win growth factors will have a positive effect on relationship immersion.
H2: Directly supported Win-win growth factors will have a positive effect on trust.
H3: Directly supported Win-win growth factors will have a positive effect on cooperation.
H4: Indirectly supported Win-win growth factors will have a positive effect on relationship immersion.
H5: Indirectly supported Win-win growth factors will have
a positive effect on trust.
H6: Indirectly supported Win-win growth factors will have a positive impact on cooperation.
H7: Relationship immersion will have a positive effect on cooperation.
H8: Trust will have a positive effect on cooperation. SCM performance.
H10: Trust will have a positive impact on SCM performance.
H11: Cooperation will have a positive impact on SCM performance.
3.2. Operational Definition of Research Variables
This study developed the operational definition of each research variable by adding a prior supply chain partnership study and the assessment item of the Commission on Win-win growth for Small and Medium Businesses. Some modifications and supplements were made to suit the purpose of the study on the structural relationship between Win-win growth and partnership factors. Measurement items for each concept of composition were developed based on prior studies and are presented in Table 1. The measurement items of all the component concepts used consisted of two or more multiple numbers, each of which utilized a five-point scale of Likert and indicated the extent to which the respondent agreed with each item.
4. Empirical Research
4.1. Collection of Research Methods and Data An operational definition was performed so that the study model could be designed and each potential factor could be measured. The survey was conducted on a five- points Likert scale by compiling a questionnaire consisting of 17 items, including two Win-win growth direct support, three Win-win growth indirect support, three relationship immersion, three cooperation, three trust, and three SCM performance.
The data collection was conducted using the Google questionnaire survey method, and the data was collected by distributing the questionnaire to employees in the same supply chain. The surveyed companies were limited to shipper companies and logistics companies within the steel supply chain. The time period for the primary logistics companies of this study was approximately two weeks from June 18, 2018 to June 30, 2018 and the second survey was conducted for the shipper companies in October. We chose two shipper companies and 46 logistics companies doing business with them. A total of 165 questionnaires were retrieved from the survey, 163 of which were used for the study, excluding two questionnaires that were judged to be non-responsive or non-faithful.
The Partial Least Square method was used for analysis in this study. PLS assumes a different approach to analysis than other structural models (Fornell & Larker, 1981). The PLS analysis is based on a principal component analysis and does not assume a normal distribution from the
variable measurement results or residual items. In addition, the PLS analysis validates statistical significance to hypotheses through bootstrapping methods that include re- sampling (Ringle, Wende, & Becker, 2015), and results from path analyses can be obtained in a relatively small number of samples (Won, 2016). Finally, reliability verification and hypothesis testing of the study model can be performed simultaneously. Although the PLS analysis does not produce a model conformance index separately, unlike other structural models, recent studies show that the Global-of-Fit (GoF) is calculated to examine suitability (Tenhaus, Amato, & Binzi, 2004). In addition, the R Square value explains of the preceding variable (Won, 2016). Therefore, PLS analysis can be considered the most feasible in this study.
4.2 Empirical Analysis
4.2.1. Sample Characteristics
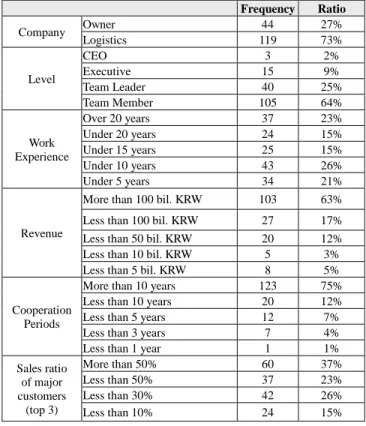
Frequency analysis was performed to examine the characteristics of the samples subject to the empirical analysis. According to the analysis, 27% of the respondents were from the shipper companies and 73% from the logistics companies. The frequency analysis results for general matters are shown in Table 2.
Table 2: Sample Characteristics
Frequency Ratio
Company Owner 44 27%
Logistics 119 73%
Level
CEO 3 2%
Executive 15 9%
Team Leader 40 25%
Team Member 105 64%
Work Experience
Over 20 years 37 23%
Under 20 years 24 15%
Under 15 years 25 15%
Under 10 years 43 26%
Under 5 years 34 21%
Revenue
More than 100 bil. KRW 103 63%
Less than 100 bil. KRW 27 17%
Less than 50 bil. KRW 20 12%
Less than 10 bil. KRW 5 3%
Less than 5 bil. KRW 8 5%
Cooperation Periods
More than 10 years 123 75%
Less than 10 years 20 12%
Less than 5 years 12 7%
Less than 3 years 7 4%
Less than 1 year 1 1%
Sales ratio of major customers
(top 3)
More than 50% 60 37%
Less than 50% 37 23%
Less than 30% 42 26%
Less than 10% 24 15%
Table 3: Reliability Analysis
4.2.2. Reliability and Feasibility Analysis
This study used the PLS mode to verify the research model. The questionnaire used in the study was analyzed for reliability and discriminant validity according to the subjective perception of respondents. Factor analysis of each variable was conducted to test the suitability and reliability of the model. Principal component analysis was applied to factor extraction. In factor rotation, the orthogonal transverse method (Varimax) with a loading of 0.5 was used.
The results of the Cronbach's Alpha values, which measure the reliability of latent variables, were all located between 0.7 and 0.9 except for Win-win growth direct support, thus securing a desirable reliability of 0.7 or higher. However, the Win-win growth direct support of the research model is 0.679, which is considered acceptable.
As a method of measuring the goodness of fit of the research model, the composite reliability indicating convergent validity was 0.86 or more, exceeding the general standard of 0.7, and it was judged to have internal consistency and convergence validity. As a result of verifying the AVE value of each latent variable, all the variables were located between 0.732 ~ 0.886 and were larger than the reference point 0.5.
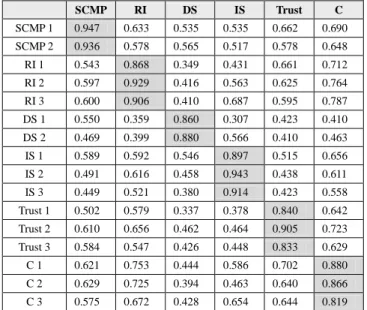
Cross-loading analysis and AVE square root analysis were performed to verify the discriminant validity. As
shown in <Table 4>, it can be judged that the discriminant validity is secured because all the external loadings of all the measurement variables exceed the cross-loadings.
Since the AVE square root of each latent variable is larger than the highest value among the correlations among the latent variables, it is judged that there is discriminant validity.
Table 4: Cross-loading Analysis
SCMP RI DS IS Trust C
SCMP 1 0.947 0.633 0.535 0.535 0.662 0.690 SCMP 2 0.936 0.578 0.565 0.517 0.578 0.648 RI 1 0.543 0.868 0.349 0.431 0.661 0.712 RI 2 0.597 0.929 0.416 0.563 0.625 0.764 RI 3 0.600 0.906 0.410 0.687 0.595 0.787 DS 1 0.550 0.359 0.860 0.307 0.423 0.410 DS 2 0.469 0.399 0.880 0.566 0.410 0.463 IS 1 0.589 0.592 0.546 0.897 0.515 0.656 IS 2 0.491 0.616 0.458 0.943 0.438 0.611 IS 3 0.449 0.521 0.380 0.914 0.423 0.558 Trust 1 0.502 0.579 0.337 0.378 0.840 0.642 Trust 2 0.610 0.656 0.462 0.464 0.905 0.723 Trust 3 0.584 0.547 0.426 0.448 0.833 0.629 C 1 0.621 0.753 0.444 0.586 0.702 0.880 C 2 0.629 0.725 0.394 0.463 0.640 0.866 C 3 0.575 0.672 0.428 0.654 0.644 0.819
* SCMP (SCM Performance), RI (Relationship Immersion), DS (Direct Support), IS (Indirect Support), C (Cooperation)
Table 5: Fitness Analysis
R Square R Square Adj.
SCM Performance 0.540 0.528
Relationship Immersion 0.415 0.405
Trust 0.320 0.308
Cooperation 0.798 0.791
Based on the above reliability and discriminant validity analysis, it was concluded that the measurement results used in this study secured reliability and validity. The results of the PLS model fitness analysis for the hypothesis of this study are shown in <Table 5>.
The modified R Square value of the causal model for endogenous variables was over 0.308. A value of 0.25 indicates a weak value, a value of 0.50 indicates a moderate value, and a value of 0.75 indicates a substantial value (Hair, Hult, Ringle, & Sarstedt, 2011; Henseler et al., 2009). According to Cohen (1988), when the R Square value is 0.26 or more, the goodness-of-fit of the structural model is classified as high.
Variables Loading AVE CR Alpha
Win-win Growth:
Directly Supported 1 0.860
0.757 0.862 0.679 Win-win Growth:
Directly Supported 2 0.880 Win-win Growth:
Indirectly Supported 1 0.897
0.843 0.942 0.907 Win-win Growth:
Indirectly Supported 2 0.943 Win-win Growth:
Indirectly Supported 3 0.914
Cooperation 1 0.880
0.732 0.891 0.816
Cooperation 2 0.866
Cooperation 3 0.819
SCM Performance
(Productivity) 0.947
0.886 0.940 0.872 SCM Performance
(Profit) 0.936
Relationship
Immersion 1 0.868
0.812 0.928 0.884 Relationship
Immersion 2 0.929
Relationship
Immersion 3 0.906
Trust 1 0.840
0.739 0.895 0.823
Trust 2 0.905
Trust 3 0.833
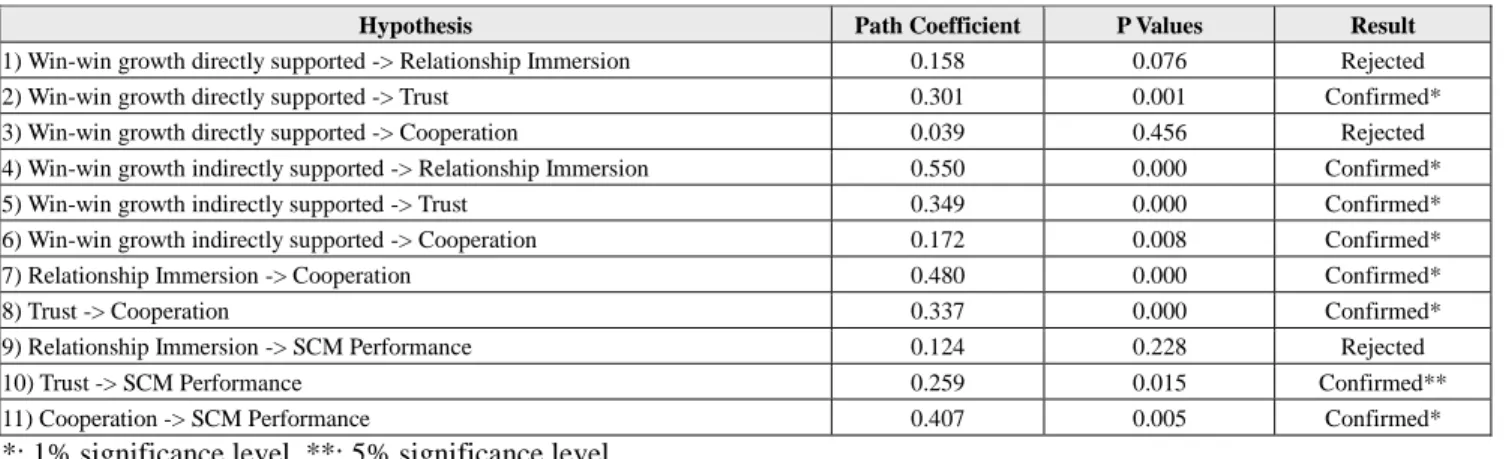
Table 6: Hypothesis Test Results
*: 1% significance level, **: 5% significance level 4.2.3. Hypothesis Verification Results
The results of analyzing the path coefficients and significance levels for the overall research hypothesis are shown in <Table 6>.
Overall, the path coefficients and the R square values between the constructs can be used to explain the Win-win growth factors and partnership factors that directly or indirectly affect the SCM performance.
Figure 2: Hypothesis Test Results
5. Conclusion
This study analyzed the effects of direct and indirect support factors on Win-win growth in the supply chain on relationship immersion, trust, and cooperation, which are partnership factors, as well as the effects on SCM performance. Previous studies have examined the positive effects of partnership factors on SCM performance, but few cases have examined whether the direct and indirect support factors for Win-win growth affect partnership and SCM performance.
A structural model was established to identify causality and path coefficients. Based on the research model, research data was collected through surveys of shipper and logistics companies in the supply chain and the hypothesis on the effect of the direct and indirect characteristics of Win-win growth factors on the partnership factors and SCM performance was demonstrated.
The following implications were derived from this study.
First, while maintaining existing short-term financial support, including improving transaction conditions, it is necessary to systematically implement various long-term Win-win growth strategies such as research, technology development, and education with partners for sustainable supply chain growth. For example, SMEs will be able to support their technological competitiveness by referring to Samsung Electronics' new technology development contest, technology data deposit system, and Hyundai Motor Group's customized technology support R & D system.
Second, if intensifying long-term relationship immersion and trust through indirect support of Win-win growth, SCM performance is the largest. This requires mutual efforts to increase continuous face-to-face contact and trust in work to build partnerships between shipper companies and logistics companies in the supply chain. Various large corporations run regular meetings for win-win growth, surveys on supplier satisfaction, and councils to continuously pursue efforts to strengthen long-term partnerships and trust.
Third, establishing partnerships through future Win-win growth activities requires substantial supply chain and logistics management led by large corporations. To this end, in addition to the existing financial support of large companies, implementation strategies for long-term value creation should be implemented. In order to achieve effective value-creating supply chain goals, customized efforts are needed to create synergy from the overall optimization perspective for individual suppliers.
Sustainable development is possible.
Lastly, it is proposed to develop fair indicators of SCM
Hypothesis Path Coefficient P Values Result
1) Win-win growth directly supported -> Relationship Immersion 0.158 0.076 Rejected
2) Win-win growth directly supported -> Trust 0.301 0.001 Confirmed*
3) Win-win growth directly supported -> Cooperation 0.039 0.456 Rejected
4) Win-win growth indirectly supported -> Relationship Immersion 0.550 0.000 Confirmed*
5) Win-win growth indirectly supported -> Trust 0.349 0.000 Confirmed*
6) Win-win growth indirectly supported -> Cooperation 0.172 0.008 Confirmed*
7) Relationship Immersion -> Cooperation 0.480 0.000 Confirmed*
8) Trust -> Cooperation 0.337 0.000 Confirmed*
9) Relationship Immersion -> SCM Performance 0.124 0.228 Rejected
10) Trust -> SCM Performance 0.259 0.015 Confirmed**
11) Cooperation -> SCM Performance 0.407 0.005 Confirmed*
performance led by relevant organizations such as the government and the Win-win growth committee. In order for the existing Win-win growth activities to be recognized as a cost and to promote sustainable Win-win growth, rather than temporary support or cooperation, participation of Win-win growth by shipper companies and logistics companies in the supply chain will be the total value of the company and the entire supply chain. Empirical evidence of the increase could facilitate voluntary participation by shipper companies and logistics companies.
This study is meaningful in that it suggests a turning point in which supply chain Win-win growth and partnership efforts are perceived as new value-creating rather than unilateral cost. In addition, we recognized the importance of active participation in Win-win growth among the members of the supply chain and derived implications for future strategies establishment. ‘
However, the choice of subjects for empirical analysis in this study was limited to specific shipper companies and their logistics companies, and the analysis of the entire industry was not carried out. The analytical results demonstrated in this study are difficult to apply to all industries and supply chain companies. In addition, since the bias may occur in the response by measuring the subjective judgment of the questionnaire regarding the Win-win growth and partnership components of the questionnaire, it is necessary to define the questionnaire and the questionnaire as a more objective measure.
Additional factors need to be added and complemented in the Win-win growth factor. Accordingly, efforts to obtain generalized conclusions by applying the structural properties of Win-win growth presented in this study to many relationships centered on more objective measurement indicators will be needed.
References
Anderson, J. C., & Narus, A. (1990). A Model of Distributor Firm and Manufacture Firm Working Partnerships. Journal of Marketing, 54, 42-58.
Anderson, E., & Weitz, B. (1992). The use of pledge to build and sustain commitment in distribution channels.
Journal of Marketing Research, 29, 18-34.
Chin, W. W. (1988). Issues and opinions on structural equation modeling. MIS Quarterly, 22(1), 7-16.
Cohen, J. (1988). Statistical power analysis for the behavioral sciences (2nd ed.). Hillsdale, NJ: Lawrence Erlbaum Associates.
Doney, P., & Cannon, J. (1997). An Examination of the Nature of Trust in Buyer-Seller Relationships. Journal of Marketing, 61, 35-51.
Fawcett, S. E., & Magnan, G. M. (2001). Achieving World- Class Supply Chain Alignment: Benefits, Barriers, and Bridges. Tempe, AZ: Center for Advanced Purchasing Studies.
Fornell, C., & Larcker, D. F. (1981). Structural equation models with unobservable variables and measurement error; Algebra and statistics. Journal of Marketing Research, 18(3), 382-388.
Hahn, Y.-N., & Kim, D.-H. (2016). Corporate Social Responsibility: A Comparison Analysis. The Journal of Business, Economics, and Environmental Studies, 6(4), 13~17.
Hair, J. F., Hult, G. T., Ringle, C. M., & Sarstedt, M. (2011).
PLs-SEM: Indeed A Silver Bullet. Journal of Marketing Theory and Practice, 19, 139-151.
Harland, C. M. (1996). Supply Chain Management:
Relationship, Chains, Networks. British Journal of Management, 7(1), S63-S80.
Iansiti, M., & Levien, R. (2004). Strategy as Ecology.
Harvard Business Review, 82(3), 68-78.
Ishaq, M. I., Hussain, N., Khaliq, W., & Waqas, M. (2012).
A Review on Triple-A Supply Chain Performance. The Journal of Business, Economics, and Environmental Studies, 2(2), 35-39.
Khan, K. B. (1996). Interdepartmental Integration: A Definition with Implications for Product Development Performance. Journal of Product Innovation Management, 13(2), 137-151.
Kim, T.-R., & Song, J.-G. (2013). The Effect of Asset Specificity, Information Sharing, and a Collaborative Environment on Supply Chain Management: An Integrated SCM Performance Formation Model.
Journal of Distribution Science, 11(4), 51-60.
Kumar, N., Scheer, L. K., & Steenkamp, J. (1996). The Effects of Perceived Interdependence on Dealer Attitudes. Journal of Marketing Research, 32(3), 348- 356.
Kwon, I. W., & Suh, T. W. (2004). Factors Affecting the Level of Trust and commitment in Supply Chain Relationship. Journal of Supply Chain Management, 40(2), 4-14.
Mohr, J., & Spekman, R. (1994). Characteristics of partnership success: Partnership attributes, Communication Behavior and Conflict Resolution Techniques. Strategic Management Journal, 15, 135- 152.
Morgan, R. M., & Hunt, S. D. (1994). The Commitment- trust theory of relationship marketing. Journal of Marketing, 58, 20-38.
Nong, N. -M. T., & Ho, P. T. (2019), Criteria for Supplier Selection in Textile and Apparel Industry: A Case Study in Vietnam. The Journal of Asian Finance, Economics and Business, 6(2), 213-221.
Potluri, R. M., Lee, J. W., & Potluri, L. S. (2017), An Exploratory Treatise on Consciousness and Espousal of Halal Supply-Chain: An Indian Perspective. The Journal of Asian Finance, Economics and Business, 4(2), 69-74.
Ringle, C. M., Wende, S., & Becker, J.-M. (2015).
SmartPLS 3, SmartPLS GmbH: Boenningstedt.
Retrieved July 1, 2019 from www.smartpls.com Ryu, C.-S. (2019). How Quick Response affects the Supply
Chain Performance. Journal of Distribution Science, 17(9), 5-13. doi: 10.15722/jds.17.9.201909.5
Song, J. -G., & Park, K. -H. (2016). Study on Effect of SCM Performance and ERP Diffusion through Supplier Development Maturity Model. Journal of Distribution Science, 14(5), 71-80.
Spekman, R. E., Kamauff, J. W. Jr., & Myhr, N. (1998). An empirical investigation into supply chain management:
A perspective on partnerships. International Journal of Physical Distribution and Logistics Management, 28(8), 630-650.
Suong, H. T. T. (2017), Factors Impacting on the Supply Chain Collaboration of the Furniture Industry in Vietnam. The Journal of Asian Finance, Economics and Business, 4(4), 67-77.
Tenenhaus, M., Amato, S., & Vinzi, V. E. (2004). A Global Goodness-of Fit Index for PLS Structural Equation Modeling, Oral Communication to PLS Club.
Win-win Growth Committee. (2019). Win-win Growth Index. Retrieved July 1, 2019 from http://www.winwingrowth.or.kr
Won, D.-H. (2016). An Analysis on Antecedents Path of Export Performance and Moderating Effects of Social Capital in Materials and Components SMEs. Journal of Distribution Science, 14(2), 135-144.
Zelbst, P. J., Sower, V. E., Green, K. W., & Reyes, P. M (2012). Impact of RFID on manufacturing effectiveness and efficiency. International Journal of Operations and Production Management, 32(3), 329-350.