1. Introduction
Crop phenology is the study of the timing of seasonal events such as vegetative and reproductive growth stages. Accurate monitoring of crop phenological stages is an important component of integrated farm management since it allows assessing if the most critical stages of growth occur during the growing season (Vina et al., 2004). While most monitoring practices can be delivered on the ground based on remote sensing techniques, some researchers showed that satellite data
can be an optional choice applicable for this task (Zhang et al., 2003; Sakamoto et al., 2005; Boschetti et al., 2009; Motohka et al., 2009; Son et al., 2014).
Phenological stages of paddy rice are generally divided into the vegetative (from transplanting to panicle initiation), reproductive (from panicle initiation to heading), and maturation (from heading to maturity) stages (Hardke, 2014). These stages influence the three yield components: 1) number of panicles per unit area, 2) the average number of grains produced per panicle, and 3) the average weight of the individual grain. These
Determining Canopy Growth Conditions of Paddy Rice via Ground-based Remote Sensing
Seunghyun Jo*, Jongmin Yeom**, and Jonghan Ko*
†*Applied Plant Science, Chonnam National University, 77 Younbong-ro, Buk-gu, Gwangju 500-757, Republic of Korea
**Satellite Applications Division, Korea Aerospace Research Institute, 169-84 Gwahak-ro, Yuseong-gu, Daejeon 305-806, Republic of Korea
Abstract : This study aimed to investigate the canopy growth conditions and the accuracy of phenological stages of paddy rice using ground-based remote sensing data. Plant growth variables including Leaf Area Index (LAI) and canopy reflectance of paddy rice were measured at the experimental fields of Chonnam National University, Gwangju, Republic of Korea during the crop seasons of 2011, 2012, and 2013. LAI values were also determined based on correlations with Vegetation Indices (VIs) obtained from the canopy reflectance.
Three phenological stages (tillering, booting, and grain filling) of paddy rice could be identified using VIs and a spatial index (NIR versus red). We found that exponential relationships could be applied between LAI and the VIs of interest. This information, as well as the relationships between LAI and VIs obtained in the present study, could be used to estimate and monitor the relative growth and development of rice canopies during the growing season.
Key Words : canopy growth, paddy rice, phenology, remote sensing, spatial index, vegetation index
Received January 28, 2015; Revised February 23, 2015; Accepted February 23, 2015.
†
Corresponding Author: Jonghan Ko ([email protected])
This is an Open-Access article distributed under the terms of the Creative Commons Attribution Non-Commercial License (http://creativecommons. org/licenses/by-nc/3.0) which permits unrestricted non-commercial use, distribution, and reproduction in any medium, provided the original work is properly cited
Article
three components eventually influence on grain yield.
The vegetative stage of rice is generally characterized by increase in number of tillers. During this period, paddy rice grows in occupied size rather than height for active photosynthesis. The reproductive stage is characterized by elongation of internodes, a decline in tiller numbers, booting, and heading. The grain filling and maturation stages are followed by ovary fertilization and characterized by grain growth. During this period, the grain increases in size and weight as the starch and sugars are translocated from the culms and leaf sheaths where they have accumulated, the grain changes color from green to gold at maturity, and the leaves of the paddy rice begin to senesce.
Remote sensing can be a useful tool applicable for the evaluation of crop growth and yield (Maas, 1992).
Remotely sensed reflectance values of wavebands (e.g., Green, Blue, Red, and Near-infrared) contain information on the scene of interest as they are absorbed, reflected, and transmitted by surface components (i.e., vegetative organisms, solids, and water molecules). VIs are combinations of surface reflectance at two or more wavelengths designed to highlight a particular property of vegetation. Distribution of canopy and condition of crop could be monitored using simple ratio of reflectance and VIs. Many studies have suggested VIs as being useful in evaluating crop growth (e.g., Yang et al., 2001; Boydell and McBratney, 2002; Zarco- Tejada et al., 2005). Meanwhile, LAI has been typically used as a structural index for determining canopy growth of various plants. LAI is highly correlated with crop biomass and productivity (Venkateswarlu et al., 1976; Dobermann and Pampolino, 1995). Based on the relationships between LAI and VIs, LAI values can be estimated by VI values (Xiao et al., 2002; Pontailler et al., 2003; Vina et al., 2011).
There have been earlier efforts to extract information on crop growth based on the combinations from remotely sensed scene features (e.g., Ayyangar et al., 1980; Casanova et al., 1999). One such an effort is to
extract crop growth information from the spectral relationship between NIR and Red. The objectives of this study were to determine canopy growth conditions and the accurate feature of phenological stages of paddy rice through ground-based remote sensing. LAI values were determined based on correlations with VIs obtained from canopy reflectance. The study was performed using the remote sensing data almost unaffected by the atmosphere.
2. Materials and Methods
1) Paddy rice data
Field data of paddy rice to monitor canopy growth conditions were collected from the experimental fields at Chonnam National University (35o 10’ N, 126o 53’
E; 33 m above sea level), Gwangju, Korea during the crop seasons in 2011, 2012, and 2013. Dongjin and Hopum were transplanted on 3 June 2011. Hwasunchal was transplanted on 28 May 2012. Unkwang was transplanted on 20 May 2013. The soil texture of the experimental paddy was classified as a loam based on the USDA classification method (for the more detailed soil properties, refer to Yun et al., 2011). Crops were sampled on Day Of Year (DOY) 188, 201, 215, 229, 243, and 257 in 2011; DOY 173, 201, 226, 237, and 262 in 2012; DOY 172, 190, 206, and 220 in 2013.
Four plants in 2011, twenty-four plants in 2012, forty plants in 2013 were randomly selected, cut, and transported to a laboratory where several plant growth parameters were measured. LAI was measured using a LI-2200 plant canopy analyzer (LI-COR, Lincoln, NE, USA). The LAI measurements were made on the same dates with the following remote sensing measurements.
2) Remote sensing data
A hand-held multispectral radiometer (CROPSCAN,
Rochester, MN, USA) was used to measure the
reflectance of paddy rice. It accommodates up to 16 bands, in the 450 ~ 1750 nm region, to measure incident and reflected radiations. The center wavebands (CWB) and bandwidths (BW) for the 16 filters used in this study is presented in Table 1.
The measurement conditions of the radiometer were a 28-degree field of view for the reflected irradiation sensors and vertically 2 m in height above target areas to measure 1 m in diameter. Measurements were made as many as 15 times in 2011, 12 times in 2012, and 15 times in 2013 with variation depending on the conditions during the crop growing seasons (Table 2).
The measurements were made within 2 hours of the local solar noon (12: 40 KST) on clear days but were delayed on some days with partial cloudiness to achieve measurement during clear-sky conditions. The measured canopy reflectance data were used to monitor canopy growth conditions of paddy rice using five VIs of interest as well as to determine phenological stages.
The five VI designs (Table 3) include Normalized Difference Vegetation Index (NDVI); Enhanced Vegetation Index (EVI), Re-normalized Difference Vegetation Index (RDVI), Optimized Soil-Adjusted Vegetation Index (OSAVI), and Modified Triangular Vegetation Index (MTVI).
3) Statistical analysis and evaluation of regression models
The paddy rice data in 2011 and 2012 were used for determination of relationships between LAI and VIs, applying regression models. Reproducibility of these models was verified, and accuracy of the verified models was validated using the 2013 paddy rice data.
Estimated LAI values were compared with the measured corresponding values. In both processes of verification and validation, three statistics indices were Table 1. Center wavebands and bandwidths of the 16 filters
used on the upward and downward facing sensors in the MSR16 hand-held remote sensing system Filter number Center waveband(nm) Bandwidths(nm)
1 460 9.8
2 500 8.8
3 560 9.7
4 600 9.4
5 660 10.8
6 700 10.0
7 750 10.6
8 800 61.9
9 880 10.4
10 980 10.4
11 1,080 13.5
12 1,200 10.0
13 1,300 11.9
14 1,500 12.7
15 1,600 13.5
16 1,700 15.4
Table 2. Days of year that measurements of the MSR16 hand- held remote sensing system were made during the rice growing seasons in 2011, 2012, and 2013
Year Day of year
2011 175, 188, 194, 201, 207, 215, 223, 229, 236, 237, 243, 245, 250, 257, 265 2012 173, 184, 193, 201, 207, 213, 226, 237, 243, 249, 262, 276 2013 167, 172, 182, 190, 192, 200, 206, 207, 213, 218, 220, 225, 232, 233, 240
Table 3. Vegetation indices used for rice growth phenological stage monitoring and leaf area index estimation
Vegetation index Equation
♩Normalized difference vegetation index (Rouse et al., 1974) (R
800_ R
660) / (R
800+ R
660) Enhanced vegetation index (Huete et al., 2002) 2.5 × (R
800_ R
660)
(R
800+ 6 × R
660_ 7.5 × R
560+ 1) Re-normalized difference vegetation index (Rougean and Breon., 1995) (R
800_ R
660) / (R
800+ R
660) Optimized soil-adjusted vegetation index (Rondeaux et al., 1996) (R
800_ R
660)/(R
800+ R
560+ 0.16) Modified triangular vegetation index (Haboudane et al., 2004) 1.2(1.2[R
800_ R
560] _ 2.5[R
660_ R
560])
♩
R
800, R
660, and R
560represent the reflectance values of each waveband of 800 nm, 660 nm, and 560 nm.
used to evaluate the regression model performance:
(1) Root Mean Square Difference (RMSD, Eq. 1), (2) Mean Relative Deviation (MRD, Eq. 2), and (3) Model Efficiency (E, Eq. 3) (Nash and Sutcliffe, 1970).
RMSD = ( ∑
ni = 1(S
i_ M
i)
2(1) MRD = ∑
ni = 1× 100% (2)
E = 1 _ (3) where, Si is the i
thsimulated value, M
iis the measured value, M
avgis the averaged measured value, and n is the whole number of data. E values are equivalent to the coefficient of determination.
3. Results and Discussion
1) Monitoring phenological stages
Seasonal changes of VIs in 2011, 2012, and 2013 showed apparent characteristics of phenological stages of paddy rice (Figs 1, 2, and 3). During the early growth stage (i.e., tillering), all VIs increased rapidly with increasing canopy growth. Values of NDVI, EVI, RDVI, OSAVI, and MTVI in 2011 ranged from 0.22 to 0.85, 0.12 to 0.66, 0.12 to 0.57, 0.15 to 0.59, and 0.08 to 0.60, respectively (Fig. 1). Values of NDVI, EVI, RDVI, OSAVI, and MTVI in 2012 ranged from 0.16 to 0.83, 0.10 to 0.56, 0.09 to 0.50, 0.11 to 0.55, and 0.08 to 0.48, respectively (Fig. 2). Values of (S
i_ M
i)
M
i1 n
∑
ni = 1(S
i_ M
i)
2∑
ni = 1(M
i_ M
avg)
2N 1
Fig. 1. Seasonal changes of Vegetation Indices [VIs (a-e)] and Leaf Area Index [LAI (f)] for Hopum and Dongjin in 2011.
Dashed vertical lines represent observed dates of rooting (DOY 161), panicle initiation (DOY 212), and heading (DOY 242), respectively The VIs are Normalized Difference Vegetation Index, NDVI (a), Enhanced Vegetation Index, EVI (b), Re-normalized Difference Vegetation Index, RDVI (c), Optimized Soil-Adjusted Vegetation Index, OSAVI (d), and Modified Triangular Vegetation Index, MTVI (e). Vertical bars represent ±1 SD from the mean values (n=16 for the VIs, n=4 for the LAI).
Fig. 2. Seasonal changes of Vegetation Indices [VIs (a-e)] and
Leaf Area Index [LAI (f)] for Hwasunchal in 2012. Dashed
vertical lines represent observed dates of rooting (DOY
156), panicle initiation (DOY 193), and heading (DOY
223), respectively. The VIs are Normalized Difference
Vegetation Index, NDVI (a), Enhanced Vegetation Index,
EVI (b), Re-normalized Difference Vegetation Index,
RDVI (c), Optimized Soil-Adjusted Vegetation Index,
OSAVI (d), and Modified Triangular Vegetation Index,
MTVI (e). Vertical bars represent ±1 SD from the mean
values (n=32 for the VIs, n=8 for the LAI).
NDVI, EVI, RDVI, OSAVI, and MTVI in 2013 ranged from 0.17 to 0.80, 0.08 to 0.49, 0.08 to 0.45, 0.10 to 0.51, and 0.07 to 0.40, respectively (Fig. 3).
During the booting stage, the VIs increased with relatively slow phases. The VIs generally reached a maximum either just before or at heading, except for MTVI in 2013 which reached a maximum right after heading. After heading, the VIs decreased while there were small year-to-year differences in decreasing rate.
It is assumed that the year-to-year variation is attributable to different cultivars and environmental variations for the different years. NDVI values were the highest among the other VIs over the growing seasons in all the three years. Meanwhile, LAI values rapidly increased until heading. In the current study, general growth features according to phenological
stages of paddy rice could be determined using VIs and LAI. Such trends have been also reported in other studies (Yang and Chen, 2004).
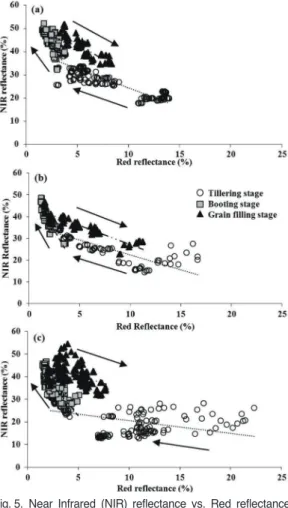
Three phenological main stages (i.e., tillering, booting, and grain filling) were identifiable using the relationships between NIR and Red reflectance for the 2011-2013 growing seasons (Fig. 4). During the tillering stage, Red reflectance decreased and NIR reflectance increased as number of tillers and chlorophyll pigments increased synchronously.
Reflectance features in the grain filling stage showed an opposite trend of the tillering stage. In the booting stage, Red reflectance remained relatively low (~
3.52%) and virtually invariant while NIR reflectance increased drastically (from 32.8 to 47.8%). Thus, these phenological stages can be clearly identified. The three phenological stages in 2011, 2012, and 2013 were separately identified using the spatial relationships between NIR and Red (Fig. 5). There were some quantitative differences in reflectance among the three years especially in the tillering stage. We assume this is mainly due to different physical conditions of the paddy field, such as different flooding depths and soil
Fig. 3. Seasonal changes of Vegetation Indices [VIs (a-e)] and Leaf Area Index [LAI (F)] for Unkwang in 2013. Dashed vertical lines represent observed dates of rooting (DOY 147), panicle initiation (DOY 185), and heading (DOY 211), respectively. The VIs are Normalized Difference Vegetation Index, NDVI (a), Enhanced Vegetation Index, EVI (b), Re-normalized Difference Vegetation index, RDVI (c), Optimized Soil-Adjusted Vegetation Index, OSAVI (d), and Modified Triangular Vegetation Index, MTVI (e). Vertical bars represent ±1 SD from the mean values (n=48 for the VIs, n=12 for the LAI).
Fig. 4. Near Infrared (NIR) reflectance vs. Red reflectance during the 2011-2013 growing seasons. Three phenological main stages, i.e., tillering (circle), booting (rectangle), and grain filling (triangle) were identifiable.
Vertical and horizontal bars represent ±1 SD from the
mean values (n=16, 32, 48 for the 2011, 2012, 2013,
respectively).
surface roughness in the early and late crop growing seasons when the canopies were not closed with vegetation. However, there were comparable linear relationships between Red and NIR reflectance for each phenological stage with those between the years. From this finding, we assume that it is possible to determine phenological aspects of rice growth qualitatively and quantitatively based on remote sensing techniques. The current results are generally corresponding to some of previous studies (e.g., Ayyangar et al., 1980; Casanova et al., 1999).
2) Monitoring canopy growth
(1) Relationships of canopy growth or LAI with biomass
A relationship between Above Ground Dry Weight (AGDW) and LAI was determined as an exponential function using the 2011, 2012, and 2013 data (Fig. 6).
The coefficient of determination (R
2) was 0.91.
Therefore, biomass or AGDW of paddy rice tends to increase exponentially as LAI increases. In remote sensing practices, canopy growth or LAI can be also estimated through regression models between LAI and VIs, which will be discussed in the following section.
The current result demonstrates that canopy growth and biomass of paddy rice can be potentially monitored utilizing remote sensing information or VIs which are calculated from remotely sensed reflectances of the crop canopy (see Table 3).
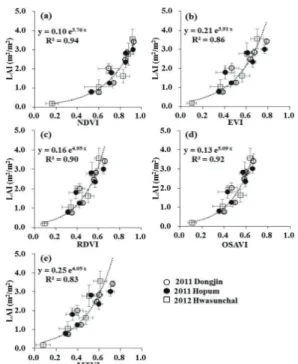
(2) Relationships of LAI with Vis
Relationships between LAI values and those of each VI were determined as exponential functions using the 2011 and 2012 data (Fig. 7). Five exponential function models were evaluated for their reproducibility using the data set above mentioned in verification and then using an independent data set in validation.
In verification, estimated LAI values agreed well with the corresponding measured LAI values with a Root Mean Square Difference (RMSD) of 0.30 m
2m
_2, Fig. 5. Near Infrared (NIR) reflectance vs. Red reflectance
during the growing seasons (a) in 2011, (b) in 2012, and (c) in 2013. Three phenological main stages (i.e., tillering, booting, and grain filling) were identifiable.
Fig. 6. Relationships between Above Ground Dry Weight
(AGDW) and leaf area index (LAI) using the 2011, 2012,
and 2013 data. Vertical and horizontal bars represent ±1
SD from the mean values (n=4, 24, 40 for the AGDW, n=4,
8, 12 for the LAI in 2011, 2012, and 2013 respectively).
Table 4. Root Mean Square Difference (RMSD), Mean Relative Deviation (MRD), and Model Efficiency (E) for the measured and estimated LAI values from different Vegetation Indices (VIs) in 2011 and 2012 in verification
VIs
♩RMSD(m
2/m
2) MRD(%) E
NDVI 0.30 0.7 0.90
EVI 0.54 5.4 0.69
RDVI 0.45 1.2 0.79
OSAVI 0.63 4.7 0.85
MTVI 0.63 4.4 0.59
♩
NDVI = Normalized Difference Vegetation Index; EVI = Enhanced Vegetation Index, RDVI = Re-normalized Difference Vegetation Index, OSAVI = Optimized Soil-Adjusted Vegetation Index, and MTVI = Modified Triangular Vegetation Index.
Fig. 7. Relationships between Leaf Area Index (LAI) and the Vegetation Indices (VIs) using the 2011 and 2012 data.
The VIs are normalized difference vegetation index, NDVI (a), Enhanced Vegetation Index, EVI (b), re- Normalized Difference Vegetation Index, RDVI (c), Optimized Soil-Adjusted Vegetation Index, OSAVI (d), and Modified Triangular Vegetation Index, MTVI (e).
Vertical and horizontal bars represent ±1 SD from the mean values (n=16, 32 for the VIs and n=4, 8 for the LAI in 2011, 2012 respectively).
Fig. 8. Estimated vs. measured Leaf Area Index (LAI) for the five different Vegetation Indices (VIs) in 2011 and 2012.
The VIs are Normalized Difference Vegetation Index, NDVI (a), Enhanced Vegetation Index, EVI (b), Re- normalized Difference Vegetation Index, RDVI (c), Optimized Soil-Adjusted Vegetation Index, OSAVI (d), and Modified Triangular Vegetation Index, MTVI (e).
Horizontal bars represent ±1 SD from the mean values (n=4 for the 2011, n=8 for the 2012).
Table 5. Root Mean Square Difference (RMSD), Mean Relative Deviation (MRD), and model Efficiency (E) for the measured and estimated LAI values from different Vegetation Indices (VIs) in 2013 in validation
VIs
♩RMSD(m
2/m
2) MRD(%) E
NDVI 0.79 -39.0 0.63
EVI 0.95 -41.4 0.46
RDVI 0.98 -43.8 0.43
OSAVI 0.75 -9.7 0.67
MTVI 1.11 -44.2 0.26
♩
![Fig. 1. Seasonal changes of Vegetation Indices [VIs (a-e)] and Leaf Area Index [LAI (f)] for Hopum and Dongjin in 2011.](https://thumb-ap.123doks.com/thumbv2/123dokinfo/5318176.385481/4.833.436.725.498.856/seasonal-changes-vegetation-indices-leaf-index-hopum-dongjin.webp)
![Fig. 3. Seasonal changes of Vegetation Indices [VIs (a-e)] and Leaf Area Index [LAI (F)] for Unkwang in 2013](https://thumb-ap.123doks.com/thumbv2/123dokinfo/5318176.385481/5.833.106.393.504.855/seasonal-changes-vegetation-indices-leaf-area-index-unkwang.webp)