http://crossmark.crossref.org/dialog/?doi=10.14474/ptrs.2019.8.4.175&domain=pdf&date_stamp=2019-12-25
Received: 22 October, 2019 Revised: 2 December, 2019 Accepted: 4 December, 2019 Corresponding author: Mansoor Alameri (ORCID https://orcid.org/0000-0002-7986-5765)
Department of Physical Therapy, School of Allied Health Professions, Loma Linda University, 24851 Circle Dr, Loma Linda, CA 92354, USA Tel: 1-909-558-4632 Fax: 1-909-558-8317 E-mail: [email protected]
This is an Open-Access article distributed under the terms of the Creative Commons Attribution Non-Commercial License (http://creativecommons.org/licenses/
by-nc/4.0) which permits unrestricted non-commercial use, distribution, and reproduction in any medium, provided the original work is properly cited.
Copyright © 2019 Korean Academy of Physical Therapy Rehabilitation Science https://doi.org/10.14474/ptrs.2019.8.4.175
pISSN 2287-7576 eISSN 2287-7584
Phys Ther Rehabil Sci 2019, 8 (4), 175-186 www.jptrs.org
Examination of trunk muscle co-activation during prolonged sitting in healthy adults and adults with
non-specific chronic low back pain based on the O’Sullivan Classification System
Mansoor Alameria,b, Everett Lohman IIIb, Noha Daherc, Hatem Jaberc,d
aDepartment of Clinical Research, Brockton Physical Therapy, Riverside, CA, USA
bDepartment of Physical Therapy, School of Allied Health Professions, Loma Linda University, Loma Linda, CA, USA
cDepartment of Allied Health Studies, School of Allied Health Professions, Loma Linda University, Loma Linda, CA, USA
dDepartment of Physical Therapy, School of Rehabilitative Sciences, University of St. Augustine for Health Sciences, Austin, TX, USA
Objective: Non-specific chronic low back pain (NS-CLBP) has been related to abnormal trunk muscle activations, but literature reported considerable variability in muscle amplitudes of NS-CLBP patients during prolonged sitting periods. Therefore, the pur- pose of this study was to examine the differences among homogenous NS-CLBP subgroups in muscle activity, using muscle co-contraction indices as a more objective approach, and their roles on pain development during a 1-hour period of prolonged sitting.
Design: Cross-sectional study.
Methods: Twenty NS-CLBP subjects with motor control impairment (MCI) [10 classified as having flexion pattern disorder, and 10 with active extension pattern disorder], and 10 healthy controls participated in the study. Subjects followed a 1-hour sitting pro- tocol on a standard office chair. Four trunk muscle activities including amplitudes and co-contraction indices were recorded using electromyography over the 1-hour period. Perceived back pain intensity was recorded using a numeric pain rating scale every 10 minutes throughout the sitting period.
Results: All study groups presented with no significantly distinctive trunk muscle activities at the beginning of sitting, nor did they change over time when pain increased to a significant level. Both MCI subgroups reported a similarly significant increase in pain behavior through mid-sitting (p<0.001). However, after mid-sitting, they significantly differed from each other in pain (p<0.01) but did not differ in the levels of muscle activation.
Conclusions: This study was the first to highlight the similarities in trunk muscle activities among homogenous NS-CLBP pa- tients related to MCI and compared them to healthy controls while sitting for an extended period of time, and the significant in- crease in pain over the 1-hour sitting might not be attributed to trunk muscle activation.
Key Words: Classification, Electromyography, Low back pain, Sitting position
Introduction
Low back pain (LBP) is a common health disorder related to physical, social and economic burden, and it has been rec- ognized as the leading cause of disability [1,2]. Its preva-
lence per month is estimated to be 23% in the general adult population and continues to rise [3]. Although, most LBP cases recover within 3 to 4 weeks [4-6], a large percentage continues to report long lasting disability related to the re- currence or chronicity of the LBP [6-8]. Approximately
85% of chronic LBP (CLBP) conditions are often known as non-specific CLBP (NSCLBP) due to the inability to identi- fy a specific pathology [6,7].
Abnormal neuromuscular control and its contribution to pain development has been well documented in patients with NS-CLBP [9,10]. Despite the considerable amount of evidence suggesting the presence of motor control faults in NS-CLBP patients, the nature of these faulty patterns in re- sponse to pain provocation are highly inconsistent [11-14].
For instance, several research studies reported no differences in trunk muscle activations in this population [11,13,14]. In contrast, one study reported a decrease in muscle activations in patients with NS-CLBP [15] while others reported an in- crease in muscle activities [10,16]. These inconsistent find- ings were commonly attributed to the ‘washout effect’ when interpreting electromyography (EMG) data of heterogeneous CLBP patients [12]. In order to minimize the ‘washout ef- fect’, a Multidimensional Classification system (MDCS) by O’Sullivan emerged [9], in which a large number of NS- CLBP patients were subclassified based on the underlying mechanical basis of their pain disorder [11,12,17-19].
A study that used the MDCS, found that the levels of ac- tivity of lumbar muscles were higher in extension-related NS-CLBP, namely active extension pattern (AEP) subgroup, when compared to healthy subjects and flexion-related back pain, called flexion pattern (FP) subgroup, during 5-second sitting [12]. The increase in back muscle activity is thought to predispose those patients to pain [9,12]. Contrary to that, muscular patterns of NS-CLBP patients with motor control impairment (MCI) were found highly variable in other re- search studies used the MDCS [11,13,14]. Most of these studies examined the neuromuscular functions of the trunk muscles using activation amplitudes as an indicator for the motor response [11-14]. Although, the studies cited above might have examined muscle activation among homoge- nous NS-CLBP patients, inconsistent muscle activations were reported. Therefore, studies examining neuromuscular control using a more objective approach might be deemed necessary. Schinkel-Ivy et al. [16] reported that during pro- longed sitting of 2 hours, LBP developers displayed higher levels of co-contraction of trunk muscles than non-pain developers. This co-contraction tended to increase over time and was directly associated with pain development. The au- thors suggested that this type of analysis allows a better un- derstanding of the activation pattern of one abdominal and another back muscle at the time of a specific activation, which allows to thoroughly understand the relationships be-
tween these two paired muscles during known tasks [16,20].
Thus, studies examining trunk muscle co-contraction might provide an insightful conclusion about the neuromuscular patterns adopted by each NS-CLBP subgroup in response to pain that develops over time.
So far, research data showed inconsistent differences in trunk muscle amplitudes among NS-CLBP. These variable conclusions have created confusion among clinicians, and thus studies considering the potential causes that drive varia- bility in muscle activity of NS-CLBP patients might be ne- cessary. As discussed above, the heterogeneity of NS-CLBP, and merely examining muscle amplitudes without consid- eration for the relationship between trunk muscle activation (co-activation analysis) might be other reasons for the ob- served inconsistency. This is the first study that examined muscle activity using muscle co-contraction indices as a more objective approach to identify neuromuscular patterns among homogenous MCI subgroups. Identifying distinctive co-contraction patterns will allow a thorough understanding of the relationship between abdominal and back muscles, and most importantly, their influences in pain development over time across these subgroups. This would eventually en- able clinicians to provide customized, subgroup-specific in- terventions based on the underlying MCIs. Furthermore, pa- tients with MCI, FP and AEP subgroups, demonstrate pain provocation during the exposure to static loading such that occurring during prolonged sitting [9]. Because prolonged sitting is frequently reported to aggravate pain in NS-CLBP population [16,17], research examining the sitting nature is becoming increasingly relevant. Therefore, the purpose of this study was to a) examine differences in trunk muscles ac- tivation (amplitudes and co-contraction indices) among FP, AEP subgroups and healthy controls when pain is at its low- est and at its highest, b) examine changes in muscles activa- tion and pain by study group over time (1-hour sitting task).
It was hypothesized that subjects with FP and AEP disorders would display higher co-activation patterns as the pain is at its lowest level when compared to healthy controls, and that these patterns would increase toward the end of sitting peri- od as the pain is at its highest level.
Methods Participants
A total of 30 subjects; 20 NS-CLBP with MCI and 10 healthy were recruited from private outpatient Physical Ther- apy clinics. Ethical approval was obtained from the Institu-
Table 1. Inclusion and exclusion criteria
Inclusion criteria Exclusion criteria
• ≥3 months NSCLBP
• ≥5 points scored on RMDQ score
• Pain in the lower lumbosacral region
• Absence of ‘red flags’ (such as inflammatory diseases or causa equina)
• Absence of dominant ‘yellow flags’ (such as identification of beliefs, emotions, and behaviors that interact with the pain problem)
• Clear mechanical basis of disorder
• Associated impairments in the control of the motion segment (s) in the provocative movement direction (s)
• Absence of impaired movement of the symptomatic segment in the pain- ful direction of movement (based on clinical joint mobility examination)
• Diagnosis of an FP or AEP disorder (both examining clinicians in- dependently agreed upon the diagnosis)
• <5 points scored on RMDQ score
• Signs of neurologic involvement, e.g., radicular pain, and more generalized pain
• Evidence of specific diagnosis, e.g., spondylolisthesis, inflammatory disease,
• Previous spine surgery
• Pregnant at the time of the study or 6 months postpartum
NSCLBP: non-specific chronic low back pain, RMDQ: Ronald Morris Disability Questionnaire, FP: flexion pattern, AEP: active extension pattern.
tional Review Board at Loma Linda University (IRB No.
#5180306). All subjects read and signed a written informed consent prior to participation in the study. To establish MCI sub-classifications, two clinicians independently completed a comprehensive subjective assessment and physical exami- nation [17]. Based on the examination, only those with FP or AEP disorder, in accordance to criteria described elsewhere [9,21], were included in the study. Because of the high prev- alence of these two disorders, subjects with either FP or AEP were chosen [9,21]. Previous research has shown a substan- tial agreement between clinicians upon the classification of NS-CLBP with MCI supporting its intra-rater reliability [22]. Inclusion and exclusion criteria are summarized in Table 1.
Gender, age, anthropometric data [mass, height, and body mass index (BMI)], perceived pain using the Numeric Pain Rating Scale (NPRS) [16,23,24], pain duration, pain-related disability using Ronald Morris Disability Questionnaire (RMDQ), and fear avoidance using Tampa Scale of kinesi- ophobia (TSK) [25] were collected at baseline. Data collec- tion was conducted at the Orthopedic and Movement Science Laboratory, Department of Physical Therapy, Loma Linda University, CA, USA.
Instrumentation Electromyography
An 8-channel MyoMuscle 1200 EMG system (Noraxon USA, Inc., Scottsdale, AZ, USA) with an input impedance of greater than 100 mΩ, a gain of 500, and a common-mode rejection ratio of greater than 100 dB was used to record muscle activity during a 1-hour siting protocol. EMG sig-
nals were acquired at a sampling rate of 1,000 Hz. In accord- ance with previous literature, EMG activity of the local lum- bosacral stabilizers (EO, IO, LM [12], and LES [16]) was recorded.
Perceived pain
While it is challenging to measure pain [24], perceived pain scores were gathered using the open NPRS during the 1-hour sitting protocol. The NPRS consists of a 100 mm hor- izontal line, anchored by the descriptors ‘no pain’ and ‘worst pain imaginable’ [23].
Procedures
Placement of electromyography electrode
Prior to electrode placement, subjects’ skin was shaved, abraded, and cleaned with isopropyl alcohol wipes. Disposal surface electrodes (dual, 2 mm diameter, 2 cm apart, Noraxon USA, Inc.) were placed parallel to the muscle fibers in ac- cordance with the SENIAM research group recommenda- tions and previous research [12,26,27]. The external oblique (EO) electrode was placed below the rib cage and along a line connecting the opposite pubic tubercle and the most in- ferior point of the costal margin [28]. The transfer fibers of internal oblique (IO) electrode was placed 1 cm medial to the anterior superior iliac spine (ASIS) and beneath a line connecting both ASISs [16,28]. The lumbar erector spinals (LES) electrode was placed 4 cm lateral to the spinous proc- ess of L3 [27]. The superficial lumbar multifidus (LM) elec- trode was placed at the level of L5 along a line joining poste- rior superior iliac spine and L1-L2 interspinous space [16].
The same clinician placed all electrodes to ensure consist-
ency. EMG sensors were positioned using a double-sided tape and further secured to the skin with an adhesive tape to minimize movement artifacts during the testing. Lastly, the electrode placement was visually confirmed by viewing EMG signals during a manual muscle test to minimize cross- talk effect.
Sub-Maximal voluntary contraction evaluation For the EO and IO testing, subjects were positioned in crook lying with both hips flexed to 45° and the knees flexed to 90° [29]. To record sub-maximal voluntary contraction (sMVC), subjects were then asked to raise both legs 1 cm off the supporting table for 3 seconds. For the LES and LM test- ing, subjects were positioned in the prone lying position with both knees flexed to 90°. To record sMVC, subjects were asked to lift both thighs 5 cm off the table for 3 seconds [29].
Subjects were instructed to avoid quick contraction and to gradually build up their effort to their maximum once they hear the word ‘Go!’. Prior to the measurement trials, sub- jects completed 1 practice sMVC trial to ensure adequate performance. Three 3-second measurement trials were per- formed for each muscle with a 3-minute rest period in be- tween each trial to minimize fatigue or aggravation of back pain. All subjects received a standard verbal encouragement during each trial. An additional trial was taken if an arbitrary value of more than 10% of variation between the three trials was noticed to avoid large variability. The same clinician com- pleted all measurements to ensure consistency, and the order of muscle testing was randomized to minimize bias. An ex- cellent within-day and between-day reliability of these nor- malization procedures have been previously reported [29].
Pain measurement
Perceived pain was collected immediately prior to the be- ginning of the sitting protocol, and every 10 minutes through- out the 1-hour period. This way, we obtained a total of seven readings for each subject. All subjects were asked to rate their pain by making a vertical line in the open NPRS at the point corresponding to their level of pain/discomfort. To avoid artificial increase in the NPRS scores, all subjects were asked to focus on pain intensity rather than the loca- tions of their pain [16,24]. Additionally, subjects were al- lowed to compare their current NPRS score with the preced- ing scores to minimize unintended rating variations while drawing lines corresponding to their pain [24].
A 1-hour sitting protocol
Following sMVC evaluation, all subjects underwent a 1-hour sitting protocol in which they sat on an office chair reading pre-selected passages. Prior to sitting, the chair was modified by removing the backrests and armrests so that they did not interfere with data collection [16]. Although, this might alter the sitting behavior of the subjects, research found no difference in the trunk muscle activity when sitting in an office chair with backrest or on a stability ball without backrest [30]. Therefore, this modification is deemed to be appropriate. In addition, the height of the chair was adjusted so that the subjects sat with hips and knees approximately at 90° of flexion [16] and feet rested on the floor [31]. Subjects were then provided with a standard office workstation setup, including a monitor, with the top of the screen at eye level, a keyboard and a mouse [16]. Subjects were instructed to follow the text on the monitor screen with the mouse cursor using the right hand and pressing the ‘Shift’ key on the key- board to move to the next paragraph using the left hand [16,32]. The subjects’ elbows were kept at 90°-100° of flex- ion while reading, thus the height of the keyboard and mouse was adjusted to maintain this elbow angle [31]. The distance from the keyboard was standardized for all subjects, in which the edge of the keyboard was in line with the radial styloid process and a distance of approximately 30 cm to subjects’
greater trochanter [31]. Thus, the potential for confounding variables affecting the study findings were minimized. Finally, just prior to launching the 1-hour sitting protocol, all sub- jects were instructed to ‘sit as they normally would’ on their office chairs.
Over the 1-hour sitting protocol, the amplitude value for each muscle activity [16,24] was recorded. Additionally, pain levels [16,24] were recorded at baseline and every 10 mi- nutes throughout the sitting protocol.
Data processing
Electromyography activation amplitudes
Before processing raw EMG data, visual inspection was utilized to eliminate potential artifacts. Then all data was processed on the Noraxon EMG system in which, the signals were high-pass filtered using a dual-pass Butterworth filter with a cutoff frequency of 30 Hz, in order to remove con- tamination by heart rate and other artifacts [33]. Signals were then full-wave rectified, low-pass filtered using a du- al-pass Butterworth filter with a cutoff frequency of 2.5 Hz [12,16,34]. To establish the level of muscle activity, the highest peak value out of the three trials for each muscle
from the sMVC evaluation was automatically selected as sMVC and used for normalization. During normalization, the average amplitude values of each muscle at every 10-minute interval and over the entire 1-hour sitting period were normalized to the sMVC, expressed as a percentage (%), and used for the analysis.
Reliability of the measurements
The interclass correlation coefficient was used to assess the reliability of measurement [10,12]. The intertrial reli- ability of the obtained EMG data was excellent. The inter- class correlation coefficient values ranged from 0.85 to 0.98.
Electromyograph co-contraction index
A co-contraction index was used to measure the level of activations and timings of the activations of two trunk mus- cles (abdominal_back pairing) [12]. The processed EMG da- ta, as described above, was then used to calculate the co-con- traction indices (CCIs) at every 10-minute interval and over the entire 1-hour sitting period. Since CCI reflects the acti- vation level of two paired muscles, muscle pairings were needed. To establish muscle pairings, each abdominal mus- cle was paired with every back muscle resulting in 16 possi- ble pairings per subject at each time period. The muscle pairs reflect abdominal-back co-activations [16], and are as fol- lows (REO_RLES, REO_LLES, REO_RLMS, REO_
LLMS, LEO_RLES, LEO_LLES, LEO_RLMS, LEO_LLMS, RIO_RLES, RIO_LLES, RIO_RLMS, RIO_LLMS, LIO_
RLES, LIO_LLES, LIO_RLMS, LIO_LLMS). The CCI values of each pairing were calculated using the equation (1) revealing a total of 128 values (8 CCI’s values per pairing).
Microsoft Excel (Version 16.25; Microsoft, Redmond, WA, USA) was used to perform the calculation.
CCI=∑ni−1
×[EMGlow(i)+EMGhigh(i)] (1)Numeric Pain Rating Scale
Post-collection, the perceived pain (a total of 7 readings) was used for analysis. For the pain subgroups, the highest NPRS score was used to determine which data to be used for the primary analysis for each subject. For example, if a sub- ject reported the highest pain level at the third 10-minute in- terval, then only CCIs of the trunk muscles at the beginning of the sitting period (baseline) and the third 10-minute inter- val were used for comparison within the same group and among study groups. This way, we were able to compare the trunk muscle activation of each subject when the pain was at
its lowest and highest pain levels.
Statistical analysis
Data was summarized using mean and standard deviation (SD) for quantitative variables and counts (%) for qual- itative variables. The normality of continuous variables was examined using Shapiro Wilk’s test and Q-Q normality plots.
The distribution of the subjects’ characteristics by study group were evaluated using chi-square test for gender, one- way ANOVA for age, height, mass and BMI, paired t-test for muscle amplitudes between sides (right vs. left), independent t-test for duration of pain, and Kruskal Wallis ANOVA for NPRS (during past 24 hours, past week, and baseline), TSK and RMDI scores.
The primary analysis included a comparison of trunk muscles’ amplitudes and CCIs of each pair across groups at the lowest (baseline) and highest level of pain (minute 60) using one-way ANOVA (with post-hoc Bonferroni). The secondary analysis included a comparison of muscles’ am- plitudes and CCIs of each pair across groups over the entire 1-hour sitting using one-way ANOVA (with post-hoc Bon- ferroni). A third analysis included a 3x7 mixed factorial ANOVA (between factor: group; within factor: time) to ex- amine changes in trunk muscle amplitudes and CCIs of each pair, and NPRS by study group over time. If the group x time interaction effect in the mixed factorial ANOVA was statisti- cally significant, changes from the baseline were compared among groups at each time period (total of six ‘10-minute in- tervals’) using one-way ANOVA (with post-hoc Bonferroni).
If the interaction was not statistically significant, the be- tween-groups comparison was considered not statistically significant. However, if the main effect of time was signi- ficant in the mixed factorial ANOVA, a one-way repeated measures ANOVA (with post-hoc Bonferroni) was used to examine changes over time within-groups separately. The level of significance was set at p≤0.05. Statistical analysis was performed using IBM SPSS Statistics for Windows, Version 25.0 (IBM Co., Armonk, NY, USA).
Sample size estimate
For the primary and secondary analyses, a sample size of 30 subjects was estimated using a large effect size [eta squared (η2)=0.26], level of significance (α=0.05), and power of 0.80 [35]. For the third analysis, a sample size of 30 subjects was estimated using a moderate effect size for the group x time interaction (partial η2=0.06), level of signi- ficance (α=0.05), and power of 0.90.
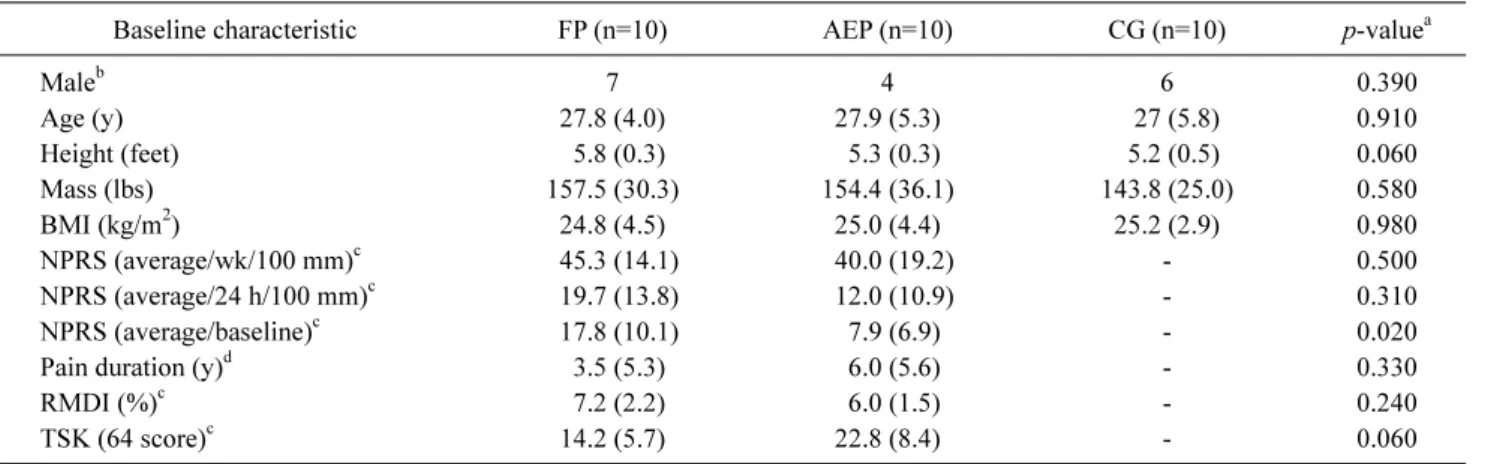
Table 2. Baseline characteristics by study group (N=30)
Baseline characteristic FP (n=10) AEP (n=10) CG (n=10) p-valuea
Maleb 7 4 6 0.390
Age (y) 27.8 (4.0) 27.9 (5.3) 27 (5.8) 0.910
Height (feet) 5.8 (0.3) 5.3 (0.3) 5.2 (0.5) 0.060
Mass (lbs) 157.5 (30.3) 154.4 (36.1) 143.8 (25.0) 0.580
BMI (kg/m2) 24.8 (4.5) 25.0 (4.4) 25.2 (2.9) 0.980
NPRS (average/wk/100 mm)c 45.3 (14.1) 40.0 (19.2) - 0.500
NPRS (average/24 h/100 mm)c 19.7 (13.8) 12.0 (10.9) - 0.310
NPRS (average/baseline)c 17.8 (10.1) 7.9 (6.9) - 0.020
Pain duration (y)d 3.5 (5.3) 6.0 (5.6) - 0.330
RMDI (%)c 7.2 (2.2) 6.0 (1.5) - 0.240
TSK (64 score)c 14.2 (5.7) 22.8 (8.4) - 0.060
Values are presented as number only or mean (SD).
FP: flexion pattern, AEP: active extension pattern, CG: control group, BMI: body mass index, NPRS: Numeric Pain Rating Scale, RMDI:
ronald morris disability index, TSK: Tampa Scale of kinesiophobia, -: not available.
aOne-way ANOVA; bChi-square test; cKruskal Wallis ANOVA; dIndependent t-test.
Results
A sample of 30 subjects with mean age 27.6±4.9 years, mass 151.9±30.3 lbs., height 5.4±0.4 feet, BMI 25.0±3.9 kg/m2 participated in this study. Fifty-seven percent of the subjects were males (n=17). The distribution of all quantita- tive variables was approximately normal. There was no sig- nificant difference in the subjects’ characteristics by study group (p>0.05). Subjects’ characteristics are summarized in Table 2. Additionally, paired t-test revealed no differences between right and left side muscle amplitudes; thus, the muscle amplitude results were reported from one randomly selected side (right).
Primary analysis
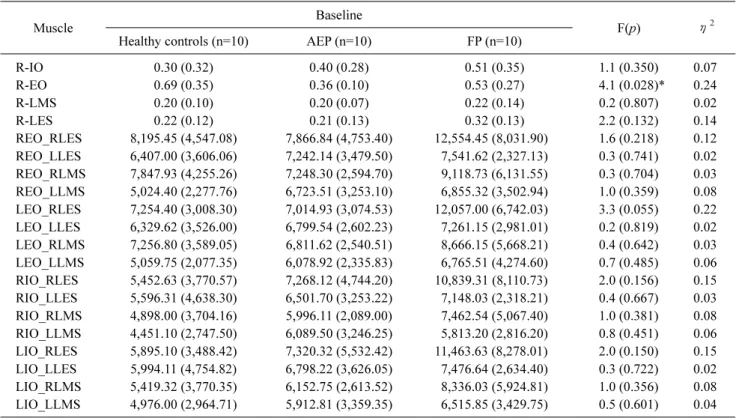
The differences in muscle activation amplitudes among study groups at the beginning and the end of 1-hour sitting are displayed in Tables 3, 4, respectively. There was a sig- nificant difference in mean R-EO amplitude among the three study groups at the lowest level of pain, which was at begin- ning of the sitting period (F2,27=4.1, p=0.028, η2=0.24).
Bonferroni post hoc comparisons showed that the difference in mean R-EO was only significant between the AEP sub- group and healthy controls (p=0.026, 95% confidence inter- val [CI]=0.03-0.62, Cohen’s d=1.27). The AEP subgroup had lower mean R-EO amplitude compared to healthy con- trols at the beginning of sitting period (R-EO: 0.36±0.10 vs.
0.69±0.35). However, there was no significant difference in mean R-EO amplitude between FP vs. healthy controls (p=
0.231, 95% CI=0.08-0.50, Cohen’s d=0.74), and between
FP vs. AEP subgroup (p=0.981, 95% CI=0.18-0.41, Cohen’s d=0.40)
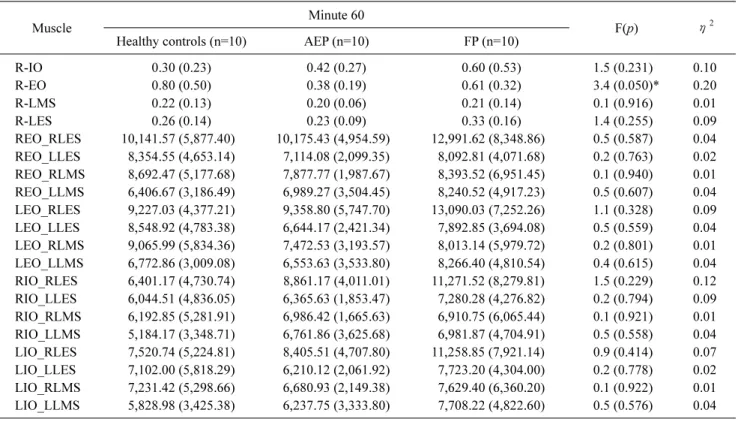
Also, a significant difference was only noted in mean R-EO amplitude among the three study groups at the highest level of pain, which was at minute 60 of the sitting period (F2.27=3.4, p=0.050, η2=0.20). Bonferroni post hoc com- parisons revealed that the difference in mean R-EO ampli- tude was only significant between AEP subgroup and healthy controls (p=0.046, 95% CI=0.01-0.81, Cohen’s d=1.07).
Specifically, AEP had lower amplitude compared to healthy control (0.38±0.19 vs. 0.80±0.50). However, there was no significant difference in mean R-EO amplitude between FP vs. healthy controls (p=0.791, 95% CI=0.22-0.58, Cohen’s d=0.47), and between FP vs. AEP subgroup (p=0.478, 95%
CI=0.17-0.63, Cohen’s d=0.60),
No significant differences in mean amplitudes were found for all the other muscle groups at baseline or at minute 60 (p>0.05). Similarly, no significant differences were noted for all CCIs for all muscle pairings at baseline or at minute 60 (p>0.05) (Tables 3, 4).
Secondary analysis
The differences in muscle amplitudes among all study groups over the entire 1-hour sitting are shown in Figure 1A.
There was a significant difference in mean R-EO amplitude among the three study groups over the entire 1-hour sitting (F2,27=3.7, p=0.037, η2=0.22). Bonferroni post hoc com- parisons revealed that the difference in mean R-EO was sig- nificant between the AEP subgroup and healthy controls (p=0.033, 95% CI=0.17-5.15, Cohen’s d=1.12). The AEP
Table 3. Trunk muscle amplitudes and cocontraction indices (expressed as %sub-MVC) at baseline per group (N=30)
Muscle Baseline
F(p) η2
Healthy controls (n=10) AEP (n=10) FP (n=10)
R-IO 0.30 (0.32) 0.40 (0.28) 0.51 (0.35) 1.1 (0.350) 0.07
R-EO 0.69 (0.35) 0.36 (0.10) 0.53 (0.27) 4.1 (0.028)* 0.24
R-LMS 0.20 (0.10) 0.20 (0.07) 0.22 (0.14) 0.2 (0.807) 0.02
R-LES 0.22 (0.12) 0.21 (0.13) 0.32 (0.13) 2.2 (0.132) 0.14
REO_RLES 8,195.45 (4,547.08) 7,866.84 (4,753.40) 12,554.45 (8,031.90) 1.6 (0.218) 0.12 REO_LLES 6,407.00 (3,606.06) 7,242.14 (3,479.50) 7,541.62 (2,327.13) 0.3 (0.741) 0.02 REO_RLMS 7,847.93 (4,255.26) 7,248.30 (2,594.70) 9,118.73 (6,131.55) 0.3 (0.704) 0.03 REO_LLMS 5,024.40 (2,277.76) 6,723.51 (3,253.10) 6,855.32 (3,502.94) 1.0 (0.359) 0.08 LEO_RLES 7,254.40 (3,008.30) 7,014.93 (3,074.53) 12,057.00 (6,742.03) 3.3 (0.055) 0.22 LEO_LLES 6,329.62 (3,526.00) 6,799.54 (2,602.23) 7,261.15 (2,981.01) 0.2 (0.819) 0.02 LEO_RLMS 7,256.80 (3,589.05) 6,811.62 (2,540.51) 8,666.15 (5,668.21) 0.4 (0.642) 0.03 LEO_LLMS 5,059.75 (2,077.35) 6,078.92 (2,335.83) 6,765.51 (4,274.60) 0.7 (0.485) 0.06 RIO_RLES 5,452.63 (3,770.57) 7,268.12 (4,744.20) 10,839.31 (8,110.73) 2.0 (0.156) 0.15 RIO_LLES 5,596.31 (4,638.30) 6,501.70 (3,253.22) 7,148.03 (2,318.21) 0.4 (0.667) 0.03 RIO_RLMS 4,898.00 (3,704.16) 5,996.11 (2,089.00) 7,462.54 (5,067.40) 1.0 (0.381) 0.08 RIO_LLMS 4,451.10 (2,747.50) 6,089.50 (3,246.25) 5,813.20 (2,816.20) 0.8 (0.451) 0.06 LIO_RLES 5,895.10 (3,488.42) 7,320.32 (5,532.42) 11,463.63 (8,278.01) 2.0 (0.150) 0.15 LIO_LLES 5,994.11 (4,754.82) 6,798.22 (3,626.05) 7,476.64 (2,634.40) 0.3 (0.722) 0.02 LIO_RLMS 5,419.32 (3,770.35) 6,152.75 (2,613.52) 8,336.03 (5,924.81) 1.0 (0.356) 0.08 LIO_LLMS 4,976.00 (2,964.71) 5,912.81 (3,359.35) 6,515.85 (3,429.75) 0.5 (0.601) 0.04 Values are presented as mean (SD).
MVC: maximal voluntary contraction, AEP: active extension pattern, FP: flexion pattern, η2: partial eta squared, R: right side, IO: internal oblique, EO: external oblique, LMS: lumbar multifidus, LES: lumbar erector spinals, L: left side.
*Significant difference between AEP vs. control group, p=0.026 in One-way ANOVA.
subgroup had lower mean R-EO amplitude compared to healthy controls over the entire sitting period (0.39±0.17 vs.
0.77±0.42). However, there was no significant difference in mean R-EO amplitude between FP vs. healthy controls (p=
0.52, 95% CI=1.13-3.84, Cohen’s d=0.57), and FP vs. AEP subgroup (p=0.58, 95% CI=1.18-3.79, Cohen’s d=0.54).
No significant differences in mean amplitudes were found for the other muscle groups over the entire sitting period (R-IO: F2,27=1.0, p=0.375, η2=0.07; R-LMS: F2,27=0.3, p=
0.701, η2=0.026; R-LES: F2,27=1.1, p=0.336, η2=0.078).
Similarly, no significant differences were noted for all mus- cle pairings (CCIs) over the entire 1-hour sitting period (REO_RLES: F2,27=1.1, p=0.327, η2=0.09; REO_LLES:
F2,27=1.1, p=0.833, η2=0.01; REO_RLMS: F2,27=0.3, p=
0.691, η2=0.03; REO_LLMS: F2,27=1.4, p=0.255, η2=0.11;
LEO_RLES: F2,27=2.2, p=0.127, η2=0.17; LEO_LLES: F2,27= 0.2, p=0.752, η2=0.026; LEO_RLMS: F2,27=0.2, p=0.764, η2=0.02; LEO_LLMS: F2,27=0.9, p=0.401, η2=0.08; RIO_
RLES: F2,27=2.0, p=0.157, η2=0.14; RIO_LLES: F2,27=0.3, p=0.716, η2=0.02; RIO_RLMS: F2,27=0.4, p=0.667, η2=0.03;
RIO_LLMS: F2,27=0.82, p=0.449, η2=0.06; LIO_RLES:
F2,27=1.9, p=0.168, η2=0.14; LIO_LLES: F2,27=0.4, p=0.663, η2=0.03; LIO_RLMS: F2,27=0.6, p=0.525, η2=0.05; LIO_
LLMS: F2,27=0.9, p=0.410, η2=0.41) (Figure 1B).
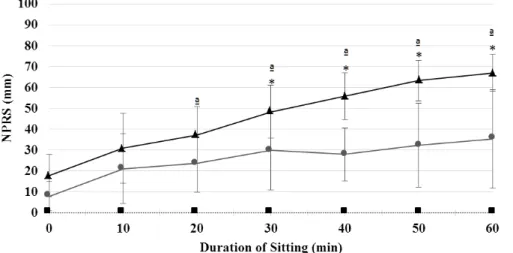
Third analysis
Figure 2 shows the average pain scores of all groups over the 1-hour sitting. Results from the mixed factorial analysis showed a significant group by time interaction effect for pain (p<0.001, η2=0.47). Results of the one-way ANOVA indicated that the difference in the amount of change from baseline was significant among the three groups at all time periods (p<0.001). Specifically, Bonferroni post hoc com- parisons revealed that both pain subgroups significantly dif- fered from healthy controls at all time periods (p<0.05).
However, during the first 30 minutes of sitting, pain sub- groups did not differ from each other, whereby, during the last 30 minutes, mean pain levels were significantly differ- ent between FP and AEP subgroups (p<0.01). Namely, the FP subgroup reported a significant increase in pain scores compared to the AEP subgroup at minute 40 (38.1±15.0 vs.
20.0±9.5, p=0.002), minute 50 (45.5±18.3 vs. 24.5±16.1, p=
Table 4. Trunk muscle amplitudes and cocontraction indices (expressed as %sub-MVC) at minute 60 per group (N=30)
Muscle Minute 60
F(p) η2
Healthy controls (n=10) AEP (n=10) FP (n=10)
R-IO 0.30 (0.23) 0.42 (0.27) 0.60 (0.53) 1.5 (0.231) 0.10
R-EO 0.80 (0.50) 0.38 (0.19) 0.61 (0.32) 3.4 (0.050)* 0.20
R-LMS 0.22 (0.13) 0.20 (0.06) 0.21 (0.14) 0.1 (0.916) 0.01
R-LES 0.26 (0.14) 0.23 (0.09) 0.33 (0.16) 1.4 (0.255) 0.09
REO_RLES 10,141.57 (5,877.40) 10,175.43 (4,954.59) 12,991.62 (8,348.86) 0.5 (0.587) 0.04 REO_LLES 8,354.55 (4,653.14) 7,114.08 (2,099.35) 8,092.81 (4,071.68) 0.2 (0.763) 0.02 REO_RLMS 8,692.47 (5,177.68) 7,877.77 (1,987.67) 8,393.52 (6,951.45) 0.1 (0.940) 0.01 REO_LLMS 6,406.67 (3,186.49) 6,989.27 (3,504.45) 8,240.52 (4,917.23) 0.5 (0.607) 0.04 LEO_RLES 9,227.03 (4,377.21) 9,358.80 (5,747.70) 13,090.03 (7,252.26) 1.1 (0.328) 0.09 LEO_LLES 8,548.92 (4,783.38) 6,644.17 (2,421.34) 7,892.85 (3,694.08) 0.5 (0.559) 0.04 LEO_RLMS 9,065.99 (5,834.36) 7,472.53 (3,193.57) 8,013.14 (5,979.72) 0.2 (0.801) 0.01 LEO_LLMS 6,772.86 (3,009.08) 6,553.63 (3,533.80) 8,266.40 (4,810.54) 0.4 (0.615) 0.04 RIO_RLES 6,401.17 (4,730.74) 8,861.17 (4,011.01) 11,271.52 (8,279.81) 1.5 (0.229) 0.12 RIO_LLES 6,044.51 (4,836.05) 6,365.63 (1,853.47) 7,280.28 (4,276.82) 0.2 (0.794) 0.09 RIO_RLMS 6,192.85 (5,281.91) 6,986.42 (1,665.63) 6,910.75 (6,065.44) 0.1 (0.921) 0.01 RIO_LLMS 5,184.17 (3,348.71) 6,761.86 (3,625.68) 6,981.87 (4,704.91) 0.5 (0.558) 0.04 LIO_RLES 7,520.74 (5,224.81) 8,405.51 (4,707.80) 11,258.85 (7,921.14) 0.9 (0.414) 0.07 LIO_LLES 7,102.00 (5,818.29) 6,210.12 (2,061.92) 7,723.20 (4,304.00) 0.2 (0.778) 0.02 LIO_RLMS 7,231.42 (5,298.66) 6,680.93 (2,149.38) 7,629.40 (6,360.20) 0.1 (0.922) 0.01 LIO_LLMS 5,828.98 (3,425.38) 6,237.75 (3,333.80) 7,708.22 (4,822.60) 0.5 (0.576) 0.04 Values are presented as mean (SD).
MVC: maximal voluntary contraction, AEP: active extension pattern, FP: flexion pattern, η2: partial eta squared, R: right side, IO: internal oblique, EO: external oblique, LMS: lumbar multifidus, LES: lumbar erector spinals, L: left side.
*Significant difference between AEP vs. control group, p=0.026 in One-way ANOVA.
0.007), and minute 60 (49.2±16.8 vs. 27.4±19.7, p=0.009).
Similar results were found when adding pain at baseline as a covariate. The level of pain reported by the subgroups in- creased significantly over time (p<0.001, η2=0.80 for FP and η2=0.44 for AEP), whereby the pain peaked towards the end of the sitting period and increased significantly from baseline after 20 minutes of the sitting period (FP, p<0.01 and AEP, p<0.05).
There was no significant group by time interaction effect or over time change for all muscles’ activity (amplitudes or CCIs) (p>0.05).
Discussion
The present study is the first study that examined muscle activity using muscle co-contraction indices as a more ob- jective approach to identify neuromuscular patterns, and their role on pain provocation over 1-hour of prolonged sit- ting period among homogenous MCI subgroups. Contrary to the hypothesis of this study, the results showed that all study groups presented with no significantly distinctive
trunk muscles’ activities, mainly CCIs, at the beginning of sitting nor did they change over time when pain increased to a significant level. Both MCI subgroups reported a similarly significant increase in pain through mid-sitting. However, after mid-sitting, both subgroups significantly differed from each other in pain but not in the levels of muscle activation.
This study’s findings suggest no causative and/or adaptive mechanisms for trunk muscles’ activity on back pain devel- opment over time.
Muscles’ activities (amplitudes and co-contraction indices) In the present study, all groups did not significantly differ from one another in trunk muscles’ activities at any point of time across the 1-hour sitting period. The muscle activities were similar among MCI subgroups at baseline, when pain was at its lowest level, and did not change even after pain provocation by means of prolonged sitting. This is in line with previous research studies in which trunk muscle activ- ities were similar among pooled NS-CLBP subjects com- pared to healthy controls [12,15].
In the current study, there are several possible explan-
(A)
(B)
Figure 1. Mean (SD) of trunk muscles (A) amplitudes, and (B) cocontraction indices (expressed as %sub-MVC) over the 1-hour sitting period by study group (N=30). AEP: active extension pattern, FP: flexion pattern, R: right side, IO:
internal oblique, EO: external oblique, LMS: lumbar multifidus, LES: lumbar erector spinals, L: left side. *Signifi- cant difference between groups (p≤
0.05).
ations as to why muscle activities were not different, nor did they change over time. First, the degrees of hip flexion play a significant role in trunk muscle activity, in fact, lower mus- cle activities were noted at lesser degrees of hip flexion for NS-CLBP and healthy controls [13,15]. Although all sub- jects sat on the same standard office chair, with their hip an- gle relatively at 90 degrees, the lack of precise kinematic da- ta regarding hip flexion might have led to the lack of sig- nificant differences in muscle activities among the study groups. Second, the subjects in the current study exhibited low levels of functional disability (mean RMDI for both MCI subgroups of 6.6±1.7) compared to previous studies.
MCI subgroups with elevated functional disability are re- ported to have faulty neuromuscular patterns during sitting when compared to healthy individuals and those with more disabling NS-CLBP [13,31]. Therefore, this may explain why trunk muscle activities of MCI subgroups were not dif- ferent from each other or their controls. Third, the trunk muscle activities and pain were only recorded for 1-hour of
sitting with limited data on whether such period of time would result in meaningful differences between subjects with and without NS-CLBP. Thus, the lack of differences in muscle activities might occur if the subject sat for prolonged sitting periods. Finally, previous research reported that the FP subgroup presented with increased abdominal muscle ac- tivities [12,14], whereas the AEP subgroup showed in- creased back muscle activities [11-14]. Although, these studies might have supported the ‘muscle spasm model’
among MCI subgroups based only on the differences in trunk muscle amplitude, the current study was not able to support this notion. Few research studies have examined the differences on trunk muscle activities, using the co-con- traction indices, as an indicator of the motor control response. The current study used the CCIs to quantify the de- gree of spatial and temporal EMG data for a pair of muscle groups over a specific number of time points during the 1-hour sitting period as a more objective measurement of the neuromuscular patterns among study’s groups [16,20].
Figure 2. Mean (SD) NPRS scores over the 1-hour sitting per group (N=30).
AEP: active extension pattern, FP: flex- ion pattern, NPRS: Numeric Pain Rat- ing Scale. *Significant difference be- tween pain subgroups; aSignificant dif- ference from baseline NPRS (p<0.05).
Similar to the muscle amplitude findings, the results of the present study denounced the validity of the ‘muscle spasm model’ among MCI subgroups when the model is based on co-contraction indices.
Over time pain increase
In the present study, both MCI subgroups reported a sim- ilarly significant increase in pain through mid-sitting. How- ever, after mid-sitting, both subgroups significantly differed from each other. Although the present study did not directly aim to examine the relationship between pain development and trunk muscle indices, the findings of this study revealed none or a very limited role for muscle CCIs in pain provoca- tion over time. In other words, the reported increase in back pain did not trigger neuromuscular alterations of the trunk muscles. Contrary to Schinkel-Ivy et al. [16] study, the au- thor reported that during 2 hours of sitting, LBP developers displayed higher levels of co-contraction of trunk muscles than non-pain developers. This co-contraction tended to in- crease over time and was directly associated with pain de- velopment. The authors suggested that such a relationship could indicate a causative mechanism to pain development or an adaptive motor response in attempt to decrease the pain [16]. Although the author reported a relationship in pain and CCIs between asymptomatic LBP and healthy, this finding was not supported by the present study. The present study examined NS-CLBP patients, using the MCI subclassifi- cation system, which might have washed out the differences [12,36] in muscle activities, and thus resulted in the prom- inence of similarities among the study’s groups. This may
introduce the notion that when NS-CLBP subgroups are classified based only on the differences on muscle activities whether muscle amplitudes or co-contractions, the subgroup- ing model might not be reliable. Therefore, examining other factors that might contribute to the driving mechanisms of back-pain disorder such as lumbosacral kinematics might assist in further validation of NS-CLBP subgrouping models.
Study limitations
As highlighted, the levels of hip flexion were not meas- ured in the present study, which might have omitted their in- fluence in muscle activities. In addition, the sitting period was only monitored for an hour, which might not have pro- vided a thorough understanding of how MCI subgroups op- erate during their daily office tasks that may extend beyond an hour. However, due to a) the likelihood of experiencing LBP by these subgroups over a single hour, and b) the logis- tic of the testing which was used to limit the sitting period to an hour to avoid unacceptable pain aggravation. Further- more, the association between pain levels and muscle activ- ities were not analyzed, thus we recommend that a correla- tion analysis be performed in order to examine this relation- ship. Also, sitting posture might not be challenging enough for the AEP subgroup to provoke pain due to its flexed na- ture [11,17,31], however, in the present study the AEP sub- group reported an increase in pain level over the 1-hour sitting. This can be attributed to the static loading at the lum- bosacral spine associated with the prolonged sitting period making it a provocative task to aggravate pain in both stud- ied MCI subgroups. Because the FP and AEP disorders are
motor control deficits, future studies are warranted to mon- itor regional and segmental spine postures in conjunction with muscle activities over time.
Another limitation in this study was the small sample size included. A total of only 30 were enrolled in this study. A pri- ori power analysis revealed that the power based on this sample was 0.80 with large effect size (η2=0.26). However, the effect sizes reported in this study were less than 0.26. It is possible that we were not able to identify significant dif- ferences in muscle activities between the study groups due to the small sample size with the estimated large effect size.
Thus, we recommend conducting further studies with a larg- er sample size to enhance the generalizability of the study’s findings. Lastly, caution should be taken when interpreting the study’s findings, since it is known that low functional disabilities among MCI subgroups had an effect on muscle activities [31]. We recommend that future studies inves- tigate muscle activities in people with more disabling LBP as it might illuminate the difference in muscle activities among the studied groups.
The results of this study showed that subjects with and without NS-CLBP presented with similar muscular patterns, and the significant increase in pain among the NS-CLBP subgroups related to MCI over the 1-hour sitting might not be attributed to these muscular patterns. Recognizing the ab- sence of muscular pattern differences and their limited con- tributions to pain development might enhance the applica- tion of the classification-based cognitive functional therapy [36], mainly in FP and AEP subgroups. A postural biofeed- back rather than muscular activation training to facilitate proper lumbosacral kinematics might be relevant in spine re- habilitation [36]. Finally, incorporation of these findings to assessment and intervention approaches might advance NS-CLBP management.
In conclusion, the findings of the present study introduce several unique contributions to the LBP literature. First, this study was the first to highlight the similarities in trunk mus- cle activities among homogenous NS-CLBP patients related to MCI and compared them to healthy controls while sitting for an extended period of time. In addition, this study’s re- sults showed that trunk muscle activation, whether ampli- tudes or coactivation indices, alone is not sufficient to show the entire picture of the motor control faults in NS-CLBP subgroups with MCI, and it is imperative to examine other variables, such as lumbosacral kinematics in order to detect the other possible pain drivers in this population.
Conflict of Interest
The authors declared no potential conflicts of interest with respect to the authorship and/or publication of this article.
References
1. Lim SS, Vos T, Flaxman AD, Danaei G, Shibuya K, Adair-Rohani H, et al. A comparative risk assessment of burden of disease and injury attributable to 67 risk factors and risk factor clusters in 21 regions, 1990-2010: a systematic analysis for the Global Burden of Disease Study 2010. Lancet 2012;380:2224-60.
2. Papageorgiou AC, Croft PR, Ferry S, Jayson MI, Silman AJ.
Estimating the prevalence of low back pain in the general popu- lation. Evidence from the South Manchester Back Pain Survey.
Spine (Phila Pa 1976) 1995;20:1889-94.
3. Hoy D, Bain C, Williams G, March L, Brooks P, Blyth F, et al. A systematic review of the global prevalence of low back pain.
Arthritis Rheum 2012;64:2028-37.
4. Thomas E, Silman AJ, Croft PR, Papageorgiou AC, Jayson MI, Macfarlane GJ. Predicting who develops chronic low back pain in primary care: a prospective study. BMJ 1999;318:1662-7.
5. Hoy D, Brooks P, Blyth F, Buchbinder R. The Epidemiology of low back pain. Best Pract Res Clin Rheumatol 2010;24:769-81.
6. Hayden JA, Dunn KM, van der Windt DA, Shaw WS. What is the prognosis of back pain? Best Pract Res Clin Rheumatol 2010;24:
167-79.
7. Hayden JA, Tougas ME, Riley R, Iles R, Pincus T. Individual re- covery expectations and prognosis of outcomes in non-specific low back pain: prognostic factor exemplar review. Cochrane Database Syst Rev 2014;(9):CD011284.
8. Dillingham T. Evaluation and management of low back pain: an overview. STARs 1995;9:559-74.
9. O’Sullivan P. Diagnosis and classification of chronic low back pain disorders: maladaptive movement and motor control im- pairments as underlying mechanism. Man Ther 2005;10:242-55.
10. Arena JG, Sherman RA, Bruno GM, Young TR. Electromyo- graphic recordings of low back pain subjects and non-pain con- trols in six different positions: effect of pain levels. Pain 1991;45:
23-8.
11. Astfalck RG, O’Sullivan PB, Straker LM, Smith AJ, Burnett A, Caneiro JP, et al. Sitting postures and trunk muscle activity in adolescents with and without nonspecific chronic low back pain:
an analysis based on subclassification. Spine (Phila Pa 1976) 2010;35:1387-95.
12. Dankaerts W, O’Sullivan P, Burnett A, Straker L. Altered patterns of superficial trunk muscle activation during sitting in nonspeci- fic chronic low back pain patients: importance of subclassifi- cation. Spine (Phila Pa 1976) 2006;31:2017-23.
13. O’Sullivan K, McCarthy R, White A, O’Sullivan L, Dankaerts W.
Lumbar posture and trunk muscle activation during a typing task when sitting on a novel dynamic ergonomic chair. Ergonomics 2012;55:1586-95.
14. Sheeran L, Sparkes V, Caterson B, Busse-Morris M, van Deursen R. Spinal position sense and trunk muscle activity during sitting
and standing in nonspecific chronic low back pain: classification analysis. Spine (Phila Pa 1976) 2012;37:E486-95.
15. Cassisi JE, Robinson ME, O’Conner P, MacMillan M. Trunk strength and lumbar paraspinal muscle activity during isometric exercise in chronic low-back pain patients and controls. Spine (Phila Pa 1976) 1993;18:245-51.
16. Schinkel-Ivy A, Nairn BC, Drake JD. Investigation of trunk mus- cle co-contraction and its association with low back pain devel- opment during prolonged sitting. J Electromyogr Kinesiol 2013;
23:778-86.
17. Dankaerts W, O’Sullivan P, Burnett A, Straker L. Differences in sitting postures are associated with nonspecific chronic low back pain disorders when patients are subclassified. Spine (Phila Pa 1976) 2006;31:698-704.
18. Hemming R, Sheeran L, van Deursen R, Sparkes V. Non-specific chronic low back pain: differences in spinal kinematics in sub- groups during functional tasks. Eur Spine J 2018;27:163-70.
19. Hwang UJ, Kwon OY, Jung SH, Ahn SH, Kim HA. Predictors of pain intensity and Oswestry Disability Index in prolonged stand- ing service workers with nonspecific chronic low back pain sub- classified as active extension pattern. Musculoskelet Sci Pract 2019;40:58-64.
20. Nelson-Wong E, Callaghan JP. Is muscle co-activation a predis- posing factor for low back pain development during standing? A multifactorial approach for early identification of at-risk indivi- duals. J Electromyogr Kinesiol 2010;20:256-63.
21. O’Sullivan PB. Lumbar segmental ‘instability’: clinical presenta- tion and specific stabilizing exercise management. Man Ther 2000;5:2-12.
22. Dankaerts W, O’Sullivan P. The validity of O’Sullivan’s classi- fication system (CS) for a sub-group of NS-CLBP with motor control impairment (MCI): overview of a series of studies and re- view of the literature. Man Ther 2011;16:9-14.
23. Hawker GA, Mian S, Kendzerska T, French M. Measures of adult pain: Visual Analog Scale for Pain (VAS Pain), Numeric Rating Scale for Pain (NRS Pain), McGill Pain Questionnaire (MPQ), Short-Form McGill Pain Questionnaire (SF-MPQ), Ch- ronic Pain Grade Scale (CPGS), Short Form-36 Bodily Pain Scale (SF-36 BPS), and measure of Intermittent and Constant Osteoarthritis Pain (ICOAP). Arthritis Care Res (Hoboken) 2011;
63 Suppl 11:S240-52.
24. van Deursen LL, Patijn J, Durinck JR, Brouwer R, van Erven- Sommers JR, Vortman BJ. Sitting and low back pain: the positive effect of rotary dynamic stimuli during prolonged sitting. Eur Spine J 1999;8:187-93.
25. Rabey M, Smith A, Beales D, Slater H, O’Sullivan P. Differing psychologically derived clusters in people with chronic low back pain are associated with different multidimensional profiles. Clin J Pain 2016;32:1015-27.
26. Hermens HJ, Freriks B, Disselhorst-Klug C, Rau G. Develop- ment of recommendations for SEMG sensors and sensor place- ment procedures. J Electromyogr Kinesiol 2000;10:361-74.
27. Drake JD, Fischer SL, Brown SH, Callaghan JP. Do exercise balls provide a training advantage for trunk extensor exercises?
A biomechanical evaluation. J Manipulative Physiol Ther 2006;
29:354-62.
28. Ng JK, Kippers V, Richardson CA. Muscle fibre orientation of abdominal muscles and suggested surface EMG electrode positions. Electromyogr Clin Neurophysiol 1998;38:51-8.
29. Dankaerts W, O’Sullivan PB, Burnett AF, Straker LM, Danneels LA. Reliability of EMG measurements for trunk muscles during maximal and sub-maximal voluntary isometric contractions in healthy controls and CLBP patients. J Electromyogr Kinesiol 2004;14:333-42.
30. Gregory DE, Dunk NM, Callaghan JP. Stability ball versus office chair: comparison of muscle activation and lumbar spine posture during prolonged sitting. Hum Factors 2006;48:142-53.
31. O’Keeffe M, Dankaerts W, O’Sullivan P, O’Sullivan L, O’Sullivan K. Specific flexion-related low back pain and sitting: compar- ison of seated discomfort on two different chairs. Ergonomics 2013;56:650-8.
32. Nairn BC, Azar NR, Drake JDM. On-site observations of spine angle data during prolonged office sitting while performing com- puter-aided drafting work: a case study. IIE Trans Occup Ergonom Hum Factors 2013;1:76-81.
33. Drake JD, Callaghan JP. Elimination of electrocardiogram con- tamination from electromyogram signals: an evaluation of cur- rently used removal techniques. J Electromyogr Kinesiol 2006;
16:175-87.
34. Brereton LC, McGill SM. Frequency response of spine extensors during rapid isometric contractions: effects of muscle length and tension. J Electromyogr Kinesiol 1998;8:227-32.
35. Psycharakis SG, Coleman SGS, Linton L, Kaliarntas K, Valentin S. Muscle activity during aquatic and land exercises in people with and without low back pain. Phys Ther 2019;99:297-310.
36. Vibe Fersum K, O’Sullivan P, Skouen JS, Smith A, Kvåle A.
Efficacy of classification-based cognitive functional therapy in patients with non-specific chronic low back pain: a randomized controlled trial. Eur J Pain 2013;17:916-28.