• 검색 결과가 없습니다.

Comparison of Edge Localization Performance of Moment-Based Operators Using Target Image Data

N/A
N/A
Protected

Academic year: 2021

Share "Comparison of Edge Localization Performance of Moment-Based Operators Using Target Image Data"

Copied!
12
0
0

로드 중.... (전체 텍스트 보기)

전체 글

(1)

1. Introduction

Edges are linear features in images where brightness values change abruptly. For extracting and recognizing object from images, it is essential to find edge pixels and localize the position of edges. Because of the importance of edges in image processing and computer vision, considerable efforts have been made to extract and localize the edges in images. Canny (1986) proposed an edge extraction method which detect edge pixels based on gradients. Lindeberg (1998) detected

edges based on local image structures and scales. Many methods for edge detection were reviewed extensively in Ziou and Tabbone (1998), Basu (2002), and Papari and Petkov (2011).

For precise extraction of edges from images, it is essential to localize the position of edges in subpixel accuracy. Many methods have been suggested for subpixel localization of edges. Tabatabai and Mitchell (1984) presented a moment-based approach which localizes edges by finding edge the edge parameters with a condition that the resulting edge model preserves

Comparison of Edge Localization Performance of Moment-Based Operators Using Target Image Data

Suyoung Seo

Department of Civil Engineering, Kyungpook National University

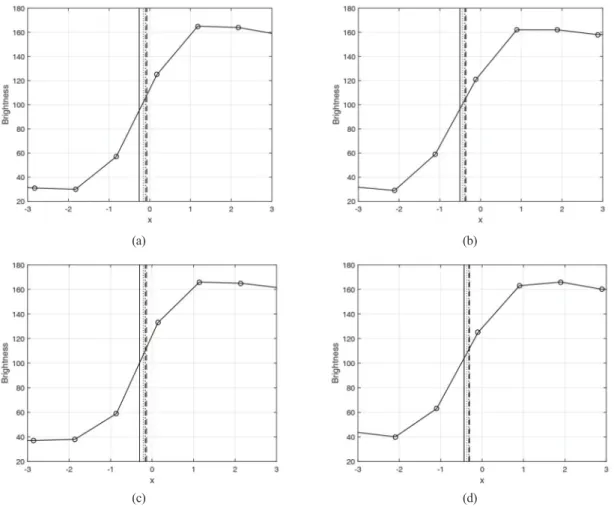
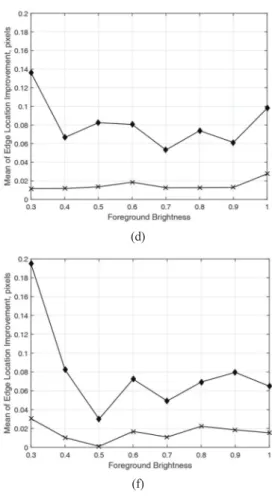
Abstract : This paper presents a method to evaluate the performance of subpixel localization operators using target image data. Subpixel localization of edges is important to extract the precise shape of objects from images. In this study, each target image was designed to provide reference lines and edges to which the localization operators can be applied. We selected two types of moment-based operators: Gray-level Moment (GM) operator and Spatial Moment (SM) operator for comparison. The original edge localization operators with kernel size 5 are tested and their extended versions with kernel size 7 are also tested. Target images were collected with varying Camera-to-Object Distance (COD). From the target images, reference lines are estimated and edge profiles along the estimated reference lines are accumulated. Then, evaluation of the performance of edge localization operators was performed by comparing the locations calculated by each operator and by superimposing them on edge profiles. Also, enhancement of edge localization by increasing the kernel size was also quantified. The experimental result shows that the SM operator whose kernel size is 7 provides higher accuracy than other operators implemented in this study.

Key Words : Subpixel localization, target image, moment-based operators, localization performance

Received January 8, 2016; Revised February 16, 2016, Accepted February 18, 2016.

Corresponding Author: Suyoung Seo ([email protected])

This is an Open-Access article distributed under the terms of the Creative Commons Attribution Non-Commercial License (http://creativecommons. org/licenses/by-nc/3.0) which permits unrestricted non-commercial use, distribution, and reproduction in any medium, provided the original work is properly cited

Article

(2)

gray-level moments of an edge profile. Lyvers et al.

(1989) proposed another moment-based approach which is based on the concept of spatial moments.

Cheng and Wu (2005) used principal axis analysis and a moment-preserving technique to find the subpixel location of edges. Ye et al. (2005) proposed a fitting- based method which considers blurring effect by using Gaussian function and uses the least squares minimization. Hagara and Kulla (2011) presented another fitting-based method which uses an Erf function for localizing edges in subpixel accuracy.

Chen et al. (2014) also proposed a fitting-based method which employs a logistic function as an edge model.

Trujillo-Pino et al. (2013) presented a method to find the subpixel position of edges using the relationships between edge parameters and the coverage of intensities of both sides of an edge over each pixel in the neighborhood pixels of an edge pixel.

Although many approaches have been suggested for subpixel localization, there has been little research on evaluating the performance of edge localization operators in a systematic manner. Thus, in this study, we propose a method to evaluate the performance of edge localization operators using target sheet images.

We selected two moment-based operators proposed in Tabatabai and Mitchell (1984) and Lyvers et al. (1989) for comparison.

In Section 2, we describe the general concept of the two selected moment-based approaches. In Section 3, data acquisition of target sheet images is described.

In Section 4, experimental results of performance evaluation are presented. In Section 5, we conclude this paper.

2. Moment-Based Operators Compared in This Study

1) Gray-level moment (GM) operator Tabatabai and Mitchell (1984) proposed a moment-

based operator which uses gray-levels of an edge profile when calculating edge parameters. Fig. 1 illustrates parameters of the edge model of the kernel size 5. As can be seen, the edge model contains parameters of dark side brightness value - h

1

, bright side brightness value - h

2

, and the distance of the subpixel location from the origin - k. The algorithm takes five brightness values from an edge profile and assigns those values to locations from 0.5 to 4.5 with an interval of 1.0. From the calculation of the value of k, the final edge location is calculated on the x-axis by subtracting the value of 2.5 from the value of k.

For the n number of the given brightness values of I, the first three gray-level moments are calculated as:

_

m

i

= ∑

nj = 1

I

ji

, i = 1, 2, 3 (1) The calculated moments are used to model edge parameters as:

_

m

i

= ∑

2j = 1

p

j

h

ji

(2) where

p

1

=

p

j

= 1

Before calculating the model parameters, a few of intermediate parameters are calculated as:

2

= _

m

2

_ _m

12

(3) _

s = (4) 1 n

k n

Σ

2 j = 1

m _

3

+ 2 _ m

13

_ 3_m

1

_

m

2

3

Fig. 1. Edge model parameters for the GM operator.

(3)

p

2

= [ 1 _ _ s ] (5) p

1

= 1 _ p

2

(6) Finally, the edge model parameters are calculated using the intermediate parameters as:

k = np

1

(7) h

1

= _

m

1

_ _σ (8) h

2

= _

m

1

+ _σ (9)

2) Spatial moment (SM) operator

Lyvers et al. (1989) proposed a moment-based operator which models edges parameters using location and brightness of each pixel along an edge profile. It should be noted that this operator uses both location and brightness values of edge pixels while the GM operator uses only the brightness values when calculating moments. The edge model parameters of the SM operator are illustrated in Fig. 2. The edge model contains three parameters h, k and l which are dark side brightness value, brightness contrast, and subpixel edge location within the interval from -1 to 1. The algorithm first takes five input brightness values and assigns those values to the position between -1 to 1 so that the values are equally spaced as shown in Fig. 2.

As described in Lyvers et al. (1989), the algorithm

is based on a continuous function f(x) of each brightness value _ x as:

M

p

= ∫x

p

f (x)dx (10) Therefore, the first three spatial moments are computed as:

M

0

= h∫

1_1

dx + k ∫

l1

dx = 2h + k(1 _ l) (11) M

1

= h∫

1_1

x dx + k ∫

l1

x dx = k(1 _ l

2

) (12)

M

2

= h∫

1_1

x

2

dx + k ∫

l1

x

2

dx = h + k(1 _ l

3

) (13)

Then, the edge parameters are calculated as:

l = (14)

k = (15)

h = [M

0

_ k(1 _ l)] (16) After computing the subpixel location within the range from -1 to 1, it is scaled and translated so that the resulting position ranges from -2.5 to 2.5.

3) Extension of the operators

Lyvers et al. (1989) used the kernel of size 5 for experiments on the GM and SM operators. The kernel size needs to be large enough to contain the dark and bright sides and the transition region between them.

However, it is not uncommon that edges observed in images have a wide transition region from the dark side to the bright side due to image blurring effect, such that the kernel of size 5 is not enough to localize the edge position accurately. Thus, in this study, we also extended the size of kernels to 7 and compared the localization performance of the GM and SM operators with kernel size of both 5 and 7.

Also, as indicated by Lyvers et al. (1989), the position calculated by the operators has systematic bias and we need to subtract the bias from the calculated position for better positional accuracy. Fig. 3 shows the

1 2 1

4 + _s

2

p

1

p

2

p

2

p

1

1 2 2 3 1

3

3M

2

_ M

0

2M

1

2M

1

1 _ l

2

1 2

Fig. 2. Edge model parameters for the SM operator.

(4)

amount of bias which needs to be subtracted. As depicted in Fig. 3, the biases for the GM operators do not change against the kernel size but those for the SM operator change such that the amount of bias for the kernel of size 7 is smaller than that for the kernel of size 5.

3. Acquisition of Target Images

For acquisition of target images, we used a DSLR camera. The detail setting of the camera is summarized in Table 1. In order to acquire images without

movement of the camera, shutter was controlled remotely during the whole acquisition process.

The target sheets used in this study adopt those proposed in Seo (2016). The general shape of the target sheets is illustrated in Fig. 4. Each target sheet contains four reference regions which are black elongated ones in the figure. Two of them are used for constructing a horizontal reference line and the other two for constructing a vertical reference line. In the central area, there are four squared regions. Two of them are black throughout all target sheets which are called background regions in this paper, and the other two are gray from 0.3 to 1.0 (white) with interval of 0.1 which Fig. 3. Bias amount in edge localization for the moment-based operators. (a) shows a bias table for the operators with the kernel size

of 5, and (b) a bias table for the operators with the kernel size of 7.

(a) (b)

Table 1. Specifications of the camera setting used in this study

Category Characteristic item Specification

Camera body

Camera model name NIKON D300S

Image sensor 23.6 mm × 15.8 mm CMOS sensor

Image size 2,848 × 4,288

File type (compression) JPEG (fine 1:4)

Lens Lens model name Nikon AF NIKKOR 14mm

Picture angle 90º

Camera setting

F-Stop F/4

Shutter speed 1/6 s

ISO sensitivity ISO-100

Tripod Leg HORUS BENNU C-3540V

Head LX-5

Shutter control Shutter controller RFN-4-TX

(5)

are called foreground regions. The set of original target sheets originally suggested in Seo (2016) have 10 sheets from 0.1 to 1.0 with interval of 0.1. But in this study, target sheets with Foreground Brightness (FB) - 0.1 and 0.2 were found to have low contrast between foreground and background regions so that edge profiles occurring in the boundaries become not to be Fig. 4. Target sheet design used in this study.

Fig. 5. Sections for edge profile accumulation. The numbers from 1 to 4 indicate each section number. The arrows indicate the edge profile direction in each section.

Fig. 6. Projection of an edge profile onto the axis normal to a reference line.

Fig. 7. Cropped red band images. Figure (a)-(f) show cropped images with FB 0.8 for CODs from 1 m to 6 m with interval 1 m.

(d) (a)

(f) (c)

(e)

(b)

(6)

stable enough to find edge position in an accurate manner. Thus, in this study, only 8 target sheets which have FB from 0.3 to 1.0 are used.

For each image, the horizontal and vertical reference regions are extracted using connected component labeling and region property analysis. Then, the center lines of the reference regions are extracted with subpixel accuracy and a least squares adjustment is performed to calculate the geometry of the reference lines. Then, edge profiles are collected along the boundaries between foreground and background regions in the central part of the target image with the direction and order in each boundary section as shown in Fig. 5.

Each edge profile along each column or row is projected on the axis which is normal to an estimated reference line as shown in Fig. 6.

Each target image with FB from 0.3 to 1.0 was taken with Camera-to-Object Distances (COD) from 1 m to 6 m with interval of 1 m. Thus, a total of 48 images were used for the experimental evaluation of edge localization operators. The images were cropped so that the resulting images contain only the target part. For the experiment, only the red band of each image was utilized. Fig. 7 shows the cropped images with FB 0.8 at each COD.

4. Experimental Result

Two GM operators with the kernel size of 5 and 7 and two SM operators with the kernel size of 5 and 7 were modelled and compared in this study. For the experiment, the operators were applied to 48 target sheet images. Implementation of the operators was performed in the Matlab R2014b environment.

Fig. 8 shows the localization results for the target images of FB = 0.8. Localization results in the figure are divided into 4 sections as indicated in Fig 5. As can be seen, edge displacements which are differences

between the real edges and the calculated edges occurred toward dark sides, resulting in negative values in edge positions. The amount of displacements against FB is reported in detail in Seo (2016). From a visual inspection of Fig. 8, the variation of edge locations was within 0.6 pixels throughout all the 4 operators implemented in this study. Artificial fluctuations were observed in the localization result of the GM operators applied to the image - FB = 0.8 and COD = 1 m but those fluctuations did not occur elsewhere in all the other results. As can be seen in Fig. 8, the improvement by changing the kernel size from 5 to 7 does not make significant change in the case of the GM operators, which is less than 0.05 pixels in general. However, those in the case of the SM operators were found to be nontrivial, resulting in differences up to 0.1 pixels.

We calculated the standard deviation of edge positions in each section and then calculated the mean of those standard deviations of 4 sections. Fig. 9 shows the resulting mean of standard deviations of four sections for each combination of COD and FB. It shows the internal stability in localizing edges of each edge positioning operator against change of FB and COD. As can be seen in the figure, the standard deviations are larger than 0.05 in the cases of FBs = 0.3 and 0.4 but become equal to or less than 0.05 in the cases of FBs = 0.5 to 1.0. Thus, it can be noted that sufficient contrast makes the edge localization relatively stable. However, from a visual inspection of Fig. 9 (a), the GM operators applied to the image with COD 1 m were found to produce standard deviations almost equal to 0.1 which are larger than the results by the SM operators.

For verifying the quality of edge localization of four operators, we compared localization results at the edge profiles where the differences of position values are relatively large. It should be noted that the reference lines were used for collecting edge profiles but not for evaluating the accuracy of the localization operators.

The central position of each edge profile was

(7)

determined by a visual inspection of that and used in evaluating the accuracy of each localization operator.

Fig. 10 shows the results of localization of each operator for 4 edge profiles. From a visual inspection of the edge profiles in the figure, we can confirm two

aspects. Firstly, the SM operators localized edge positions more accurately than the GM operators.

Secondly, the increase of kernel size from 5 to 7 was effective to increase edge localization accuracy in the case of SM but the increase of the kernel size does not

Fig. 8. Comparison of calculated edge locations. The edge locations were calculated for the images with FB = 0.8. Edge locations calculated with the kernel size of 5 are drawn in gray lines and those with the kernel size of 7 in black lines. Figures a, c, e, g, i, and k show edge locations calculated by the GM operators and Figures b, d, f, h, j, and l those by the SM operators for images with CODs from 1 m to 6 m, respectively.

(e)

(c) (d)

(a) (b)

(f)

(8)

increase the accuracy in the case of GM.

Further, we calculated the improvement amount from operators with kernel size 5 to those with kernel size 7. Fig. 11 shows the improvement amount across all CODs and all FBs. From the figure, it is shown that the SM operator with kernel size 7 improves edge

locations with the average of about 0.06 pixels while the GM operator with kernel size 7 improves them with the average of 0.03 throughout all the target sheet images.

Fig. 8. Continued.

(k)

(i) (j)

(g) (h)

(l)

(9)

5. Conclusion

In this study, we compared the performance of edge

localization operators with target image data. From the experiments, it is shown that target image data are useful to evaluate the edge localization operators by Fig. 9. Mean of standard deviations of the edge locations in four sections. (a)-(f) show the results for images with COD from 1 m to 6 m, respectively. The means of the GM operator with kernel size 5 are shown in +-marked lines, those of the GM operator with kernel size 7 in x-marked lines, those of the SM operator with the kernel size 5 in square-marked lines, and those of the SM operator with the kernel size 7 in diamond-marked lines.

(e)

(c) (d)

(a) (b)

(f)

(10)

Fig. 10. Calculated edge locations superimposed on edge profiles (lines with circles). Edge locations calculated by GM with the kernel size of 5 are shown in dashed lines, those by GM with the kernel size of 7 in dash dot lines, those by SM with the kernel size of 5 in dotted lines, and those by SM with the kernel size of 7 in solid lines. Figure (a) shows edge locations for COD 1 m, FB 0.8 and profile number 200, Figure (b) those for COD 2 m, FB 0.8 and profile number 120, Figure (c) those for COD 3 m, FB 0.8 and profile number 45, and Figure (d) those for COD 6 m, FB 0.8 and profile number 2. The profile numbers can be referred to in the horizontal axis of Fig. 8.

(c)

(a) (b)

(d)

Fig. 11. Mean of edge localization improvements. (a)-(f) show results for images with CODs from 1 m to 6 m with interval of 1 m, respectively. The improvements in the case of the GM operators are shown in x-marked lines and those in the case of the SM operators in diamond-marked lines.

(a) (b)

(11)

providing reference lines and edge profiles to which the edge operators were applied.

We investigated two types of moment operators.

Because of the limitations of the two original operators with kernel size 5, we modeled two extended moment- based operators so that they can be applied to kernel size 7. From the experiments, the extension of kernel size in case of SM operators improved the edge localization performance effectively while the extension in case of GM operators improved that trivially. The methodology presented in this study was proven to be efficient to quantify the performance of edge localization operators. Thus, we believe that the procedure proposed in this study can be applied to test the performance of other subpixel localization operators.

Acknowledgment

This research was supported by Kyungpook National University Research Fund, 2012.

References

Basu, M., 2002. Gaussian-based edge-detection methods - a survey, IEEE Transaction on Systems, Man and Cybernetics, 32(3): 252-260.

Canny, J., 1986. A computational approach to edge detection, IEEE Transaction o Pattern Analysis Machine Intelligence, PAMI-8(6): 679-698.

Chen, P., F. Chen, Y. Han, and Z. Zhang, 2014. Sub- pixel dimensional measurement with Logistic edge model, Optik, 125: 2076-2080.

Fig. 11. Continued.

(e)

(c) (d)

(f)

(12)

Cheng, S.-C. and T.-L. Wu, 2005. Subpixel edge detection of color images by principal axis analysis and moment-preserving principle, Pattern Recognition, 38: 527-537.

Hagara, M. and P. Kulla, 2011. Edge detection with sub-pixel accuracy based on approximation of edge with Erf function, Radioengineering, 20(2): 516-524.

Lindeberg, T., 1998. Edge detection and ridge detection with automatic scale selection, International Journal of Computer Vision, 30(2): 117-154.

Lyvers, E.P., O.R. Mitchell, M.L. Akey, and A.P.

Reeves, 1989. Subpixel measurements using a moment-based edge operator, IEEE Transaction on Pattern Analysis Machine Intelligence, 11(12): 1293-1309.

Papari, G. and N. Petkov, 2011. Edge and line oriented contour detection: state of the art, Image and Vision Computing, 29: 79-103.

Seo, S., 2016. Estimation of edge displacement against brightness and camera-to-object distance, IET Image Processing (in review).

Tabatabai, A. and R. Mitchell, 1984. Edge location to subpixel values in digital imagery, IEEE Transaction on Pattern Analysis and Machine Intelligence, 1984, PAMI-6(2): 188-201.

Trujillo-Pino, A., K. Krissian, M. Aleman-Flores, and D. Santana-Cedres, 2013. Accurate subpixel edge location based on partial area effect, Image and Vision Computing, 31: 72-90.

Ye, J., G. Fu, and U.P. Poudel, 2005. High-accuracy edge detection with blurred edge model, Image and Vision Computing, 23: 453-467.

Ziou, D. and S. Tabbone, 1998. Edge detection techniques - an overview, International Journal of Pattern Recognition and Image Analysis, 8:

537-559.

수치

Fig. 1.  Edge model parameters for the GM operator.
Fig. 2.  Edge model parameters for the SM operator.
Table 1.  Specifications of the camera setting used in this study
Fig. 6.  Projection of an edge profile onto the axis normal to a reference line.
+4

참조

관련 문서

TTD Tracked target data TTM Tracked target message WPL Waypoint location.. MANTADIGITAL TM Operators Handbook; Part 2 of 2, issue 3, April 2012.. Page

- Transition to H-mode: state with reduced turbulence at the plasma edge - Formation of an edge transport barrier: steep pressure gradient at the edge...

Also, in order to estimate the consequentially colliding relations of the benefits and cost of using location based services, perceived value, security

Moreover, it describes how this education should be oriented with referring to studies and literature based on the understanding of reading book

This work builds inversely a base performance model of a turboprop engine to be used for a high altitude operation UAV using measured performance data,

à An element of material near the center of the shaft has a low stress and a small moment arm and thus contributes less to the twisting moment than an

We have implemented and developed a virtual angioscopy system based on the proposed methods, and tested it using several actual data sets of human blood

In this paper, it is implemented the image retrieval method based on interest point of the object by using the histogram of feature vectors to be rearranged.. Following steps