도시과학 제9권 제1호 2020. 06 33-40쪽
1. Introduction
Analyzing factors that influence on housing prices has been interests of urban planners and real estate economists. Determinants of housing prices has been known that include that structural factors of houses, ambient environments, accessibility of transportations, education, macro-economic factors and policies, etc.
The recent rise in apartment prices has also led to a rise in jeonse prices. People's perception has changed due to structural changes in the social economy, such as low birth rates, aging, low growth and shrinking population. Apartments are being changed from investment purposes to residential purposes. They are looking for a residence that suits them according to their purpose, such as education, environment, and retirement.
Throughout society, citizens have become more interested in quality of life than in growth. The desire for a healthy and comfortable life, that is, well-being, has increased rather than efficiency and functionality (Kim, 2006). Due to this social phenomenon, the government and local autonomous governments began to build more eco-friendly residential environments, and recently began building apartments that emphasized the
surrounding environment and location conditions, unlike the previous housing selection criteria.
In this regard, Many studies have been conducted on factors that determine apartment prices. Most studies have argued that factors that determine apartment prices are factors such as the physical structure of apartments such as rooms and bathrooms, accessibility to subway stations, educational environment, etc. However, most of the researchers analyzed the factors affecting apartment prices. The use of jeonse prices, not selling prices, allows the analysis of residential value determinants without the investment value of apartments.
Therefore, The purpose of this study is to analyze factors that influence on apartment rents targeting the Seoul Metropolitan Region (SMR), and We used spatial econometric models(Spatial Autoregressive Model, Spatial Errors Model, General Spatial Model, Geographically Weighted Regression) for this analysis.
The Apartment sale price data includes not only residential value but also investment value.
Therefore, We used the Apartment rent data for analyze only the residential value. Apartment rent price data were used Sales price in the actual transactions from Ministry of Land, Infrastructure and Transport (MOLIT) in 2019 with total of 3,649 samples of apartment sales for the SMR. Spatial
* Researcher, Spatial Information Industry Promotion Institute
DETERMINANTS OF APARTMENT RENTS IN THE SEOUL METROPOLITAN REGION: SPATIAL ECONOMETRIC
APPROACHES
Lee, Dongsung*
Abstract[: This research aims to analyze the determinants of apartment rents in the Seoul Metropolitan area using spatial econometrics approaches. Since spatial econometrics approaches have advantages to solve limitations of ordinary multiple regression such as spatial dependence and spatial heterogeneity. This research includes structural variables such as number of rooms and baths, neighborhood variables such as number of housing units in the apartment complex, and location variables including distances to subway stations, to traditional markets, to educational institutes, and to urban services such as parks, etc. The result shows that the accessibilities to the CBD, to subcenters, to subway station, to school, and to parks contribute to apartment rent uplift and also shows different spatial variations in rent premiums by accessibility variables. In particular, apartments located south of Han river along the Lines 2, 3, 7 and 9 have the highest rent premiums due to the accessibility to the subway.
Key Words: Apartment rents, Spatial Econometrics, CBD, Subway
distribution is The Seoul Metropolis, Incheon Metropolitan City, Gyeonggi Metropolitan Area.
Time distribution is the third quarter of 2019.
This study consists of five sections. The First sections describes literature review on the Determinant Apartment rents, The second section describes analysis on determinants of apartment rents in the SMR, The third section describes interpretation of results, and last section is conclusion.
2. Literature Review
For a long time, the hedonic regression approach has been utilized extensively in the housing market literature to investigate the relationship between house prices and housing characteristics. Hedonic Price Model is based on the consumer theory of Lancaster(1966). After Rosen(1974) had instituted it in the housing market, lots of preceding researches using this method have been presented. This method can analyzed how structural factors such as sizes of houses, the numbers of rooms and bathrooms, and environmental factors such as education, transportation, amenity, and locational properties influence on housing prices.
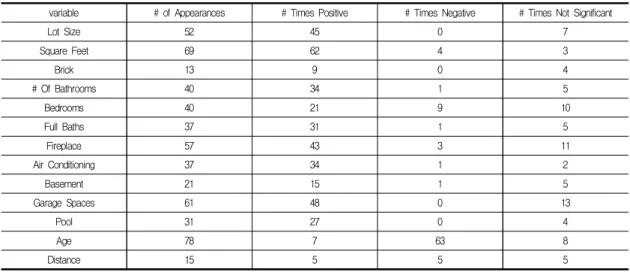
As shown in the table 1, Sirmans et al. (2005) reviewed the hedonic pricing models of 125 empirical studies. There is some parameter
uncertainty for even key housing characteristics.
This parameter uncertainty manifests itself in signs that are opposite to expectations or estimates that are statistically insignificant. For example, although age has a negative sign in most studies, it is positive in some. In contrast, the general expectation is that the number of bedrooms would have a positive effect on house price. Forty studies examining this variable, almost half (19 studies) show a negative or not-significant result.
As we mentioned in previous examples, why parameter is Uncertainty? The first reason is that parameter variation for housing characteristics was not fully explained by regional differences, different specifications, or alternative data sets.
Second reason is that housing characteristics may not be valued the same across a given distribution of housing prices. And last reason is that the OLS regression is questioned to identify the different market segments and their implicit prices.
Therefore, a more appropriate approach is required. There are some research on semi-parametric and nonparametric approaches.
Bin (2004) estimated a hedonic price function using a semi-parametric regression and compares the price prediction performance with conventional parametric models. According to his research, He analyzes a hedonic price model using a semi-parametric regression and compares the price prediction performance with conventional parametric models. His results show that the
variable # of Appearances # Times Positive # Times Negative # Times Not Significant
Lot Size 52 45 0 7
Square Feet 69 62 4 3
Brick 13 9 0 4
# Of Bathrooms 40 34 1 5
Bedrooms 40 21 9 10
Full Baths 37 31 1 5
Fireplace 57 43 3 11
Air Conditioning 37 34 1 2
Basement 21 15 1 5
Garage Spaces 61 48 0 13
Pool 31 27 0 4
Age 78 7 63 8
Distance 15 5 5 5
Table 1. Previous Hedonic Pricing Model Studies (Sirmans et al. (2005))
semi-parametric regression outperforms the parametric counterparts in both in-sample and out-of-sample price predictions, indicating that the semi-parametric model can be useful for measurement and prediction of housing sales prices.
Bao and Wan (2004) researched about that on the use of spline smoothing in estimating hedonic housing price models by using Hong Kong data.
They demonstrated how the technique of smoothing splines can be used to estimate hedonic housing price models. Smoothing splines are a powerful approach to the analysis of housing data as they are exceptionally flexible in their functional forms and provide a computationally tractable method even with a large number of explanatory variables.
Kim and Park (2005) researched about that segmentation of the housing market and its determinants in the Seoul and its neighbouring new towns in Korea. They find the spatial pattern of housing price changes. The results of a cluster analysis show that the spatial pattern of housing price change rates is not correlated with housing prices.
Filho and Bin (2005) estimated hedonic price functions via additive nonparametric regression.
Estimation is done via a back fitting procedure in combination with a local polynomial estimator. It avoids the pitfalls of an unrestricted nonparametric estimator. They compare their results to an alternative parametric model and find evidence of the superiority of our nonparametric model. From an empirical perspective their study is interesting in that the effects on housing prices of a series of environmental characteristics are modeled in the regression. They find these characteristics to be important in the determination of housing prices.
Fan et al. (2006) analyzed the relationship between house prices and housing characteristics using a decision tree approach. Using the Singapore resale public housing market as a case study, this research demonstrates the usefulness of this technique in examining the relationship between house prices and housing characteristics, identifying the significant determinants of housing prices and predicting housing prices.
Kestens et al. (2006) introduce household-level data into hedonic models in order to measure the heterogeneity of implicit prices regarding
household type, age, educational attainment, income, and the previous tenure status of the buyers. Two methods are used for this purpose:
One is expansion terms, the other is a Geographically Weighted Regressions. Both methods yield conclusive results, showing that the marginal value given to certain property specifics and location attributes do vary regarding the characteristics of the buyer’s household.
Geographically Weighted Regressions (GWR) provides a number of advantages over the hedonic model, including those models which try to account for spatial effects in the error structure of the model. One of the major advantages of GWR is that it tackles both spatial non-stationarity by accounting for coordinates in parameter estimates, but also spatial dependency by taking into account geographical location in the intercepts.
Therefore, distinctions of this study is that analyzed all the 3,649 samples of apartment rents data in the Seoul Metropolitan Region traded during the third quarter of 2019. It has a merit that it sets the whole Seoul Metropolitan Region as a spatial distribution. And it deals with problems that occur due to not sufficiently controlling factors that typical preceding researches are expected to influence on housing prices. It includes as many controllable variables such as transportation accessibility, educational environment, commercial facilities accessibility, pleasantness, locational factors as possible. Finally, it will be analyzed using the spatial econometric analysis method.
This has the advantage of being able to identify the impact on apartment rental prices differently by region.
3. Analysis on determinants of apartment rents in the SMA
We used apartment rents data that among apartment transactions prices data publically announced by Ministry of Land, Infrastructure and Transport in the third quarter of 2019 (July ~ September). And we collected apartment complex property data using websites related with real estate information. Major apartment brand was used that results of investigation for apartment
brand preference 2018’ selected by real estate information companies: Samsung, GS, Dae-rim, Daewoo, Lotte, Hyundai, Posco, Hyundai-sanup, SK Subway Accessibility was calculated the distances between apartment complexes and subway stations using GIS. The distance to CBD and sub-centers distances were calculated from apartment complexes to Myeong-dong, Gang-nam, Yeong-deung-po, Incheon, and Suwon based on employment density in 2018.
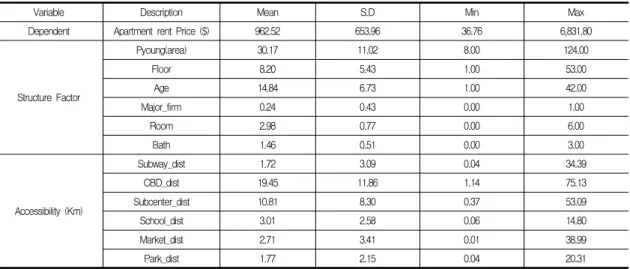
Table 2 shows Variable Specifications.
Dependent variable was used apartment rent price. Structure factor includes pyoung, floor, age, major construction firm, room and bath. Pyoung is area units in Korea. One pyoung is about 3.3㎡.
And accessibility factor includes the distances
between apartment complexes and subway, market, CBD, subcenter and park.
As shown in the table 3, Mean of apartment rent price is about nine hundred sixty two dollars.
Mean of room is about three and Mean of apartment age is about 15years old. Mean of distances between Apartment complexes and subway is 1.72km. Mean of distances between Apartment complexes and CBD, Sub-center, Middle
& High school, Traditional market and Park is each 19.45km, 10.81km, 3.01km, 2,71km and 1.77km.
4. The Result 4.1 Analysis Method
This study used hedonic price analysis method and GWR analysis method.. The Hedonic model made use of the following
Where, is Individual apartment rents, is Constant term, is Coefficient vectors for structural characteristics of apartment complexes, transportation factors, and accessibility factors of urban infrastructures, is Variable matrix for structural characteristics of apartment complexes, transportation factors, and accessibility factors of urban infrastructures and is error term.
In recent years, geographically weighted
Variable Description Variable Description Dependent
Variable LN(Apartment Rent/Month)
Accessibility Factors
Subway Distance DistanceCBD
Sub Center Distance
School Distance
Market Distance DistancePark Structure
Factors
Pyoung (Area) (1pyoung=3.3㎡)
Floor Age Major Brand Firm (1=Major)
Room Bath
Table 2. Variable Specifications
Variable Description Mean S.D Min Max
Dependent Apartment rent Price ($) 962.52 653.96 36.76 6,831.80
Structure Factor
Pyoung(area) 30.17 11.02 8.00 124.00
Floor 8.20 5.43 1.00 53.00
Age 14.84 6.73 1.00 42.00
Major_firm 0.24 0.43 0.00 1.00
Room 2.98 0.77 0.00 6.00
Bath 1.46 0.51 0.00 3.00
Accessibility (Km)
Subway_dist 1.72 3.09 0.04 34.39
CBD_dist 19.45 11.86 1.14 75.13
Subcenter_dist 10.81 8.30 0.37 53.09
School_dist 3.01 2.58 0.06 14.80
Market_dist 2.71 3.41 0.01 38.99
Park_dist 1.77 2.15 0.04 20.31
Table 3. Variable summary statistics
regression (GWR) has become popular for modeling spatial heterogeneity in a regression context. The GWR model extends the traditional
regression framework by allowing model parameters to vary over space for reflecting spatial heterogeneity as follows (Fotheringham et al., 2002):
Spatial heterogeneity in parameters may be assumed to exist continuously or discontinuously.
One common criticism against applying a discontinuous demarcation of the geography is that the study area is sometimes arbitrarily delineated.
Various methods have been used to avoid this problem, see for instance Pace and LeSage (2004) and Casetti (1972). In order to avoid this problem we will use GWR(Geographically Weighted Regression) to test for spatial parameter heterogeneity. A relevant urban application of this method is McMillen (1996). GWR has become popular for modeling spatial heterogeneity in a regression context. The GWR model extends the traditional regression framework by allowing model parameters to vary over space for reflecting spatial heterogeneity as follows (Fotheringham et al., 2002):
Where, is the intercept, and are
coordinates, is the value of the explanatory variable, and is the coefficient related to variable k, and =1,2.... Using coordinates implies that the model allows for spatially smooth variation in the values of the estimated parameters. The estimator of the parameter vector for regression point i is:
The weight function is a n×n matrix, with off-diagonal elements equal to zero, and diagonal elements given by n geographical weights, one for each observation. According to Brunsdon et al. (1998) GWR is relatively insensitive to the choice of weight function. The weight function should, however, make the effect of surrounding observations decrease with increased distance from a given observation.
Variable Description OLS
(Global model)
GWR (Local model)
mean min max
constant 4.354*** 4.426 L -54.069 16.994
Structure Factor
Pyoung(area) 0.018*** 0.014 L -0.035 0.044
Floor 0.005*** 0.005 L -0.021 0.025
Age -0.013*** -0.017 L -0.097 0.058
Brand 0.118*** 0.063 L -0.233 0.438
Room 0.039** 0.051 L -0.416 0.483
Bath 0.108*** 0.093 L -0.760 0.920
Accessibility Factor
Subway -0.016*** -0.050 L -0.310 0.536
CBD -0.016*** -0.007 L -0.434 1.599
Subcenter -0.010*** -0.023 L -1.487 0.311
School -0.045*** -0.009 L -0.246 0.097
market 0.027*** 0.031 L -0.157 0.290
Park -0.020*** -0.057 L -0.274 0.152
R-square 0.6394 0.8092
Adj R-square 0.6382 0.8096
Decay type - Gaussian
*p<0.1, **p<0.01, ***p<0.001, L : Local coefficient mean
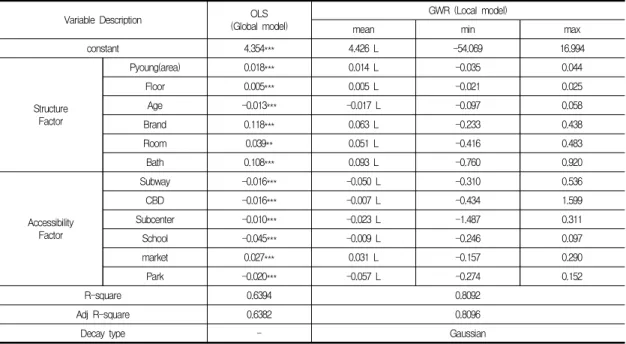
Table 4. Result of analysis using by OLS and GWR
4.2 Results
This study analyzed determinants of apartment rents in the Seoul Metropolitan Region using
apartment transaction data with OLS and GWR.
The result of analysis is shown at the table 4.
The adjusted suggests that 64% of the variation in the dependent variable is explained by the global models which is a good fit given the cross-section nature of the data. As this is a semi-log functional form, the interpretation of the estimated coefficients relates to their proportional (or when multiplied by 100, the percentage) effect on price. All the independent variables for global model(OLS) has the expected signs and are statistically significant at the 1% significance level.
If one Km decrease in distance to the subway, then rent price adds 1.6%, to the CBD adds 1.6%, to the subcenter adds 1.0%, to the middle and high school adds 4.5%, and to the park adds 2.0%
to apartment rent. Interestingly, accessibility to
the traditional market is negatively related to the apartment rent, decreasing apartment rent of 2.7%
at the additional Km closer to the market.
The diagnostic information of the GWR suggests
the local model benefits from a higher adjusted coefficient of determination (adjusted ) from 0.64 to 0.81, identifying a significantly better explanation, after taking the degrees of freedom and complexity into account. The signs of independent variables of the GWR are the same, but different values with the global models.
Interestingly, coefficient values of structural variables between GWR and global models do not significantly vary, but large differences exist in the accessibility variables, because accessibility variables depend on spatial distribution. Rent premiums of distances to the subway and subcenter increase, while those to the CBD and school decrease. According to GWR, additional decrease of unit distance (Km) to the subway adds 5.0% to apartment rent.
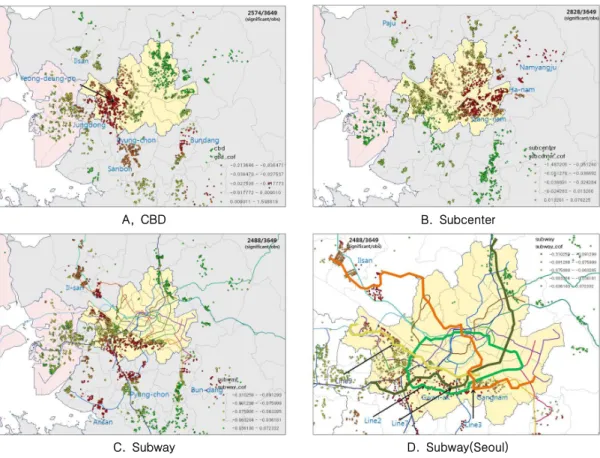
A, CBD B. Subcenter
C. Subway D. Subway(Seoul)
Figure 1. Spatial Variation In Accessibility Impacts
We analyzed spatial variations in the selected accessibility variables (Distances to the CBD, Subcenters, and Subway) by mapping coefficient values with a statistical significance (t>|2|) from the GWR analyses.
As shown at figure 1, Large rent premiums of accessibility to the CBD take place for the apartment located in the Western and Northern areas of Seoul, possibly because of no subcenters near these areas, which can be alternatives to the CBD. In contrast, Southern part of Seoul has a strong rent premiums of accessibility to subcenters, implying that proximity to Gangnam subcenter has influenced to increase apartment rents. Major rent premiums of accessibility to the subway take place in the Southern part of Han river. Especially, apartment along the Lines 2, 3, 7 and 9 have the highest rent premiums due to the accessibility to the subway. Apartments in the New-Towns such as Bundang, Ilsan, and Pyungchon also have substantial rent premiums due to the provision of the subway system.
5. Conclusion
This study analyzed determinants of apartment rents in the Seoul Metropolitan Region using apartment transaction data for those in the third quarter of 2019 with Hedonic and GWR models. The major findings can be summarized as follows.
The global model, as a hedonic model, explains the average impact of accessibility on house prices whereas the GWR local modal offers the opportunity to see the variability in rent premium over the space. GWR provides a significantly better explanation, increasing adjusted from 0.64 to 0.81, after taking the degrees of freedom and complexity into account. In particular, the results show the accessibilities to the CBD, to subcenters, to subway station, to school, and to parks contribute to apartment rent uplift. The results also show different spatial variations in rent premiums by accessibility variables. In particular, apartments located south of Han river along the Lines 2, 3, 7 and 9 have the highest rent premiums due to the accessibility to the subway.
The analysis results of this study may
contribute to the study of this field in several ways. First, the analysis result could help us to understand the factors that determine the lease price in the Seoul metropolitan area since this study comprehensively analyzed the factors that determine the lease price of apartments at the level of the metropolitan area in Seoul. The reliability of the analysis results can be said to be high because the GWR analysis, including the traditional hedonic price model and spatial factors, was applied and the data for the entire metropolitan area was established and analyzed.
Second, the analysis results of this study may suggest meaningful implications for future apartment rental prices and housing policies.
Presently Korean Apartment trade markets are increasing rent as well as selling prices. There are various problems such as housing rental by multiple homeowners and lack of supply of apartments in the Seoul metropolitan area. In this situation, learning precise apartment rents is an important element to predict future apartment demands and provide policy alternatives to prevent rapid increase of apartment rents.
REFERENCES
Anselin, L.(1988), Spatial Econometrics: Methods and Models, Dordrecht: Kluwer Academic Publishers.
BAO, H. X. H. & WAN, A. T. K. (2004). On the use of spline smoothing in estimating hedonic housing price models: empirical evidence using Hong Kong data. Real Estate Economics. vol. 32, issue 3, pp. 487-507.
BIN, O. (2004). A prediction comparison of housing sales prices by parametric versus semi-parametric regressions. Journal of Housing Economics. 13: 68-84.ss.
Casetti, E. (1972). Generating Models by the Expansion Method: Applications to Geographic Research. Geographical Analysis 4, 81-91.
FAN, G., ONG, Z. S. E. & KOH, H. C. (2006).
Determinants of house price: A decision tree approach. Urban Studies. Vol. 43, No.
12, pp. 2301-2315.
FILHO, C. M. & BIN, O. (2005). Estimation of hedonic price functions via additive nonparametric regression. Emprical Economics. 30, pp. 93-114.
Fotheringham, A. S., Brunsdon, C., Charlton, M.
(2002). Geographically weighted regression:
The analysis of spatially varying relationships. New York: Wiley.
KESTENS, Y., THERIAULT, M. & ROSIER, F.D.
(2006). Heterogeneity in hedonic modelling of house prices: looking at buyers’
household profiles. J.Geograph Syst. 8, pp.
61-96.
KIM, K. & PARK, J. (2005). Segmentation of the housing market and its determinants: Seoul and its neighbouring new towns in Korea.
Australian Geographer. Vol. 36, No.2, pp.
221-232.
Kim, T. H., and Lee, C. M., (2006), Dynamics of Greenbelt and Housing Amenity Effects on Housing Rent, Journal of Korea Planning Association, 41(5), 61-79
LANCASTER, K. J. (1966). A new approach to consumer theory. Journal of Political Economy. 74, pp. 132–157.
MALPEZZI, S. (2003). Hedonic pricing models: A selective and applied review. in:
T.O’Sullivan and K. Gibb (Eds) Housing Economics and Public Policy, 67–89.ss.
Malden, MA: Blackwell Science.
McMillen, Daniel P. (1996) “One Hundred Fifty Years of Land Val-ues in Chicago: A Nonparametric Approach,” Journal of Urban Eco-nomics, Vol. 40, pp. 100-124 Pace, R. K., and J. LeSage. (2004). "Chebyshev
Approximation of Log-determinants of Spatial Weight Matrices," Computational Statistics and Data Analysis 45, 179-196.
ROSEN, S. (1974). Hedonic prices and implicit markets: product differentiation in pure competition. Journal of Political Economy.
82, January/February.
Sirmans, G. S., D. A. Macpherson and E. N.
Zietz. (2005). The Composition of Hedonic Pricing Models, Journal of Real Estate Literature, 13:1, 3-46.
논문투고일 2020년 05월 21일 논문심사일 2020년 06월 10일 논문게재일 2020년 06월 30일