Assessment of health risk associated with arsenic exposure from soil, groundwater, polished rice for setting target cleanup
level nearby abandoned mines
Ji-Ho Lee, Won-Il Kim*, Eun-Jung Jeong, Ji-Hyock Yoo, Ji-Young Kim, Je-Bong Lee, Geon-Jae Im, and Moo-Ki Hong
Chemical Safety Division, Department of Agro-Food Safety, National Academy of Agricultural Science, Rural Development Administration, Suwon 441-707, Korea
This study focused on health risk assessment via multi-routes of As exposure to establish a target cleanup level (TCL) in abandoned mines. Soil, ground water, and rice samples were collected near ten abandoned mines in November 2009. The As contaminations measured in all samples were used for determining the probabilistic health risk by Monte-Carlo simulation techniques. The human exposure to As compound was attributed to ground water ingestion. Cancer risk probability (R) via ground water and rice intake exceeded the acceptable risk range of 10-6 ~ 10-4 in all selected mines. In particular, the MB mine showed the higher R value than other mines. The non-carcinogenic effects, estimated by comparing the average As exposure with corresponding reference dose were determined by hazard quotient (HQ) values, which were less than 1.0 via ground water and rice intake in SD, NS, and MB mines. This implied that the non-carcinogenic toxic effects, due to this exposure pathway had a greater possibility to occur than those in other mines. Besides, hazard index (HI) values, representing overall toxic effects by summed the HQ values were also greater than 1.0 in SD, NS, JA, and IA mines. This revealed that non-carcinogenic toxic effects were generally occurred. The As contaminants in all selected mines exceeded the TCL values for target cancer risk (10-6) through ground water ingestion and rice intake. However, the As level in soil was greater than TCL value for target cancer risk via inadvertent soil ingestion pathway, except for KK mine. In TCL values for target hazard quotient (THQ), the As contaminants in soil did not exceed such TCL value. On the contrary, the As levels in ground water and polished rice in SD, NS, IA, and MB mines were also beyond the TCL values via ground water and rice intake. This study concluded that the health risks through ground water and rice intake were greater than those though soil inadvertent ingestion and dermal contact. In addition, it suggests that the abandoned mines to exceed the risk-based TCL values are carefully necessary to monitor for soil remediation.
Key words: Abandoned mines, Arsenic, Ground water, Health risk assessment, Polished rice, Soil, Target cleanup level
Received : January 19. 2011 Accepted : February 25. 2011
*Corresponding author : Phone: +82312900527 E-mail: [email protected]
Introduction
Most of abandoned mines developed in the early 20th century have been left without environmental protection (Kim et al., 2005). The tailing is transferred to nearby agricultural lands, and hence contaminates the soil by weathering process and runoff. The ground water is also polluted through ditches side with acid mining drainages (AMD) during heavy rain (Liu et al., 2010). The tailing
and waste rocks generated from mining activity contain the toxic heavy metals, and are potentially significant sources to deteriorate the agro-ecosystem in the vicinity of abandoned mining district (Garcia-Sanchez and Alvarez-Ayuso, 2003).
Among toxic heavy metals, arsenic (As) is well known as a non-threshold human carcinogen at low level exposure, and seriously cause the detrimental effect to mammals especially skin, lung, kidney, and liver etc. (IARC, 2004). The human exposure of As can be occurred through various pathways, such as ingestion of drinking water, food, soil, soil dermal contact, and inhalation of air particulates (Chatterjee et
al., 2010). The chronic As exposure via drinking water with greater As amount than 50 µg/L in mine area has been led to serious health risk to residents, such as the skin manifestations, respiratory disease, gastro-intestinal, liver, and cardiovascular complicates, including cancer (Sharma and Sohn, 2009). The As-enriched soil and ground water are translocated to crops, and accumulated within plants as well as animals (Alam et al., 2002;
Huang et al., 2007; William et al., 2007; Ma et al., 2008). The paddy fields impacted by As-enriched soil and ground water yield the rice with a high As content at 7.5 mg/kg (Liao et al., 2005). The crop cultivation or food preparation from As-contaminated soil and ground water has been suggested to be a major As exposure to human (Meharg and Rahman, 2003; Rahman et al., 2006). Particularly, the rice has been recognized as a significant dietary source of inorganic As, due to significant accumulation (Heikens, 2006). Thus it may become a critical problem for human health in Asian developing countries, where the rice is highly consumed as a staple diet (Hang et al., 2009). The most significant pathway of As exposure is considered through ingestion of rice and drinking water (Mondal and Polya, 2008).
The consumption of rice cultivated nearby mines may also pose a potential health risk for residents. The health risk posed as human As exposure depends on its concentration in exposed media, ingested amounts, and exposure duration (Lee et al., 2005). The developmental and physiological differences among population vary the degree of the human As exposure followed by digestion, absorption, and subsequently metabolism (Tsuji et al., 2004). To assess both cancer and non-cancer health risks of As exposure, the probabilistic risk assessment has been conducted to reduce the uncertainty and variability of input parameter for a selected probability distribution (Mondal and Polya, 2008). The health risk assessment via As exposure routes may be beneficial to set a remediation priority in abandoned mining area, Korea. Therefore, there is a need to accurately characterize the human health risk via exposure routes of As contamination nearby abandoned mines.
The objectives of the present study were to estimate the contribution to human exposure for As, and to estimate potential health risk associated with estimated As exposure via exposure pathway. Risk-based target cleanup level by As exposure routes was determined, and compared with As contamination in soil, ground
water, and rice around abandoned mining sites.
Materials and Methods
Sampling The ten sites (e.g. SD, CY, NS, JA, IA, DD, DH, MB, KK, DI) was selected based on the abandoned mines to need the soil remediation, due to high contamination of toxic elements (MOE, 2008).
Those were characterized by the large amount of tailings, waste rocks 10~200,000 m3, and mine water (MOE, 2008). The NS, JA, IA, DD, KK sites are mainly originated from Au-Ag bearing quartz vein type. Besides, the CY, DH, MB, and DI are mined with mineral types of Mo, Cu, Pb, and Fe, respectively. Soil, ground water, and rice samples were collected within 100 ~ 1,000 m distance from each mining site in November 2009. Soil and rice samples were collected in paddy fields located near ten abandoned mines. All soil samples comprised the three ~ six subsamples taken within a depth of 15 cm from the surface in each mine site. The groundwater samples were taken along with downstream from the mines. All samples were contained into polyethylene bags as well as plastic bottle, transported to laboratory immediately, and then stored at 4°C for ground water samples.
Soil property measurement pH value was measured at the ratio of 1:5 in soil to distilled water using pH meter (Orion, Thermo Scientific, USA). Organic matter and available phosphate were determined by a wet oxidation method and Lancaster method, respectively.
The exchangeable cations were determined with 1 N ammonium acetate at pH 7.0. Physico-chemical properties of soil around ten mines were characterized in Table 1.
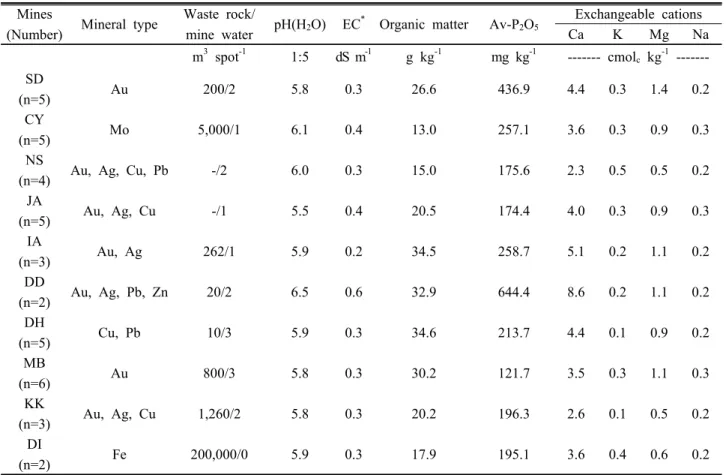
The pH, electrical conductivity, organic matter, and available phosphate were in the range of 5.8 ~ 6.5, 0.2
~ 0.6 dS m-1, 13.0 ~ 34.6 g kg-1, 121.7 ~ 644.4 mg kg-1, respectively. The exchangeable Ca was ranged from 2.3 to 8.6 cmolc kg-1, which was approximately 5 ~10 times higher than those for K, Mg, and Na.
Sample preparation and analysis Soil samples were air-dried, crushed, and passed through a 20 mesh sieve.
Dilute-acid extractable As was determined by a procedure described in Korean soil standard method (MOE, 2001;
NIAST, 2000). The ten grams of soil samples were added into 100 mL flask containing 1 N HCl, continuously
Table 1. Physico-chemical properties of soil in the vicinity of abandoned mines.
Mines
(Number) Mineral type Waste rock/
mine water pH(H2O) EC* Organic matter Av-P2O5 Exchangeable cations
Ca K Mg Na
m3 spot-1 1:5 dS m-1 g kg-1 mg kg-1 --- cmolc kg-1 --- SD
(n=5) Au 200/2 5.8 0.3 26.6 436.9 4.4 0.3 1.4 0.2
CY
(n=5) Mo 5,000/1 6.1 0.4 13.0 257.1 3.6 0.3 0.9 0.3
NS
(n=4) Au, Ag, Cu, Pb -/2 6.0 0.3 15.0 175.6 2.3 0.5 0.5 0.2
JA
(n=5) Au, Ag, Cu -/1 5.5 0.4 20.5 174.4 4.0 0.3 0.9 0.3
IA
(n=3) Au, Ag 262/1 5.9 0.2 34.5 258.7 5.1 0.2 1.1 0.2
DD
(n=2) Au, Ag, Pb, Zn 20/2 6.5 0.6 32.9 644.4 8.6 0.2 1.1 0.2
DH
(n=5) Cu, Pb 10/3 5.9 0.3 34.6 213.7 4.4 0.1 0.9 0.2
MB
(n=6) Au 800/3 5.8 0.3 30.2 121.7 3.5 0.3 1.1 0.3
KK
(n=3) Au, Ag, Cu 1,260/2 5.8 0.3 20.2 196.3 2.6 0.1 0.5 0.2
DI
(n=2) Fe 200,000/0 5.9 0.3 17.9 195.1 3.6 0.4 0.6 0.2
*Electrical conductivity.
shaken at 30°C for 1 h, and then filtered with Whatman No. 5B filter. After that, the extractable As were analyzed by ICP-AES (Integra XL Dual, GBC, Australia) followed by the hydride generator. The total As contents in ground water and rice samples were determined by ICP-MS (Agilent technologies, 7500a). The groundwater samples were filtered with 0.45 μm membrane filter and then acidified with 70% HNO3. The harvested rice samples were air-dried, polished with white rice, and then pulverized with a homogenizer. The rice samples of 0.5 g transferred into high pressured-polytetrafluoroethylene (PTFE) vessel were digested with 8 mL 70% HNO3 and 1 mL H2O2 (Sigma, USA) using microwave digestion system (ETHOS, Milestone, Italy). After cooling at room temperature, extracts were filtered with 0.45 μm membrane filter, and adjusted to a final volume of 25 mL.
Estimated human As exposure The average daily dose (ADD) of As compound was estimated by Monte Carlo simulation as a probabilistic approach. The published input parameters were used to determine the ADD values via human exposure pathways such as inadvertent soil ingestion, soil dermal contact, ground
water ingestion, and rice intake by the following equation (MOE, 2009).
ADD via inadvertent soil ingestion (mg kg-1-day) =
AT W
ED EF FI CF IR C
AB s s
s
×
×
×
×
×
×
(1)
Where, C is the extractable As conc. in soil (mg kgs -1);
IR is the soil ingestion rate (mg days -1); FI is the absorption factor for inadvertent soil ingestion (unitless;
1). CF is the conversion factor (10-6 kg mg-1)
ADD via soil dermal contact (mg kg-1-days) =
W AT
ED EF ABS AF SA CF C
AB
d e
s
×
×
×
×
×
×
×
(2)
Where, C is the extractable As conc. in soil (mg kgs -1);
SA is the exposed surface area (cme 2); AF is the adsorption factor between soil and skin (mg cm-2);
ABS is the skin absorption constant for As (unitless; d
0.03); CF is the conversion factor (10-6 kg mg-1).
ADD via ground water ingestion (mg kg-1-days) =
AT W
ED EF IR C
AB w w
×
×
×
×
(3)
Where, Cw is total As conc. in ground water (mg/L);
IR is the ground water ingestion rate (L/day).w
ADD via rice intake (mg kg-1-days) =
W AT
ED EF FI IR P C
AB r r Asi r
×
×
×
×
×
×
(4)
Where, Cr is total As conc. in polished rice (mg kg-1);
pAsi is the proportion of inorganic As in rice (%); IRr is
the rice ingestion rate (kg person-1 day-1); FIr is absorption factor for rice intake (unitless;1); EF is exposure frequency (days year-1); ED is the exposure duration (years); W is the average body weight of exposed AB
person (kg); AT is the average time of the exposed person (years).
The exposure duration is recommended for the 70 years for carcinogens and 30 years as a reasonable maximum exposure for non-carcinogens, assuming the lifetime exposure and 95% upper value of dwelling period at one place (An et al., 2007). The average body weight and lifetime expectancy were provided by the fourth Korea National Health and Nutrition Examination Survey (KCDCP, 2008), and life table (KNSO, 2005).
The input parameters used in health risk assessment are listed in Table 1. Probabilistic risk assessment was conducted by assuming probability distributions of input parameters using commercially available software Crystal ball 11.1.0 ver. (Colorado, Denver, USA). A proportion of inorganic As (Asi) to total As level was averagely 57.4 % based on preliminary study (Paik et al., 2010).
The substitution of total As content with bioavailable inorganic As concentration is more realistic to determine the health risk (Heikens, 2006).
Health risk characterization The health risk for As compound is associated with both cancer and non-cancer toxic effect (Mondal and Polya, 2008). Based on ADD value through human As exposure pathways, the health risk was estimated at mean and 95th percentile values.
The carcinogenic risk probability (R) represents the possibility causing the cancer due to lifetime exposure for As, and is acceptable within 10-6 ~ 10-4 for regulatory purpose (Kolluru et al., 1996). The R values were
calculated by the following equation (5).
) exp(
1 SF ADD
R= − − × (5)
Where R is the cancer risk probability; SF is oral cancer slope factor 1.5 (mg kg-1)/day, ADD is the estimated average daily dose via each As exposure pathway (mg kg-1-day).
The toxic effects for non-carcinogens indicate hazard quotient (HQ), which is assessed by comparing between estimated ADD values via human As exposure routes and a reference dose (RfD) calculated from following equation (6).
RfD HQ= ADD
(6)
Where HQ is the hazard quotient; RfD is the oral reference dose value (3×10⁻⁴ mg kg-1-day) derived from skin hyperpigmentation and keratosis and potential vascular effects (US EPA, 1998).
When population was exposed via several pathways for As, the hazard index (HI) is calculated by summing the HQ value to estimate the overall toxic effects for As exposure.
∑
= HQi
HI i=1 n.... . (7)
Target cleanup level The target cleanup levels (TCL) values for target cancer risk and target hazard quotient (THQ) via exposure pathway were calculated by the equation described in soil risk assessment guideline (MOE, 2009). If risk-based TCL value was higher than As contaminants in environmental media nearby abandoned mines, environmental problem surrounding mines may be occurred, and therefore requires the urgent remedial action.
Results and Discussion
As contaminants The average values of Arsenic levels in soil, ground water, and polished rice taken nearby ten abandoned mines were in the ranged of 0.08 ~17.29 mg kg-1, 0.1 ~ 60 μg L-1, and 0.01 ~ 0.13 mg kg-1, respectively. As contaminants in soil were similar to those in soil (n=600) nearby abandoned mines, with a
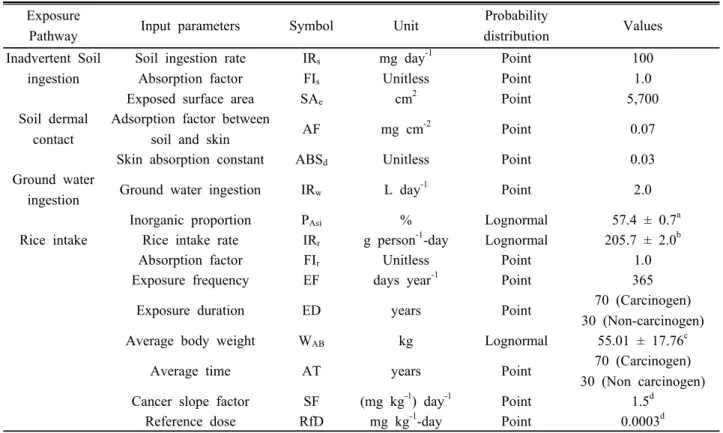
Table 2. The input parameters by arsenic exposure pathways and dose response assessment for arsenic.
Exposure
Pathway Input parameters Symbol Unit Probability
distribution Values Inadvertent Soil
ingestion
Soil ingestion rate IRs mg day-1 Point 100
Absorption factor FIs Unitless Point 1.0
Soil dermal contact
Exposed surface area SAe cm2 Point 5,700
Adsorption factor between
soil and skin AF mg cm-2 Point 0.07
Skin absorption constant ABSd Unitless Point 0.03
Ground water
ingestion Ground water ingestion IRw L day-1 Point 2.0
Rice intake
Inorganic proportion PAsi % Lognormal 57.4 ± 0.7a
Rice intake rate IRr g person-1-day Lognormal 205.7 ± 2.0b
Absorption factor FIr Unitless Point 1.0
Exposure frequency EF days year-1 Point 365
Exposure duration ED years Point 70 (Carcinogen)
30 (Non-carcinogen)
Average body weight WAB kg Lognormal 55.01 ± 17.76c
Average time AT years Point 70 (Carcinogen)
30 (Non carcinogen)
Cancer slope factor SF (mg kg-1) day-1 Point 1.5d
Reference dose RfD mg kg-1-day Point 0.0003d
Source: MOE (2009), aPaik et al.(2010) bKNHANES III (2005) cKNHANES IV-2 (2008) dUS EPA (1998).
range of 1.88 ~ 8.06 mg kg-1 (RDA, 2006; 2008). The As contaminants in JA and MB mines exceeded the extractable As guideline of 6 mg kg-1 (MOE, 1996).
However, those were not exceeded the concern guideline (25 mg kg-1) as well as countermeasure guideline (75 mg kg-1) based on total As contents (MOE, 2009). Besides, a maximum As concentration of 53.54 mg kg-1 was observed in MB site, which exceeded the soil contamination concern guideline. Lee et al. (2005) reported that the MB mine showed the maximum As concentration of 72.1 mg kg-1 in agricultural soil. On the contrary, the average concentration of As in KK mine was the lowest with 0.08 mg kg-1, which was similar to natural back- ground concentration in soil (KEI, 2004).
The SD, NS, and MB sites showed the much higher As level in ground water than other mines. Particularly, significantly exceeding level for ground water guideline (0.05 mg L-1) in Korea was observed in NS mine. When compared with drinking water guideline of 0.01 mg L-1, the As levels in three mining sites exceeded. If ground water discharged from three mines is used for drinking water, the adverse toxic effects may be occurred on residents.
The average As concentrations in polished rice were
in the range of 0.01 ~ 0.13 mg kg-1. The maximum concentration of As in MB mine was 0.34 mg kg-1, which was an approximately 2 ~ 10 times higher than other mining sites. Lee et al. (2008) reported that this site was highly As-contaminated district in the range of 0.24 ~ 0.72 mg kg-1 with an average value of 0.41 mg kg-1. Besides, those values exceeded the globally normal As levels of 0.082 ~ 0.202 mg kg-1 in polished rice (Zavala and Duxbury, 2008). When compared with a maximum As concentration range of 0.24 ~ 0.26 mg kg-1 (Qian et al., 2010), the slightly higher As concentration was observed in MB site. Such level was as high as that in rice impacted by As-contaminated soil and irrigation water in Bangladesh (Alam et al, 2002). In MB site, the higher As levels in soil were observed, exceeding concern and countermeasure guideline (MOE, 2009).
This may be resulted in increased As contaminants in polished rice. Our results are convinced by the previous study that a paddy soil contaminated with a high As level, nearby abandoned mines increases the As content in rice grains (Huang et al., 2007). Zhu et al. (2008) reported that As-contaminated soil and irrigated water are accumulated to the rice with a high As level, probably due to increased bioavailability of As from rice root.
Fig. 1. The average daily dose (ADD) via arsenic exposure pathways in soil, ground water, and polished rice nearby ten abandoned mines. ADD values in each mine were plotted as 50th percentile, Mean, and 95th percentile, respectively.
Fig. 2. Contribution (%) to human arsenic exposure in soil, ground water, and polished rice near ten abandoned mines.
Estimated human As exposure The estimated average daily dose (ADD) values via arsenic exposure pathways were depicted in Fig. 1. In sensitive analysis, the As concentration dominantly contributed to estimate the ADD value, which ADD value increased in highly As-contaminated mine. The ADD estimations at mean value were in the range of 1.61 × 10⁻⁷ ~ 3.50 × 10⁻⁵ mg kg-1-day via inadvertent soil ingestion, and 1.93 × 10⁻⁸ ~ 4.19 × 10⁻⁶ mg kg-1-day via soil dermal contact, respectively.
Particularly, the greatest ADD values via soil exposure pathway were observed in MB mine. These results showed the similar pattern to those via rice intake, which was estimated as greater in MB site. This implied that the As contents in paddy soil transferred into rice root, and hence resulted in accumulation to rice grain.
The ADD values via rice intake were in the range of 2.35 × 10⁻⁵ ~ 3.07 × 10⁻⁴ mg kg-1-day, which significantly greater than those via inadvertent soil ingestion and soil dermal contact. However, estimated ADD values were well below provisional tolerable daily intake (PTDI) of 2.1 Asi μg kg-1 bw day-1 (WHO, 1989).
The bioavailability associated with adsorption factor is also important to assess the health risk. Juhasz et al.
(2006) reported that bioavailability in rice was 103.9 ± 25.8 % for As (III) and 92.5 ± 22.3 % for As (V), which
is approximately three times greater than that for organic As. In this study, the proportion of inorganic As content in rice was included in estimating the ADD value. Paik et al. (2010) reported that the portion of Asi to total As content was 57.4 ± 0.7% in polished rice nearby abandoned mining districts. The proportion of Asi in rice vary from 10 to 90% depending on cultivar and growing environ- mental condition (William et al., 2005). The average Asi proportions in rice cultivated in paddy soil affected by mining activity was as high as 83%, and its ADD value was estimated to be 3.8 Asi μg kg-1 bw day-1 (Zhu et al.,
Table 3. Cancer risk estimation via arsenic exposure pathways around abandoned mines.
Mines Soil ingestion Soil dermal contact Ground water ingestion Rice intake Mean 95th percentile Mean 95th percentile Mean 95th percentile Mean 95th percentile SD 4.7×10⁻⁶ 1.1×10⁻⁵ 5.6×10⁻⁷ 1.3×10⁻⁶ 1.2×10⁻³ 3.7×10⁻³ 4.6×10⁻⁴ 8.3×10⁻⁴ CY 3.5×10⁻⁶ 9.9×10⁻⁶ 4.2×10⁻⁷ 1.2×10⁻⁶ 1.2×10⁻⁴ 2.6×10⁻⁴ 2.1×10⁻⁴ 4.5×10⁻⁴ NS 1.8×10⁻⁵ 3.7×10⁻⁵ 2.1×10⁻⁶ 4.4×10⁻⁶ 3.6×10⁻³ 1.2×10⁻² 3.6×10⁻⁴ 6.2×10⁻⁴ JA 2.2×10⁻⁵ 4.4×10⁻⁵ 2.6×10⁻⁶ 5.4×10⁻⁶ 1.8×10⁻⁴ 4.4×10⁻⁴ 2.8×10⁻⁴ 7.7×10⁻⁴ IA 2.4×10⁻⁶ 5.1×10⁻⁶ 2.9×10⁻⁷ 6.1×10⁻⁷ 1.8×10⁻⁴ 5.1×10⁻⁴ 3.6×10⁻⁴ 8.8×10⁻⁴ DD 1.7×10⁻⁶ 3.0×10⁻⁶ 2.1×10⁻⁷ 3.6×10⁻⁷ 5.9×10⁻⁶ 1.7×10⁻⁵ 2.9×10⁻⁴ 5.1×10⁻⁴ DH 3.9×10⁻⁶ 1.0×10⁻⁵ 4.7×10⁻⁷ 1.3×10⁻⁶ 5.5×10⁻⁵ 1.5×10⁻⁴ 2.1×10⁻⁴ 3.5×10-4 MB 5.4×10⁻⁵ 1.7×10⁻⁴ 6.3×10⁻⁶ 1.9×10⁻⁵ 1.2×10⁻³ 3.6×10⁻³ 4.6×10⁻⁴ 1.3×10⁻³ KK 2.4×10⁻⁷ 7.4×10⁻⁷ 2.9×10⁻⁸ 8.9×10⁻⁸ 3.1×10⁻⁵ 8.0×10⁻⁵ 1.4×10⁻⁴ 3.6×10⁻⁴ DI 2.0×10⁻⁶ 6.4×10⁻⁶ 2.4×10⁻⁷ 7.8×10⁻⁷ 1.2×10⁻⁴ 3.5×10⁻⁴ 3.6×10⁻⁵ 1.3×10⁻⁴
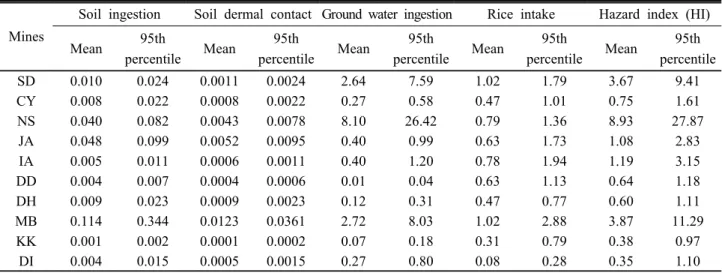
Table 4. Hazard quotient (HQ) and hazard index (HI) via arsenic exposure pathways nearby abandoned mines.
Mines
Soil ingestion Soil dermal contact Ground water ingestion Rice intake Hazard index (HI)
Mean 95th
percentile Mean 95th
percentile Mean 95th
percentile Mean 95th
percentile Mean 95th percentile
SD 0.010 0.024 0.0011 0.0024 2.64 7.59 1.02 1.79 3.67 9.41
CY 0.008 0.022 0.0008 0.0022 0.27 0.58 0.47 1.01 0.75 1.61
NS 0.040 0.082 0.0043 0.0078 8.10 26.42 0.79 1.36 8.93 27.87
JA 0.048 0.099 0.0052 0.0095 0.40 0.99 0.63 1.73 1.08 2.83
IA 0.005 0.011 0.0006 0.0011 0.40 1.20 0.78 1.94 1.19 3.15
DD 0.004 0.007 0.0004 0.0006 0.01 0.04 0.63 1.13 0.64 1.18
DH 0.009 0.023 0.0009 0.0023 0.12 0.31 0.47 0.77 0.60 1.11
MB 0.114 0.344 0.0123 0.0361 2.72 8.03 1.02 2.88 3.87 11.29
KK 0.001 0.002 0.0001 0.0002 0.07 0.18 0.31 0.79 0.38 0.97
DI 0.004 0.015 0.0005 0.0015 0.27 0.80 0.08 0.28 0.35 1.10
2008a), which was greater than PTDI of 2.1 Asi μg kg-1 bw day-1 (FAO/WHO, 1989). On the contrary, the ADD values via ground water ingestion were ranged from 4.10 × 10⁻⁶ to 2.39 × 10⁻³ mg kg-1-day, which showed the different pattern from other exposure routes. The large amount of As exposure at mean and 95th percentile levels were evaluated in NS mine.
Based on ADD results, we investigated which exposure pathway greatly contributed to human As exposure in abandoned mines selected in this study (Fig. 2). The contribution of the ADD value through inadvertent soil ingestion, soil dermal contact, ground water ingestion and rice intake was averagely 1.15%, 0.14%, 69.65%, and 29.06%, respectively. This indicated that the As exposure for population mainly occurred via intake of ground water as well as rice, of which ingestion of ground water highly was contributed to human As exposure. This is probably due to greater ingestion rate of ground water than that of rice.
Potential human health risk The carcinogenic risk probability (R) and hazard quotient (HQ) were assessed via inadvertent soil ingestion, soil dermal contact, ground water ingestion, and rice intake (Table 3, 4). The R values were in the range of 2.4 ×10⁻⁷ ~5.4 ×10⁻⁵ via inadvertent soil ingestion, 2.9 ×10⁻⁸ ~6.3 ×10⁻⁶ via soil dermal contact, 5.9 ×10⁻⁶ ~3.6 ×10⁻³ via ground water ingestion, and 3.6 ×10⁻⁵ ~4.6 ×10⁻⁴ via rice intake on the basis of mean value. All mines except for KK mine via inadvertent soil ingestion exceeded the acceptable cancer risk of 1 in 1000,000 ~ 10,000 for regulatory purpose (Kolluru et al., 1996). The R values occurred through inadvertent soil ingestion and soil dermal contact were estimated as the lowest values of 2.4 ×10⁻⁷ and 2.9
×10-8 in KK mine, however the highest values of 5.4
×10-5 and 6.3 ×10⁻⁶ in MB mine. This implied that it was preferentially necessary to remediate the paddy soil in the vicinity of MB mine.
Cancer risk estimation via ingestion of ground water
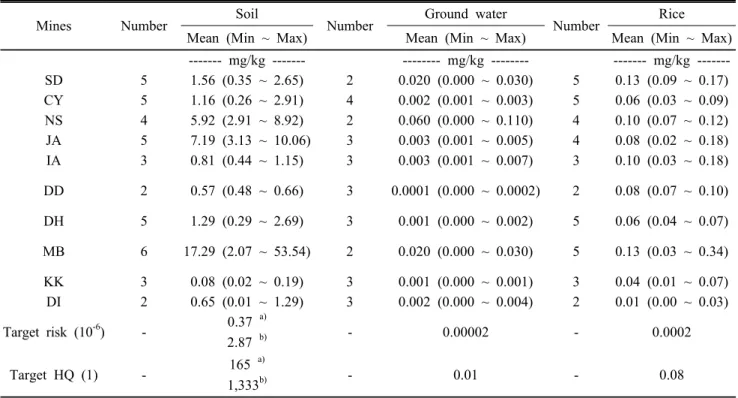
Table 5. Arsenic contaminations in soil, ground water, and polished rice around abandoned mines and risk-based target cleanup level by As exposure pathways.
Mines Number Soil
Number Ground water
Number Rice
Mean (Min ~ Max) Mean (Min ~ Max) Mean (Min ~ Max)
--- mg/kg --- --- mg/kg --- --- mg/kg ---
SD 5 1.56 (0.35 ~ 2.65) 2 0.020 (0.000 ~ 0.030) 5 0.13 (0.09 ~ 0.17)
CY 5 1.16 (0.26 ~ 2.91) 4 0.002 (0.001 ~ 0.003) 5 0.06 (0.03 ~ 0.09)
NS 4 5.92 (2.91 ~ 8.92) 2 0.060 (0.000 ~ 0.110) 4 0.10 (0.07 ~ 0.12)
JA 5 7.19 (3.13 ~ 10.06) 3 0.003 (0.001 ~ 0.005) 4 0.08 (0.02 ~ 0.18)
IA 3 0.81 (0.44 ~ 1.15) 3 0.003 (0.001 ~ 0.007) 3 0.10 (0.03 ~ 0.18)
DD 2 0.57 (0.48 ~ 0.66) 3 0.0001 (0.000 ~ 0.0002) 2 0.08 (0.07 ~ 0.10)
DH 5 1.29 (0.29 ~ 2.69) 3 0.001 (0.000 ~ 0.002) 5 0.06 (0.04 ~ 0.07)
MB 6 17.29 (2.07 ~ 53.54) 2 0.020 (0.000 ~ 0.030) 5 0.13 (0.03 ~ 0.34)
KK 3 0.08 (0.02 ~ 0.19) 3 0.001 (0.000 ~ 0.001) 3 0.04 (0.01 ~ 0.07)
DI 2 0.65 (0.01 ~ 1.29) 3 0.002 (0.000 ~ 0.004) 2 0.01 (0.00 ~ 0.03)
Target risk (10-6) - 0.37 a)
2.87 b) - 0.00002 - 0.0002
Target HQ (1) - 165 a)
1,333b) - 0.01 - 0.08
a)soil ingestion pathway, b)soil dermal contact pathway.
and rice was also over the acceptable cancer risk in all mines. The cancer risk probability via ground water and rice intake was approximately two orders of magnitude greater than that via soil pathways. The R value through rice intake in MB mine was estimated to be highest with 4.6 ×10⁻⁴. The cancer risk probability occurred via soil pathways was high in MB mine, which likewise resulted in increased cancer risk via rice intake. When it assumes that population continuously consume the rice grain affected by As-contaminated paddy soil, the probability occurring cancer can be increased. The greater cancer risk probability above 1 in 10,000 was assessed via rice intake in all mines except for DI mine. The different pattern was shown in cancer risk probability via ground water ingestion, which was the highest with 3.6 ×10⁻³ in NS mine. However, the potential cancer risk occurring via rice intake in MB mine was as high as above 1 in 1,000. The DD mine showed the cancer risk of above 1 in 1000,000 even with lowest R value. When population drink the ground water contaminated with a high As level, the probability occurring cancer risk may be highly increased. The R values at 95th percentile via ground water and rice intake exceeded the cancer risk of the 1.0 × 10⁻⁵ in all mines.
The toxic risk associated with As exposure pathways
were assessed by the HQ and HI values (Table 4). The HQ values were in the range of 0.001 ~ 0.114 and 0.0001 ~ 0.0123 through inadvertent soil ingestion and soil dermal contact, which overall did not exceed the 1.0. These results implied that the exposed population may be considered to be safe for non-carcinogenic toxic effects, assuming only soil exposure routes. In the same manner to cancer risk probability, the HQ value was estimated to be highest in MB mine.
The HQ values assessed by As exposure via ground water ingestion were beyond 1.0, which was 2.64 in SD mine, 8.10 in NS mine, and 2.72 in MB mine, respectively. Particularly, HQ value at 95th percentile was the highest with 26.42 in NS mine, much more exceeding 1.0. When the ground water discharged from three mines was used for drinking water, the non-cancer toxic effects may be caused by the exposed population.
The HQ values via rice intake were also over 1.0 in SD and MB mines. The MB mine showed the high HQ value exceeding 1.0 via As exposure pathways, which demonstrates that As contaminants generated from MB mines might cause the toxic effects. Under same mine, the HQ values estimated from ground water and rice intake were much greater than those via soil exposure pathways. It demonstrated that the non-carcinogenic
toxic effects due to ground water and rice intake were more likely to occur than those through soil dermal contact and inadvertent ingestion.
The hazard index (HI) summed up HQ value via As exposure routes showed the highest value (e.g. 8.93) in NS mine, which showed the major contribution to ground water ingestion. The mean HI values in SD and MB mines were 3.67 and 3.87 exceeding 1.0. This indicated that there was a chance to cause the non-carcinogenic toxic risk, assuming As exposure for population via multi-pathways. The HI values at 95th percentile were above 1.0 in all mines. The HI values greater than 1.0 were assessed from JA and IA mines, considering multi-exposure routes of As. However, the toxic effects from both mines were not caused by individual exposure route. This study demonstrated that toxic effects should be estimated considering human exposure via multi- pathways of As.
The risk-based target cleanup levels (TCL) via As exposure routes were calculated by the equation described in soil risk assessment guideline (MOE, 2009). TCL values were determined by setting the target risks for carcinogens and non-carcinogens via As exposure pathways (Table 5). When the target cancer risk of 10-6 was set in each exposure pathway, the risk-based TCL values were 0.37 (via inadvertent soil ingestion), 2.87 (via soil dermal contact), 0.00002 (ground water ingestion), and 0.0002 (rice intake), respectively. Only KK mine did not exceed the TCL level via inadvertent soil ingestion. The As contaminants in soil of NS, JA, and MB mines exceeded the TCL values through soil dermal contact. Besides, the As concentrations found in ground water as well as rice were above the TCL value in all mines.
When setting the 1.0 as a target HQ (THQ) for non- carcinogens, TCL values via inadvertent soil ingestion and dermal contact were 165 and 1,333, which was greatly higher than As contaminants in soil of all mines.
However, the As levels in ground water of SD, NS, and MB mines was slightly greater than TCL values. The As concentrations in polished rice near SD, NS, IA, and MB mines exceeded the TCL value of 0.08, determined via rice intake. The abandoned mines exceeding TCL value based on risk assessment suggests the urgent action to remediate soil environments.
Conclusion
This study assessed the health risk associated with human As exposure by soil, ground water, and polished rice nearby abandoned mines and provided a target cleanup level (TCL). Among other exposure pathways, the ground water ingestion was predominantly contributed to human As exposure. Cancer risk probability occurred via ground water and rice intake exceeded the acceptable cancer risk of 10-6 ~ 10-4 in all mines. Particularly, the greatest cancer risk probability was estimated from MB mine. The HQ values via ground water and rice intake exceeded the 1.0 in SD, NS, and MB mines. This demonstrates that the non-carcinogenic toxic effects due to ground water and rice intake were more likely to occur than those through soil exposure routes. The HI values in SD, NS, JA, and IA mines were over 1.0, particularly had the greatest value in NS mine, which showed the major contribution to ground water ingestion.
Toxic effects in JA and IA mines were beyond 1.0, considering multi-exposure routes. Through ground water and rice intake, the As contaminants in all mines exceeded the TCL values for target cancer risk (10-6).
However, the As levels in soil were greater than the TCL value for target cancer risk via inadvertent soil ingestion, except for KK mine. For TCL values for THQ, the As contaminants in soil did not exceed the TCL value. On the contrary, the As levels in ground water and polished rice in SD, NS, IA, and MB mines were also beyond the TCL values via ground water and rice intake. This study concluded that greater health risks were assessed through ground water and rice intake than those via inadvertent soil ingestion and soil dermal contact. In addition it suggests that the abandoned mines to exceed the risk-based TCL values are carefully necessary to monitor for soil remediation.
Acknowledgements
This study was supported by 2011 Post Doctoral Course Program of National Academy of Agricultural Science, Rural Development Administration, Republic of Korea.
References
Alam, M.G., G. Allison, F. Stagnitti, A. Tanaka, and M.
Westbrook. 2002. Metal concentrations in rice and pulses of Samta villiage, Bagladesh. Bull. Environ. Contam.
Toxicol. 69:323-329.
An, Y.J. and W.M. Lee. 2007. Comparative study on exposure factors for risk assessment in contaminated lands and proposed exposure factors in Korea. Korean Sco. Soil groundwater Environ. 12:64-72.
Chatterjee, D., D. Halder, M. Santanu, A. Biswas, B. Nath, P.
Bhattacharya, S. Bhowmick, A. Mukherjee-Goswami, D.
Saha, R. Hazra, P.B. Maity, D. Chatterjee, A. Mukherjee, and J. Bundschuh. 2010. Assessment of arsenic exposure from groundwater and rice in Bengal Delta Region, West Bengal, India. Wat. Res. 44:5803-5812.
Garcia-Sanchez, A. and E. Alvarez-Ayuso. 2003. Arsenic in soils and waters and its relation to geology and mining activities (Salamanca Province, Spain). J. Geochem. Explor.
80:69-79.
Hang, X., H. Wang, J. Zhou, C. Ma, C. Du, and X. Chen.
2009. Risk assessment of potentially toxic element pollution in soils and rice (Oryza sativa) in a typical area of the Yangtze River Delta. Environ. Pollut. 157:2542-2549.
Heinken, A. 2006. Arsenic contamination of irrigation water, soil and crops in Bagladesh: Risk implications for sustainable agriculture and food safety in Asia. Food and Agricultural Organization of the United Nations, Regional office for Asia and the Pacific.
Huang, S.S., Q.L. Liao, and M. Hua. 2007. Survey of heavy metal pollution and assessment of agricultural soil in Yangzhong district, Jiangsu Province, China. Chemosphere 67:2148-2155.
IARC (International Agency for Research on Cancer). 2004.
Some drinking water disinfectants and contaminants, including arsenic; IARC Monographs on the evaluation of carcinogenic risks to humans vol. 84. IARC Press, Lyon.
Juhasz, A.L., E. Smith, J. Weber, M. Rees, A. Rofe, T. Kuchel, and L. Sansom. 2006. In vivo assessment of arsenic bioavailability in rice and its significance for human health risk assessment. Environ. Health Perspect.114:1826-1831.
Kim, J.Y., K.Y. Kim, J.S. Ahn, I.W. Ko, and C.H. Lee. 2005.
Investigation and risk assessment modeling of As and other heavy metals contamination around five abandoned metal mines in Korea. Environ. Geochem. Health. 27:193-203.
Kolluru, R.V., S.M. Bartell, R.M. Pitblado, and R.S. Stricoff.
1996. Risk assessment and management handbook. MacGrow- Hill, New York.
Lee, J.S., S.W. Lee, H.T. Chon, and K.W. Kim. 2008.
Evaluaiton of human exposure to arsenic due to rice ingestion in the vicinity of abandoned Myungbong Au-Ag mine site, Korea. J. Geochem. Explor. 96:231-235.
Liao, X.Y., T.B. Chen, H. Xie, and Y.R. Liu. 2005. Soil As contamination and its risk assessment in areas near the industrial districts of Chenzhou City, Southern China.
Environ. Int. 31:791-798.
Liu, C.P., C.L. Luo, Y. Gao, F.B. Li, L.W. Lin, C.A. Wu, and X.D. Li. 2010. Arsenic contamination and potential health risk implications at an abandoned tungsten mine, Southern China. Environ. Pollut. 158:820-826.
Meharg, A.A. and M. Rahman. 2003. Arsenic contamination of Bagladesh paddy field soils: Implications for rice contribution to arsenic consumption. Envrion. Sci. Tehcnol.
37:229-234.
Mondal, D. and D. Polya. 2008. Rice in a major exposure route for arsenic in Chakdaha block, Nadia district, West Bengal, India: A probabilistic risk assessment. Appl. Geochem.
23:2987-2998.
Paik, M.K., M.J. Kim, W.I. Kim, J.H. Yoo, B.J. Park, G.J. Im, J.E. Park, and M.K. Hong. 2010. Determination of arsenic species in polished rice using a methanol-water digestion method. J. Korean Soc. Appl. Biol. Chem. 53:634-638.
Qian, Y., C. Chen, Q. Zhang, Z. Chen, and M. Li. 2010.
Concentrations of cadmium, lead, mercury and arsenic in Chinese market milled rice and associated population health risk. Food control 21:1757-1763.
Rahman. M.A., H. Hasegawa, M.M. Rahman, and M.A.M.
Miah. 2003. Influence of cooking method on arsenic retention in cooked rice related to dietary exposure. Sci. Total. Environ.
370:51-60.
Sharma, V.K. and M. Sohn. 2009. Aquatic arsenic: Toxicity, speciation, transformation, and remediation. Environ. Int.
35:743-759.
Tsuji, J.S., R. Benson, R.A. Schoof, and G.C. Hook. 2004.
Health effect levels for risk assessment of childhood exposure to arsenic. Regul. Toxicol. Pharmacol. 39:99-110.
US EPA. 1998. Integrated Risk Information System (IRIS) (accessed January 2011).
WHO. 1989. Toxicological Evaluation of Certain Food Additives and Contaminants. Food Additives Series, No. 24. World Health Organization, Geneva.
William, P.N., A.H. Prince, A. Raab, S.A. Hossain, J. Feldmann, and A.A. Meharg. 2005. Variation in arsenic speciation and concentration in paddy rice related to dietary exposure.
Environ. Sci. Technol. 39:5531-5540.
Williams, P.N., A. Villada, C. Deacon, A. Raab, J. Figuerola, A.J. Green, J. Feldmann, and A.A. Meharg. 2007. Greatly enhanced arsenic shoot assimilation in rice leads to elevated grain levels compared to wheat and barley. Environ. Sci.
Technol. 41:6854-6859.
Zhu, Y.G., G.X. Sun, M. Lei, M. Teng, Y.X. Liu, N.C. Chen, L.H. Wang, A.M. Carey, C. Deacon, A. Raab, A.A. Meharg, and P.N. Williams. 2008a. High percentage inorganic arsenic content of mining impacted andnonimpacted Chinese rice.
Environ. Sci. Technol. 42:5008-5013.