http://dx.doi.org/10.11625/KJOA.2019.27.2.161 ISSN 2287-819X (Online)
Effect of LED Lighting Intensity on Productivity, Blood Parameters and Immune Responses in Dairy Cows *
1)
Park, Jin-Ryong
**․Belal, Shah-Ahmed
***․Na, Chong-Sam
****․Shim, Kwan-Seob
****LED 점등 세기가 젖소의 생산성, 혈액 매개변수 및 면역 반응에 미치는 영향
박진룡․샤메드․나종삼․심관섭
A light-emitting diode (LED) is most efficient in terms of economic benefits. The aim of the present study was to evaluate the effects of LED lighting intensity on milk production, milk composition, and the immune response of Holstein cows.
Thirty-eight lactating cows were assigned to four experimental groups: control group (exposed natural daylight without LED light) and three LED treatment group (50 lux; natural daylight and 6 h LED light of 50 lux intensity, 100 lux; natural daylight and 6 h LED light of 100 lux intensity, 200 lux; natural daylight and 6 h LED light of 200 lux intensity). There was a significant effect on the decrease ratio in milk production in 200 lux group. Lactose was significantly increased in 100 lux than the other LED treated groups. In addition to the hemolytic biochemical analysis, AST and β-HB were significantly increased in the 50 lux than the other groups. Prolactin and IGF-1 levels were significantly increased in 200 lux compared to other groups. Besides, cortisol was significantly higher in 50 lux and lowered in the 200 lux than the control, while IgA and IgG were not significant among the groups. Therefore, it was concluded that LED lighting intensity had some impact on blood parameters and immune responses in dairy cows with increased milk production.
Key words : blood parameters, holstein cow, immune function, LED lighting intensity, milk production
****This work was carried out with the support of “Cooperative Research Program for Agriculture Science and Technology Development (Project No. PJ01197803)” Rural Development Administration, Republic of Korea.
****Department of Animal Biotechnology, Chonbuk National University
****Department of Poultry Science, Sylhet Agricultural University, Sylhet, Bangladesh
****Corresponding author, Department of Animal Biotechnology, Chonbuk National University ([email protected], [email protected])
Ⅰ. Introduction
Diurnal cycles and light are essential for animals and birds on the earth. Due to seasonal changes, many animal species have become capable to detect and react to changes in light intensity and photoperiod durations, which influence their physiological state (Wright and Shelford, 2013). The intensity and cycle of light mostly affect the physiological state and activity of animals. Livestock industries have been continuously tried to improve production by applying lighting system to the farm. In poultry production, it is well known that lighting factors (light intensity, color and exposure time) affect the physiology and immune competence of chickens (Foss et al., 1972; Rozenboim et al., 1999; Xie et al., 2008; Blatchford et al., 2009).
In the dairy industry, photoperiod and lighting intensities are usually used for more milk production. Increased duration of photoperiod increases growth (Rius et al., 2005) and milk production (Dahl et al., 2000) in dairy heifers and lactating dairy cows respectively. Previous studies also showed that exposure of 18 h light increased the milk production than the natural daylight in lactating cows (Peters et al., 1981; Dahl et al., 1997). More exposure to light also increased the concentration of IGF-1, which stimulated milk production. Photoperiod affected the hormones i.e. melatonin and prolactin revealed the most dynamic changes. Proper photoperiod positively influences the immune system of dairy cows could have a substantial impact on the cow’s health and welfare (Auchtung et al., 2004). The cow recognizes the stimulus of light through the retina contains two types of photoreceptors, known as retinal cones and rods. There were many studies have been done on the effect of photoperiod in Holstein cows, but to our knowledge researches on the effect of exposure to LEDs lighting intensity are very rare. How cows perceive different light intensities are not yet known (Phillips et al., 2000), but it is proven that cows sight differs from human sight (Phillips and Weiguo, 1990). Therefore, the objective of this study was to evaluate the effect of LED lighting intensity on milk production, milk composition, blood parameters and immune responses of lactating Holstein cows.
Ⅱ. Materials and Methods
1. Animals and Experimental Design
The animals were cared for according to procedures approved by the Institutional Animal Care
and Use Committee, Chonbuk National University, South Korea and in accordance with the
Korean National Law on Animal Care and Use. The animals were obtained and maintained in the Gochang District, Jeollabuk Province, South Korea (35°25’ N, 126°41’ E). The cows were housed under hygienic conditions (22-24 ℃) in free stall barns. A total of 186 Holstein cows were randomly assigned to four treatments according to milk production and parity. Then we selected 40 cows passed 57 DIM at the start of experiment (approximately 91 ± 6 days in milk and parity 2.3 ± 0.2). But two cows were excluded, because having treatment during the experi- ment period. Thirty eight lactating cows were assigned to four experimental groups: control group (exposed natural daylight without LED light) and three LED treatment group (50 lux;
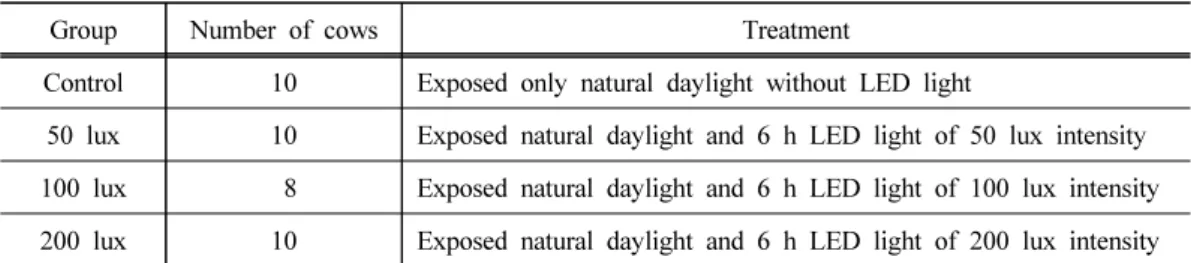
natural daylight and 6 h LED light of 50 lux intensity, 100 lux; natural daylight and 6 h LED light of 100 lux intensity, 200 lux; natural daylight and 6 h LED light of 200 lux intensity) (Table 1). This study was conducted from November 2017 to April 2018. 12 LED lights were installed at intervals of 2 m and the supplemental LEDs were adjusted for 6 h (turned on at 18:00 h and shut off at 00:00 h) at the cow`s eye level (about 2m above the ground) and controlled by an automatic timer. The cows were allowed free access to a Total Mixed Ration
Table 1. Experimental design of LED treatment
Group Number of cows Treatment
Control 10 Exposed only natural daylight without LED light
50 lux 10 Exposed natural daylight and 6 h LED light of 50 lux intensity 100 lux 8 Exposed natural daylight and 6 h LED light of 100 lux intensity 200 lux 10 Exposed natural daylight and 6 h LED light of 200 lux intensity
Table 2. Diet composition (%)
Item Value Item Value
Ingredients (%) Chemical analysis (%)
Corn silage 18.5 Moisture 32.6
Corn grain 29.2 Crude protein 11.0
Soybean meal 3.1 Crude fat 1.9
Alfalfa hay 13.8 Crude ash 14.7
Ryegrass 9.2 Crude fiber 5.9
Hay 15.4 NDF 28.0
Oat 9.1 ADF 17.2
Mineral and vitamin premix 1.6
(TMR) feed program and water (Table 2). The TMR moisture, crude protein, fat, ash and fiber were determined according to the procedures of AOAC (1990). The content of neutral detergent fiber (NDF) and acid detergent fiber (ADF) was analyzed by using an Ankom
2000Fiber Analyzer (Ankom Technology Corp., Macedon, NY, USA).
2. Milk Production and Composition
Milk production was recorded at every milking with the Lely automatic milking system (Model Astronaut A4 milking robot LH 2014, Lely Industries N.V., Maasluis, the Netherlands) and collected during one day in total, but the time and opportunities for milking were different every day and for each Holstein cow. The composition of the milk was analyzed for fat, protein, lactose, solids-not-fat (SNF), somatic-cell-count (SCC) and milk-urea-nitrogen (MUN) by using a Milko-Scan FT 500 (Foss Electric, Denmark).
3. Blood Sample Collection and Assay Procedure
Blood samples from each group (10 mL) were taken from the jugular vein, using evacuated tubes with and without EDTA on the experiment day. Both serum and plasma were harvested by centrifugation at 15,000 rpm for 15 min at 4 ℃ and stored at -20℃ until analysis. The bioche- mistry levels of the following were assayed, using an Hitachi 7180 automatic analyzer (Hitachi Ltd., Tokyo, Japan): albumin (ALB), creatinine (CRE), creatine phosphokinase (CK), guanosine triphosphate (GTP), aspartate aminotransferase (AST), alanine aminotransferase (ALT), lactate dehydrogenase (LDH), total bilirubin (T-BIL), total cholesterol (T-CHO), total protein (T-PRO), triglycerides (TG), blood urea nitrogen (BUN), non-esterified fatty acid (NEFA), as well as beta- hydroxybutyrate ( β-HB), calcium (CA), glucose (GLU), magnesium (MG), and phosphorous (PHO) in the blood.
4. Measurement of Immunoglobulin and Hormones in Blood
Immunoglobulin A (IgA) and Immunoglobulin G (IgG) were analyzed in plasma using ELISA kit (catalog no. E11-131 and E11-118, respectively; Bethyl Laboratories, Inc., Montgomery, TX).
Hormones such as prolactin in plasma was determined using ELISA kit (catalog no. EKU08580;
Biomatik, Wilmington, USA), IGF-1 in plasma was measured using ELISA kit (catalog no.
CSB-E08893b; Cusabio Biotech Co. Ltd. Wuhan, China). Cortisol in plasma was assayed using
the ELISA kit (catalog no. CSB-E13064B; Cusabio Biotech Co. Ltd. Wuhan, China).
5. Statistical Analysis
All values were expressed as the means and standard errors of the mean (SEM) and the differences among the experimental groups were statistically evaluated by Analysis of Variance (ANOVA) procedures, followed by Duncan’s Multiple Range Test for post-hoc comparisons. The milk production data were analyzed by regression analyses using the of SAS software, version 9.4 (SAS Institute Inc., Cary, NC, USA). The formula for the regression analysis used to identify determinants of milk production was as follows.
Y = aX + b
a = slope (decrease ratio), X = experimental days, b = intercept (potential milking capacity of each cow)
Ⅲ. Results and Discussion
1. Milk Production
The photoperiod and light intensity have a clear physiological response in reproduction,
growth, lactation and health in dairy cows (Dahl et al., 2012). Table 3 shows that the ratio of
milk production on dairy cows of experimental animals. The exposure of 200 lux treatment
animals significantly lowered decrease ratio of the milk production compared to 50 and 100 lux
treatment animals. Previous studies showed that the light intensity of 150 to 200 lux for 16h
could increase the milk yield when compared to less than 50 lux for 8h dark period also it
would involve in hormonals changes (Dahl and Petitclerc, 2003) Some studies have demonstrated
that different illumination intensity such as 0, 5, 10 and 50 lux could influence the milk yield
and plasma melatonin levels during the dark period, however most other studies the illumination
intensity during the dark period is referred to as darkness, and they did not specified at lux level
(Dahl et al., 1997; Miller et al., 1999; Muthuramalingam et al., 2006; Bal et al., 2008). To
stimulate milk yield, all areas of the barn require a minimum of 114 to 207 lux for 16 to 18
hours each day followed by a sustained dark period (Peters et al., 1978). Similarly, LED with
150 lux exposed cows stimulates the milk yield than compared to control (0 lux) cows (Dahl et al., 2000). Likewise, findings of our present study were accordance with the previous work (Penev et al., 2014), that the pattern of milk yield was significantly decreased in 200 lux exposed animals, that there might be IGF-influences the mammary gland to increase the milk production.
Table 3. Result of decrease ratio (slope) on milk production of experimental groups
Item
Treatment
Control 50 lux 100 lux 200 lux
Lactation slope -0.06118±0.00411
b-0.06217±0.00830
b-0.05412±0.00608
b-0.02385±0.00348
a Mean values are presented as mean ±SE.a-bMeans within a row with different superscript letters are significantly different (p<0.01)
2. Milk Composition
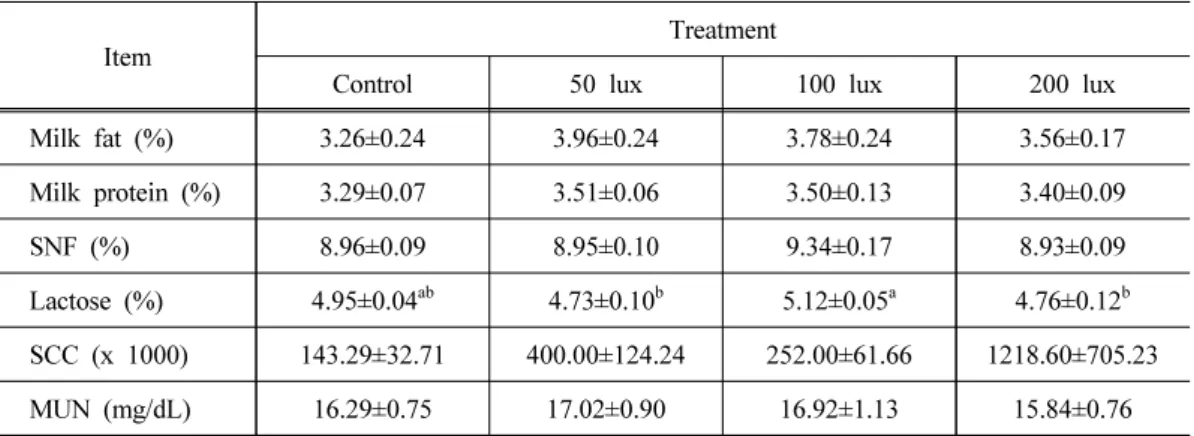
Results of milk composition of experimental animals are present in Table 4. The SNF, milk protein, MUN concentrations shoed there is no statistical difference between the experimental groups, while the lactose concentration showed statistically increased in 100 lux compared to 50 and 200 lux. A recent study has demonstrated that there was no significant difference in lactose level between the group of 24 hours of light and 4h, the light intensity was 70 to 210 lux and 20 hours of darkness was less than 3 lux (Björkegren, 2013). Our current experimental findings were positively associated with previous results that the higher percentage of lactose was in 100 lux than 50 lux and 200 lux, but the reason behind is unclear. Even though, it is possible that
Item
Treatment
Control 50 lux 100 lux 200 lux
Milk fat (%) 3.26±0.24 3.96±0.24 3.78±0.24 3.56±0.17
Milk protein (%) 3.29±0.07 3.51±0.06 3.50±0.13 3.40±0.09
SNF (%) 8.96±0.09 8.95±0.10 9.34±0.17 8.93±0.09
Lactose (%) 4.95±0.04
ab4.73±0.10
b5.12±0.05
a4.76±0.12
bSCC (x 1000) 143.29±32.71 400.00±124.24 252.00±61.66 1218.60±705.23
MUN (mg/dL) 16.29±0.75 17.02±0.90 16.92±1.13 15.84±0.76
Mean values are presented as mean ±SE.
a-bMeans within a row with different superscript letters are significantly different (p<0.05)
Table 4. Milk composition of experimental groups
lactose production in Holstein cows are sensitivity to light intensity. Ptak et al. (2012), who found that the lactose curve was very similar to the milk yield curve. However, our results showed there were no co relation between the lactose and MUN.
3. Blood Biochemical Parameter Analysis
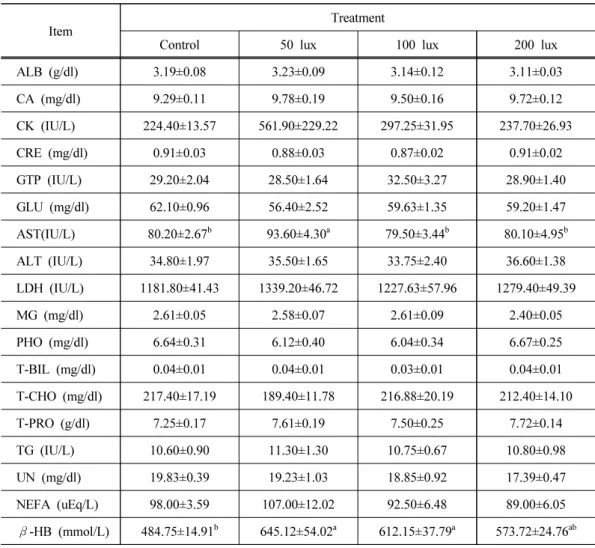
Table 5 shows the result of blood parameters such as ALB, CA, CK, CRE, GTP, GLU, AST, ALT, LDH, MG, PHO, T-BIL, T-CHO, T-PRO, TG, UN, NEFA, β-HB in blood experimental group. There were no significant differences in those values among the experimental groups.
Item
Treatment
Control 50 lux 100 lux 200 lux
ALB (g/dl) 3.19±0.08 3.23±0.09 3.14±0.12 3.11±0.03
CA (mg/dl) 9.29±0.11 9.78±0.19 9.50±0.16 9.72±0.12
CK (IU/L) 224.40±13.57 561.90±229.22 297.25±31.95 237.70±26.93
CRE (mg/dl) 0.91±0.03 0.88±0.03 0.87±0.02 0.91±0.02
GTP (IU/L) 29.20±2.04 28.50±1.64 32.50±3.27 28.90±1.40
GLU (mg/dl) 62.10±0.96 56.40±2.52 59.63±1.35 59.20±1.47
AST(IU/L) 80.20±2.67
b93.60±4.30
a79.50±3.44
b80.10±4.95
bALT (IU/L) 34.80±1.97 35.50±1.65 33.75±2.40 36.60±1.38
LDH (IU/L) 1181.80±41.43 1339.20±46.72 1227.63±57.96 1279.40±49.39
MG (mg/dl) 2.61±0.05 2.58±0.07 2.61±0.09 2.40±0.05
PHO (mg/dl) 6.64±0.31 6.12±0.40 6.04±0.34 6.67±0.25
T-BIL (mg/dl) 0.04±0.01 0.04±0.01 0.03±0.01 0.04±0.01
T-CHO (mg/dl) 217.40±17.19 189.40±11.78 216.88±20.19 212.40±14.10
T-PRO (g/dl) 7.25±0.17 7.61±0.19 7.50±0.25 7.72±0.14
TG (IU/L) 10.60±0.90 11.30±1.30 10.75±0.67 10.80±0.98
UN (mg/dl) 19.83±0.39 19.23±1.03 18.85±0.92 17.39±0.47
NEFA (uEq/L) 98.00±3.59 107.00±12.02 92.50±6.48 89.00±6.05
β-HB (mmol/L) 484.75±14.91
b645.12±54.02
a612.15±37.79
a573.72±24.76
ab Mean values are presented as mean ±SE.a-bMeans within a row with different superscript letters are significantly different (p<0.05)
Table 5. Blood biochemical parameters of experimental groups
Even though, AST and β-HB were significantly increased in the 50 lux than compared to 100 and 200 lux. However, the increased activity of the serum enzymes and β-HB are not a clear evidence at exposure of light intensity. The increase in the activities of these enzymes indicates the liver injury and disruption of normal liver function (Mazzullo et al., 2014). The same mechanism would be occurred in our study, at the exposure of 50 lux light intensity can cause the liver damage due to leakages of AST from liver.
4. Activities of Immunoglobulin (IgA & IgG) and Hormones
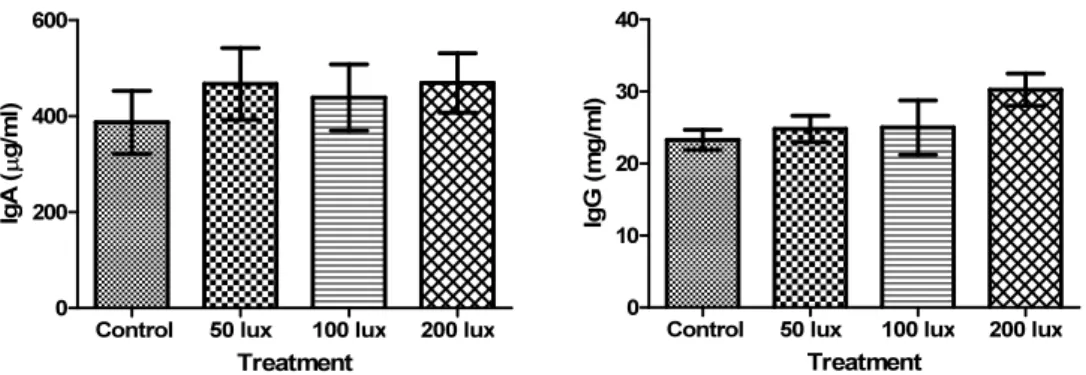
In this study, we have measured the cortisol, IGF-1, prolactin and immunoglobulin levels such as IgA and IgG (Fig. 1 and Fig. 2). IgA and IgG were not significant among the groups (Fig. 1).
Prolactin and IGF-1 levels were significantly increased in 200 lux compared to other groups.
Previous results showed that light travel to the pineal gland located in brain also decreases the melatonin secretion which triggers the IGF-1. The stimulation of IGF-1 influence the memory gland to increased milk production. However, findings of the present study were in contrast with precious work. Our results showed that the treatment with 200lux caused decreased in the milk production while increased the IGF-1 levels (Penev et al., 2014). Besides, cortisol was signifi- cantly higher in 50 lux and lowered in the 200 lux than the control (Fig. 2). Prolactin has a multiplicity of actions in the whole animal, so it does in the mammary gland, being involved in the control of mammary development (mammogenesis) and in the transition from proliferation to secretion (lactogenesis) as well as in lactation itself (Tucker, 2000). The same results were observed in our study, the increased prolactin level in 200 lux direct proportional to milk production. Hence, the increased prolactin level which could be increased the milk production.
Cortisol is the main glucocorticoid in cattle, and, as mentioned previously, its major function is
to enhance the action of prolactin in stimulating differentiation of the epithelium and milk
protein gene expression in the mammary gland during lactogenesis (Akers, 2002). Our results
agreed with a previous study that suggests the increased cortisol could be promoted the prolactin
which further involved in lactation production in 200 lux than 50 and 100 lux. From this study,
we have suggested that LED lighting intensity at 200 lux could promote the milk production and
immune responses as well as cortisol and prolactin levels than 50 and 100 lux. Light that enters
the eye stimulates a penal gland in the brain which is more sensitive to the length results
decreased the melatonin level. The decreased melatonin stimulates the liver to increase produc-
tion of IGF-1 which can influences the memory gland to increase the milk production (Harner
and Zulovich, 2014). Light intensities of 200 lux appear safe in dairy barns is recommended to
get more milk production.
Control 50 lux 100 lux 200 lux 0
200 400 600
Treatment
IgA (µg/ml)
0 Control 50 lux 100 lux 200 lux 10
20 30 40
Treatment
IgG (mg/ml)
Fig. 1. Immunoglobulin (IgG & IgA) in plasma of experimental groups.
Control 50 lux 100 lux 200 lux 0
20 40 60
80 a a ab
b
Treatment
Cortisol (ng/ml)
Control 50 lux 100 lux 200 lux 0
20 40 60
b b b
a
Treatment
IGF-1 (ng/ml)
Control 50 lux 100 lux 200 lux 0
50 100 150
b b b a
Treatment
Prolactin (ng/ml)
Fig. 2. Cortisol, IGF-1 and Prolactin levels of experimental groups. Different letters (a, b) represent statistically significant differences among the treatments (P < 0.05).
Ⅳ. Conclusion
Light is an essential and powerful element to animals and birds. In conclusion, a higher
intensity of 200 lux was increased milk production along with prolactin and IGF-1 levels. The
increased level of IGF-1 might be related to high milk production. Moreover, hemolytic
biochemical parameters were not significantly differenced except AST and β-HB. The level of
lactose was significantly increased in 100 lux light exposed cows. Our results suggest that the
different lighting intensity exposed could influence of external stimuli, such as feeding time, on
a rhythmic pattern (metabolites) involved in the alteration of hormones function, milk com-
position, and biochemical parameters.
[Submitted, January. 11, 2019; Revised, February. 12, 2019; Accepted, March. 18, 2019]
References