국내외 항공 안전계획 및 안전성과지표 동향 및 사례분석
이지선․이동훈․윤윤진*
한국과학기술원 건설 및 환경공학과
A Study on Aviation Safety Plan and Safety Performance Indicator of the Domestic and International Case Studies
LEE, Ji Seon․LEE, Dong Houn․YOON, Yoon Jin*
Department of Civil and Environmental Engineering, KAIST, Daejeon 305-701, Korea
Abstract
According to the State Safety Program (SSP) of the International Civil Aviation Organization (ICAO), it is essential to establish and manage Safety Performance Indicators (SPIs) which are used for monitoring the safety performance to achieve the national aviation safety goal. There have been enormous efforts to develop the framework of SPIs by considering the current status for each country. In case of Republic of Korea, however, there has been limited research and policy projects related to the framework for SPIs. Furthermore, Korea has used identical SPIs since the SSP was legislated in 2008. With this background, this research is, as part of strategy for the state level of SPI development, the study cases of advanced aviation countries for SPI development plans, such as the European Aviation Safety Agency (EASA) of the EU, the Civil Aviation Authority (CAA) of the UK, the Finish Transport Safety Agency (FTSA) of the Finland and the Federal Aviation Administration (FAA) of the U.S. The comparison between the foreign and domestic policies for SPI development strategies are provided in the conclusion of this study. The results and analyses of the case studies performed in this research will be helpful to provide some valuable development strategies for further SPI research in Korea.
ICAO에서 제시한 국가항공프로그램(State Safety Program, SSP)에 따르면, 국가의 항공안전 목표 달성을 위해 안 전성과 측정 및 평가에 활용되는 안전성과지표(SPI)의 설정과 관리가 필수적이다. 이에 따라, 세계 여러 국가들은 자 국의 실정에 맞는 SPI 수립을 연구개발하고 있다. 그에 반해, 우리나라는 2008년 국가항공안전프로그램이 제정된 이 후로 지금까지 동일한 지표를 사용해왔으며, SPI 수립체계에 대한 체계적인 정책 사업 및 관련 연구가 미비한 실정 이다. 따라서, 본 연구는 국내 SPI체계 개발의 일환으로 항공선진국인 유럽과 미국의 SPI 개발계획에 대한 동향 조 사를 하고자 한다. 이를 위해 EU의 유럽항공안전국 (EASA), 영국의 민간항공국 (CAA), 핀란드의 교통안전국 (FTSA) 및 미국의 연방항공청 (FAA) 사례를 분석했다. 도출 결과를 기반으로 국내외 SPI 개발계획 및 수립체계의 차이점을 밝혔다. 본 연구를 통하여 도출된 분석 결과들은 향후 국내 SPI 수립체계의 발전방향 제시하기 위한 기틀 을 마련할 수 있을 것이다.
Keywords
aviation safety, european aviation safety plan, FAA destination, state safety program, safety performance indicator 유럽항공안전계획, FAA Destination 2025, 국가항공안전프로그램, 안전성과지표
* : Corresponding Author Received 22 May 2014, Accepted 9 August 2014
[email protected], Phone: +82-42-350-3615, Fax: +82-42-350-3610
Ⓒ Korean Society of Transportation
This is an Open-Access article distributed under the terms of the Creative Commons Attribution Non-Commercial License (http://creativecommons.org/licenses/by-nc/3.0) which permits unrestricted non-commercial use, distribution, and reproduction in any medium, provided the original work is properly cited.
Article
Figure 1. Republic of Korea aviation accident statistics for last 10 years (2004-2013)
서론 1. 연구의 배경 및 목적
2008년 국제민간항공기구(ICAO)에서 실시한 항공 안전종합평가(USOAP) 결과, 우리나라의 항공안전 이 행률이 세계최고 평점인 98.89%(국제기준 이행률)에 달하는 것으로 나타났다(MOLIT, 2009). 그럼에도 불 구하고 최근 5년 사이의 국내 항공사고발생률은 100만 편 당 5.1건으로, 세계 평균 항공사고발생률(4.1건)보 다 높은 수치를 기록하고 있는 실정이다. 이에 따라, 국 토교통부는 매년 항공사고 15% 감축을 목표로 하여 2017년에는 세계최고 수준의 항공교통 안전도 확보를 계획하고 있다(MOLIT, 2013).
ICAO에서 제시한 국가항공프로그램(State Safety Program, SSP)에 의거하면, 국가의 안전 목표 달성을 위해 안전성과 측정 및 평가에 활용되는 안전성과지표의 설정과 관리가 필수적이다. 이에 따라, 세계 여러 국가들은 자국의 실정에 맞는 안전성과지표(Safety Performance Indicator, SPI) 구축 방법을 연구개발하고 있다. 특히, 항공선진국의 경우 안전성과지표개발을 위한 전담반을 구성하여 구체적인 연구개발 계획을 수립하고, 체계적으 로 관련 사업을 수행함으로써 효과적인 안전성과지표 구 축 계획을 도모하고 있다(EASP, NOA, ASOCS 등).
그에 비해, 우리나라는 2008년 국가항공안전프로그램이 제정된 이후로 지금까지 동일한 지표를 안전성과 측정 및 평가를 위하여 대표지표(사망사고율 및 사고․준사고 율)는 5년, 분야별 성과지표(항공기 준사고, 항공안전장 애)는 분기, 1년 혹은 상시 관리되고 있을 뿐이다. 국토
해양부(현 국토교통부)의 국가교통안전기본계획(제 6차 2007-2011 및 7차 2012-2016)에 따라 각 항공분야 별 위험성 측정 지표 수립(“안전지표 및 위험지표 사례조 사 및 기초연구”)을 계획하였으나, 안전성과지표 수립체 계에 대한 체계적인 정책 사업 및 관련 연구가 미비한 실 정이다. 그 외의 선행연구로는 Chang and yeh(2004)이 항공사의 안전성능과 노력의 비교를 기반으로 새로운 정 량적 항공사 안전 지수를 대만의 주요 항공사를 기반으 로 크게 4가지 분야(관리, 운영, 정비, 계획) 13개의 세 부 안전지표를 사용하였다, Enoma and Allen(2007)은 항공관련 테러의 증가로 기존의 직접적으로 측정하지 않 았던 공항의 안전 및 보안과 관련된 공항의 시설 관리를 위한 잠재적인 핵심성과지표를 개발하였다. 이와 같이 항공 안전성과지표에 대하여 항공사나 공항 등의 선행연 구는 찾아볼 수 있으나, 이외의 국가적 수준의 안전성과 지표에 대한 연구는 거의 전무한 상태이다. 따라서 본 연 구는 항공선진국의 안전성과지표 수립에 대한 사례분석 및 관련 연구 조사를 통해 시사점을 도출하고 국내 활용 방안을 고려한 향후 안전성과지표 수립체계의 발전방향 을 제시하고자 한다.
2. 연구의 내용 및 방법
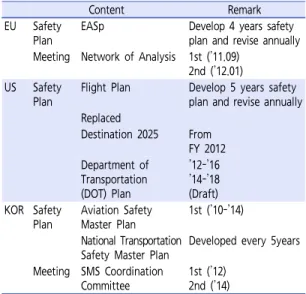
본 연구에서는 국내외 안전성과지표개발을 위한 동향 조사 및 사례를 조사․분석하고 시사점을 도출하고자 한다. 동향조사는 EU의 EASp(European Aviation Safety Plan)와 NoA(Network of Analysts, European Aviation Safety Agency), 미국의 Flight Plan, FAA Destination 2025 및 국내 항공안전 중장 기 종합계획과 국가교통안전기본계획으로 연구 범위를 정하였다. 국내외 안전성과지표 구축 동향조사로는, 유 럽의 EASA(European Aviation Safety Agency), 핀란드, 영국, 미국 및 국내 사례 순으로 조사하였다. 마 지막으로 조사․분석된 자료를 통해 시사점을 도출하여 향후 안전성과지표 수립체계의 발전방향을 도출 하고자 한다.
국내외 항공안전계획 및 안전성과지표 개발 동향 1. EU
유럽의 경우 EASA(European Aviation Safety
Top 3 Current Risks Top 3 Emerging Risks Loss of Separation/ MAC/ Airprox
(12 EASA Member States)
Laser Illumination (8 EASA Member States) Runway Incursions
(7 EASA Member States)
Bird strikes
(5 EASA Member States) Runway Excursions
(5 EASA Member States)
Fatigue
(2 EASA Member States) Table 1. Top 3 current and emerging risks(NoA Annual Report, 2012)
Agency)는 안전데이터 분석 및 활용 관련 부문의 개선 을 위해 EASA 회원국 기반으로 NoA 회의를 매년 정기 적으로 안배하여 안전성과지표 개발에 힘써오고 있다 (NoA SPI Survey Results, 2012). EASA는 매년 초와 말에 개최되는 NoA 회의를 통해 EASA 회원국들 의 주요 핵심 사안들을 조사하고, 사고 유형 중심 기반의 안전성과 지표 및 측정기법에 대해 다룬다. 2011년 9월 개최된 1차 NoA 회의를 통해 유럽 및 국가 단위의 안전 성과지표개발의 필요성에 대한 EASA 회원국의 의견을 확인하였고, 2012년 1월에 열린 2차 NoA 회의를 통해 EASA 회원국들의 설문조사를 기반으로 안전성과지표 목록에 대한 구체적인 사안을 다루었다. 2차 NoA 회의 의 주요 성과물로써 각 국의 핵심 모니터링 대상이 되는 6개 부문의 사고․준사고 유형을 도출하였다(Network of Analysts Annual Report, 2012).
EASA는 NoA 회의를 통해 도출된 핵심 성과지표들 이외에도, EASp(European Aviation Safety Plan) 를 수립하여 정기적으로 차후 4개년 동안의 안전활동 및 실태를 모니터링하기 위한 안전성과 지표 및 측정방법을 제시하고, 관련 기법들을 개발하기 위한 계획들을 매년 업데이트하고 있다(EASP 2011-2014, 2012-2015, 2013-2016).
2. FAA
미국 FAA는 체계적인 활동을 추진하기 위하여 중장 기(5개년) 계획인 Flight Plan을 수립하였다. 2003년 최초 수립된 Flight Plan은 2009-2013년 계획을 마지 막으로 FAA 전략계획을 Destination 2025로 FY 2012 부터 대체되었다(FAA order 8000.368A, 6-b note). Destination 2025은 향후 15년 동안의 미국 항공시스템과 FAA 기관 변화를 나타내고, FAA의 장기 적인 전략 및 비전을 제시하고 있다.
FAA 하위 부서 중에, 업무별로 Aiport(ART), Air
Traffic Organization(ATO), NextGen(ANG), Com- mercial Space Transportation(AST), Aviation Safety(AVS)로 나뉘며, 9개의 지원부서(Staff offices) 가 Flight Plan 목표와 전략에 따라 Business Plan을 매년 구축하여 이행하고 있다.
3. 국내
국토교통부의 제 6차 국가교통안전기본계획(2007- 2011)에 의해 수립된 중점과제 중 하나인 “항공운송사 업의 체계적인 안전관리”는 항공안전도 향상을 위해 위 험성 측정 지표 수립을 도모하였다(MOLIT, 2006). 측 정 지표 수립 관련 연구로 “안전지표 및 위험지표 사례조 사 및 기초연구”를 추진하였다. 2007년 항공안전 중장기 종합계획(2008-2012) 연구를 수행하였으며, 국토교통 부는 교통안전기본계획을 실현하기 위해 국가항공안전계 획을 추진하였고(한국형 국가항공안전프로그램(SSP) 개발 연구용역 최종보고서(KTSA, 2011)), 안전성과 지표 계층화를 통해 3개의 계층적 구조를 갖는 안전성과 모니터링을 위한 안전평가지표 체계(안)를 개발하여 제 시하였다. 그러나 국가 항공안전 위험관리를 위해 개발 된 안전성과지표는 고시된 국가항공안전프로그램에 반영 되지 않았다(MOLIT, 2008, 2009, 2011, 2013, 2014). 2011년도부터 2014년도에 걸쳐 4차례 개정된 국가항공안전프로그램의 고시안이 담고 있는 분야별 안 전성과지표는 동일하게 유지되고 있다.
4. 시사점
국외 사례분석 결과 유럽의 경우, NoA라는 정기적인 회의를 통하여 안전성과지표를 점진적으로 개발하고 있 다. EASA 가맹국들은 나라별의 상황에 맞게 지표를 설 정하여 이행하고 있으며, 회원국 간의 안전성과를 이해 하기 위하여 노력하였다. 미국 FAA는 중장기 계획인 Flight plan을 매년 구축하고 있었다. 다시 말해서, 2004-2008, 2005-2009, 이와 같이 매년 중장기 계획 을 세우고, 매년 그 결과를 도출하고 변화되는 상황을 적 용하여 매년 수립되는 중장기 계획에 반영하고 있으며, 업무별 Business Plan 또한 매년 수행하고, 각 계획에 따라 결과 리포트를 만들었다.
그에 비하여 국내항공안전관련 중장기 계획은, 그 기 초 연구가 한국교통연구원에서 2007년 3월에 기초연구
Content Remark EU Safety
Plan
EASp Develop 4 years safety
plan and revise annually Meeting Network of Analysis 1st (’11.09)
2nd (’12.01) US Safety
Plan
Flight Plan Develop 5 years safety plan and revise annually Replaced
Destination 2025 From FY 2012 Department of
Transportation (DOT) Plan
’12-’16
’14-’18 (Draft) KOR Safety
Plan
Aviation Safety Master Plan
1st (’10-’14)
National Transportation Safety Master Plan
Developed every 5years
Meeting SMS Coordination Committee
1st (’12) 2nd (’14) Table 2. Aviation safety plan & activity
Occurrence Type Indicators
Loss of Control - inflight
∙ Stick Shaker
∙ Increased Roll Attitude or Rate
∙ High Pitch Angle
∙ Overspeed(Vertical or Configuration)
∙ Failure of Primary Flight Instruments Controlled Flight Into
or toward Terrain (CFIT)
∙ EGPWS Hard Warnings
∙ Descent Below MSA
∙ Navigation Errors Runway Excursion ∙ Abnormal Runway Contact
∙ Loss of Control on Ground
∙ Long or Fast Landings
∙ Occurrences with Crosswind Conditions
∙ High speed Rejected Take-offs
∙ ATA32 Related Occurrences Aircraft proximity
/ACAS(Airborne Collision Avoidance System) Alert / Loss of Separation / (near) Midair Collisions
∙ Losses of Separation
∙ Inadequate Separation
∙ Level Busts
∙ Airspace Infringement
Runway Incursion - Vehicle, Aircraft or Person
∙ Runway Incursions
Ground Collision and RAMP
: Ground Handling
∙ Taxiway Incursions
∙ Avoiding Manoeuvres during Taxi
∙ Aircraft Collisions and Collisions with Aircraft
System Component Failure
∙ Engine Failure
∙ Flight Control Problems
∙ Helicopter tail rotor and main rotor blabe failures or malfunctions Table 3. EASA member states common SPIs
가 완료되고, 교통안전공단에서 항공안전 중장기 종합계 획 수립을 위한 연구용역(KOTI, 2007)을 수행하였다.
이후 제1차 중장기항공안전종합계획이 2010년도 수립 (2010-2014, 2010수립)되고, 2차 중장기항공종합계 획(2015-2019)은 추진 중에 있다. EU의 EASp(4년) 와 미국 FAA Flight plan(5년)의 중장기 계획이지만 매년 그 계획이 수립되었다. 즉, 중장기 계획을 매년 설 계하면서, 변화하는 현재의 상황을 수정 반영이 가능하 지만, 국내의 경우는 한번 세워진 중장기 계획이 변화되 는 상황에 따라 적용할 수 없고 5년 후의 연구되는 시점 에서 그 변화가 반영되는 한계점이 있다. 2012년 6월 안 전현안 및 대책을 총괄적으로 검토하여 국가 항공안전 증진을 위한 목적으로 제 1차 항공안전협의회(SMS Coordination Committee)가 개최되었다. ‘항공안전 협의회 운영규정(국토교통부 예규 제 8호)’ 제5조 ①항 에 의거하면, 협의회는 6개월 1회 이상 정기적 개최를 원칙으로 한다. 그러나 제 1차 회의 이후 현재까지 단 한 차례의 협의회 개최 사실을 미루어 봤을 때, 제정된 운영 규정을 제대로 준수하고 있지 않았다고 판단할 수 있다.
국내외 안전성과지표 사례 1. EU
1) EASA
EASA는 EASp를 통해 회원국들에게 안전대책의 효
과를 모니터링하기 위한 절차, 안전성과지표 및 측정방 법을 제공하고 있다. 이는 유럽의 국가들이 사용하고 있 는 기존 안전성과지표를 기반하여 개발 되었으며, 전체 EASA 회원국들의 성과를 상대적으로 이해하는데 활용 된다. EASA에서 제공하는 안전성과지표는 3단계의 계 층적 구조(Tier)를 나타낸다. Tier 1은 운송형태 별 사 고/준사고/사망사고를 다루고 있으며, 운송형태의 종류 는 다음과 같다.
- 대형상업용항공기(Turboprop, Turbofan/jet, Piston) - 대형상업용헬기(3,175kg 초과)
- 경량상업용헬기(3,175kg 이하)
- 다른 상업용고정익(대형상업항공기 제외) - 개인항공(business flight, recreational flying)
Table 3는 EASA에서 제공하는 회원국들의 공통 안 전성과지표를 나타내고 있다. EASA 회원국들의 설문조사 및 분석내용을 토대로 구성된 공통 안전성과지표는 Tier2
First Tier SPI Accidents Serious incidents Fatalities Second Tier SPI Runway excursion (RE) Runway incursion (RI-VAP)
Mid-air Collisions and near misses (MAC)
Controlled flight into terrain and similar situation (CFIT) Loss of control in flight (LOC-I)
Ground collisions - collisions while taxing to or from a runway in use (GCOL) Third Tier SPI
RE Unstable approaches
Landing gear and reverse thrust malfunctions Deficiencies in runway condition and related information Downwind Landings and takeoffs
Abnormal runway contact High-speed rejected takeoff RI
-VAP Runway incursions by aircraft
Runway incursions with direct/indirect ATC contribution Runway incursions by vehicle or person
Runway incursions with direct/indirect ATC contribution at Helsinki-Vantaa Airport
MAC Separation minima infringements caused by aircraft
Separation minima infringements with direct/indirect ATC contribution Separation minima infringements with direct/indirect ATC contribution involving a civilian IFR aircraft
Airspace Infringements
level busts of more than 300 or 200 feet Incorrect response to TCAS-RA Lateral deviations from cleared flight path Air navigation
service technical systems and function
Air navigation services communications system malfunctions or disruptions Air navigation services navigation system malfunctions or disruptions
Air navigation services surveillance system malfunctions or disruptions
Aircraft technical systems and maintenance
Transponder faults and failures
CFIT Incorrect altimeter pressure settings
Ground Proximity Warning System (GPWS) terrain warnings Errors and omissions in aeronautical charts
LOC-I Laser interference
Low speed and high speed cases Wake turbulence incidents Fire or smoke in aircraft De-icing and anti-icing errors Aircraft weight and balance errors Control system failures Ground handling damage Aircraft technical systems and maintenance
Dual system failures
Occurrences in Minimum Equipment List and technical log use
Occurrences in maintenance and airworthiness monitoring
Occurrences in maintenance operations Serious technical problems in aircraft GCOL Pushback or taxi interference
Insufficient supervision at apron
Foreign Object Debris (FOD) in the manoeuvring area and apron, and damage caused
Table 4. List of finland SPIs 에 해당하는 7가지 사고 유형(Occurrence Types)과
더불어, Tier3에 해당하는 25개의 지표(Indicators)로 구성된다.
기존에 자국의 실정에 맞추어 안전성과지표를 수립하 여 운용하고 있던 유럽의 몇몇 국가(2012년도 기준)를 제외한 EASA 회원국들은 이를 토대로 자국의 안전성과 지표를 수립하고 있다.
2) Finland
핀란드의 안전성과지표는 EASA에서 개발한 안전성 과지표 설정 기법에 의해 수립되었다. 해당 안전성과지 표는 EASA와 동일한 3단계의 계층적 구조(Tier)를 지 니며, Table 4와 같이 분류된다.
핀란드의 1단계(Tier1) 안전성과지표는 3가지 항목 을 포함하며, 사고, 준사고 및 사망사고로 구성된다. Tier 2는 EASA에서 제공하는 안전성과지표 구축 방법과 동 일한 방법으로, 사고․준사고 형태의 특정 사고유형으로 설정된다. 해당 항목들은 활주로 침범․이탈(RE․
RI-VAP), 공중충돌(MAC) 등 6가지 사고 유형으로 분 류된다. Tier 3에 해당하는 안전성과지표 또한 Tier 2 와 동일한 방법으로써, EASA에서 개발한 설정 기법에 의해 수립되었다. Tier 3는 총 40개 항목으로 구성되며 RE(6), RI-VAP(4), MAC(11), CFIT(3), LOC-I(13) 및 GCOL(3)으로 구분된다.
3) UK
핀란드의 경우와 다르게, 영국은 EASA의 공통 안전 성과지표 수립 이전에 자국의 실정에 맞추어 안전성과지 표를 수립․운영해왔다. 영국 CAA는 항공 산업을 7가 지 유형으로 분류하여 사망사고율을 모니터링하고 있다 (CAA, UK, 2009).
- 대형여객기(Large passenger aircraft, LPA) - 대형화물기(Large freighter aircraft, LFA) - 소형운송기(Small public transport aircraft,
SPTA)
- 대형운송회전익항공기(Large public transport helicopters, LPTH)
- 일반항공(General aviation, GA)
- 대형운송기(Large public transport aircraft, LPTA)
Significant Seven Safety
Issues Key Performance Metric
Loss of
Control Number loss of control events
Number of stick-shake and alpha floor events (auto-thrust to prevent stalling)
Number of take-off configuration warning events Number of low speed during approach events Number of low speed during cruise events
Proportion of UK aircraft operators to have implemented and actively monitor loss of control precursor measures Proportion of UK AOC holders to have implemented pilot monitoring skills training such as that suggested by the CAA’s ‘Monitoring Matters’ programme
Proportion of pilots employed by UK AOC holders that have received pilot monitoring skills training as suggested by the CAA’s ‘Monitoring Matters’ programme
Runway
Excursion Number of runway excursion and overrun events Number of unstable/de-stabilized approaches: all and proportion that continue to landing
Number of events where runway contamination is a contributory or causal factor
Proportion of UK aircraft operators to have implemented and actively monitored runway excursion precursor measures Proportion of Air Navigation Service providers to have completed unstable approach awareness training through Training in Unusual Circumstances and Emergencies (TRUCE) Proportion of UK licensed aerodromes using ‘new reporting criteria’ for runway surface condition
Controlled Flight into Terrain (CFIT)
Number of Enhanced Ground Proximity Warning System (EGPWS) alerts
Number of unstable/de-stabilized approaches
Number of significant deviation below glide slope events Number of gross position error events
Number of deviation below minimum safety altitude events Number of UK aircraft operators to have implemented and actively monitored CFIT precursor measures Number of APV-type approaches available in the UK compared with traditional NPAs
Number of APV-type approaches at EU and third-country aerodromes, used by UK operators
Proportion of relevant UK fleet approved for APV-type approaches
Proportion of approaches flown by UK operators, which have some form of vertical guidance
Runway
Incursion Number of runway incursions at UK aerodromes or involving UK operators worldwide (analysed by severity grade) Number of UK licensed aerodromes that have implemented recommendations from and/or audited internally against EAPPRI2
Licensed aerodromes will be audited against the new airside driving standard detailed in ‘Requirement for an Airside Driving Permit (ADP) Scheme
Airborne
Conflict Number of risk-bearing AIRPROX events Number of AIRPROX in the visual circuit
Number of correct responses to Terminal Collision Avoidance System Resolution Advisories (TCAS RAs) Number of level busts
Number of airspace infringements
Number of losses of separation due to airspace infringements Ground
Handling The number and location of loading errors by error type, including dangerous goods events
The number of collisions involving vehicles and parked aircraft at UK reporting aerodromes
The number of collisions, near-collisions and conflicts involving vehicles and taxiing aircraft at UK reporting aerodromes Number of de-icing related occurrences.
Fire Number of aircraft fires Number of aircraft smoke events
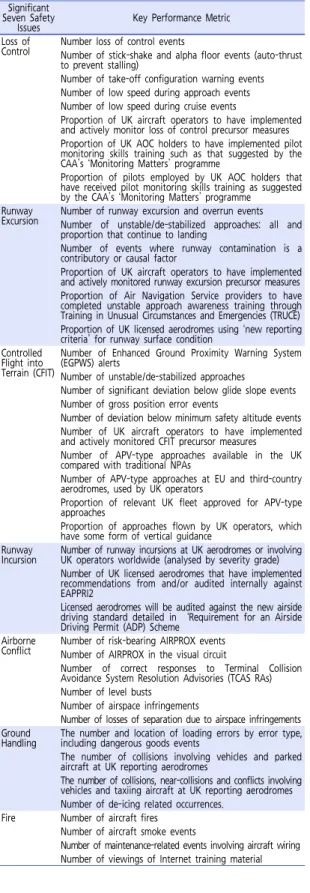
Number of maintenance-related events involving aircraft wiring Number of viewings of Internet training material Table 5. Key performance indicator of significant seven safety issue LIST (UK CAA, Safety Plan 2014)
Issue Activities to mitigate the risk LOC - pilot training and assessment of monitoring skills
- how automation is used in aircraft
- maintenance and competence of pilot manual flying skills.
RE - reducing unstable/de-stabilised approaches
- improving information to pilots on expected braking action on contaminated runways e.g. snow or slush - improving safety areas around runways.
CFIT - reducing the risk of non-precision approaches - improving CFIT alerts
- improvements to TAWS.
RI - promotion of recommendations from EAPPRI2 (European Action plan for the prevention of Runway incursion version 2.0) to industry.
GH - loading errors
- serious collisions between vehicles and aircraft undetected before flight.
Table 6. CAA UK activities to mitigate the risk of the significant 7 safety issue (UK, 2014)
- 영국 공역 내 대형 운송항공기(All large public transport aircraft, ALPTA)
2009년, 영국 CAA는 대형 여객기와 관련된 전 세계 의 사망사고 및 고위험 사고에 대한 분석결과를 바탕으 로, 안전성과지표 성격을 지니는 7가지 유형의 안전이슈 (Safety Issues)를 설정했다 (CAA UK, 2011). 각 안 전이슈 별 핵심성과측정방법(Key Performance Metric) 은 Table 5와 같다.
영국 CAA에서 수립한 핵심성과측정방법은 7종류의 안 전이슈에 따라 총 41가지 유형으로 구분된다. 각 안전이슈 별 핵심성과측정방법은 Loss of Control(8), Runway Excursion(6), CFIT(10), Runway Incursion(3), Airborne Conflict(6), Ground Handling(4) 및 Fire(4)로 구분된다. 이와 같이, 영국에서 구축한 안전 성과지표 체계는 앞서 제시한 EASA 및 핀란드의 사례 와 매우 유사한 것을 알 수 있다. 그러나 영국 CAA에서 수립한 안전성과측정 체계는 앞서 조사한 EASA 및 핀 란드의 경우와 달리, 각 안전이슈 별 위험경감을 위한 중 점 활동도 포함한다.
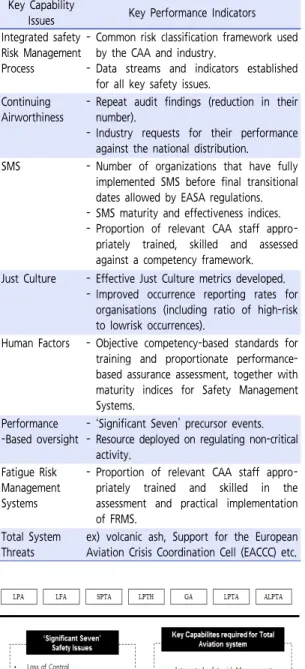
영국 CAA는 안전이슈 이외에 별도로 안전관리에 필 요한 주요 구성요소들의 역량(Capabilities)을 측정하 기 위한 핵심역량이슈(Key Capability Issue)를 수립 하였다. Table 7는 각 8가지 핵심역량이슈 별 14개 유 형의 핵심성과지표를 나타낸다.
영국 CAA에서 수립한 주요 성과지표들은 각 주요 안
Performance Target
Cut the rate of fatalities per 100 million persons on board in half by FY 2025.
Strategy
Improve FAA oversight systems and processes.
Continue the evolution toward a performance -based NAS by using a satellite-based navigation system and onboard technologies.
Address safety concerns and issues, expand cost-effective safety oversight and surveillance , and continue research into the causal factors of accident
Promote and expand safety information sharing effort, including FAA-industry partnerships and data-driven safety programs that identify, prioritize, and address risks before they lead to accident
Table 8. FAA flight plan(2009-2013), increased safety, OBJECTIVE 1 (Reduce commercial air carrier fatalities)
Key Capability
Issues Key Performance Indicators Integrated safety
Risk Management Process
- Common risk classification framework used by the CAA and industry.
- Data streams and indicators established for all key safety issues.
Continuing Airworthiness
- Repeat audit findings (reduction in their number).
- Industry requests for their performance against the national distribution.
SMS - Number of organizations that have fully implemented SMS before final transitional dates allowed by EASA regulations.
- SMS maturity and effectiveness indices.
- Proportion of relevant CAA staff appro- priately trained, skilled and assessed against a competency framework.
Just Culture - Effective Just Culture metrics developed.
- Improved occurrence reporting rates for organisations (including ratio of high-risk to lowrisk occurrences).
Human Factors - Objective competency-based standards for training and proportionate performance- based assurance assessment, together with maturity indices for Safety Management Systems.
Performance -Based oversight
- ‘Significant Seven’ precursor events.
- Resource deployed on regulating non-critical activity.
Fatigue Risk Management Systems
- Proportion of relevant CAA staff appro- priately trained and skilled in the assessment and practical implementation of FRMS.
Total System Threats
ex) volcanic ash, Support for the European Aviation Crisis Coordination Cell (EACCC) etc.
Table 7. Key capabilities required for the total aviation system (UK)
Figure 2. CAA UK safety plan framework
전이슈 및 역량이슈 별로 해당되는 항목과 직접적으로 관련 있는 세부 핵심성과지표로 구성되며, 종합적인 안 전지표체계는 Figure 2와 같이 나타낼 수 있다.
2. FAA
2009-2013 Flight Plan은 4개의 목적(안전성 증대, 용량의 극대화, 국제적 리더쉽, 조직의 완벽성)을 추구 하고 있으며, 목적(Goal)별로 여러 개의 목표(Objective) 를 지정하고 성과를 측정할 수 있는 성과지표 (Per- formance Target)를 설정하고 있다. 또한, 각 목표를 전략(Strategy)과 세부시행과제(Initiative)을 수립하 였으며, Table 8은 Objective 1의 Performance target과 strategy를 정리한 것이다.
- Obj.1: 상업용항공의 사망률 감소 - Obj.2: 일반항공의 사망률 감소 - Obj.3: 활주로 침입의 위험 감소
- Obj.4: 상업우주발사(commercial space launches) 의 안전보장
- Obj.5: FAA 항공교통시스템의 안전 강화 - Obj.6: SMS 이행
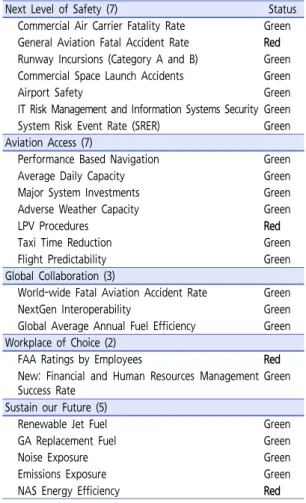
Destination 2025는 FAA와 항공업계가 2025년에 사고 사망사고를 줄이기 위한 목표로 CAST (Commercial Aviation Safety Team, 상업항공안전팀) 프로그램을 진화시켰다. 50% 감축을 목표로 5개의 카테고리 및 24 개의 measure을 모니터링하고 있다. 각 measurer과 관련하여, 각 지표별 측정단위, 측정방법, 측정범위, 목 표 값 등의 자세한 정보를 제공 하였다. 뿐만 아니라, 지 표 선택의 이유, 공공 이익, 관련 부처, 지표 값이 주는 외부 효과, 데이터 획득 방법 등의 정보도 공시하고 있 었다. Table 9는 최근 2013년 4분기의 지표의 성과
Figure 3. Target and indicator framework, ROK (SSP)
Division Indicator
Air Traffic Control (15)
▶ Serious incident rate per 100,000 air traffic volume 1. Accidents / Serious incidents
2. Inappropriate separation minima with aircraft 3. Inappropriate separation minima with controlled
airspace 4. Taxiway incursion
5. Runway incursion with non-influence of the other aircraft operations
6. Descent under Minimum Vectoring Altitude 7. ATC procedure error or failure of the ATC service 8. ACAS RA (excluding equipment malfunction, VFR
approach of the military aircraft)
9. Non-compliances cooperation procedure between air traffic controller
10. The occurrence of the irregular situation due to the inexperience of the air traffic equipment 11. Communication error between air traffic controller
and pilot
12. Perform the air traffic service without considering severe weather factor
13. Reporting the unsatisfactory air traffic service 14. Violation of the ATC regulation
Airport (7)
▶ Number of ground accident per 1,000 registered vehicle or equipment
1. Ground collision between aircraft and vehicle (equipment) or object
2. Vehicle/equipment damage and human injury due to the ground collision in movement area
▶ Number of the functional disorder facility with all airports
3. Interrupt the aircraft operation due to the serious damage of the runway, taxiway and apron 4. Interrupt the aircraft operation due to the fire
in the aircraft movement area
5. Interrupt the aviation safety due to the finding of partial aircraft component or dangerous goods in movement area
6. Delay the normal operation due to the significant spillage during fuelling operations
7. Shut-down the Aeronautical Light Aids operation Air
Nav.
service (3)
▶ Failure of the Air Navigation aid (Failure hours/
Total Operation hours)
▶ Shut-down of communication facilities (Failure hours/
Total Operation hours)
▶ Number of the communication error Table 10. Sub groups SPIs (SSP appendix 4, South Korea)
Next Level of Safety (7) Status
Commercial Air Carrier Fatality Rate Green General Aviation Fatal Accident Rate Red Runway Incursions (Category A and B) Green Commercial Space Launch Accidents Green
Airport Safety Green
IT Risk Management and Information Systems Security Green
System Risk Event Rate (SRER) Green
Aviation Access (7)
Performance Based Navigation Green
Average Daily Capacity Green
Major System Investments Green
Adverse Weather Capacity Green
LPV Procedures Red
Taxi Time Reduction Green
Flight Predictability Green
Global Collaboration (3)
World-wide Fatal Aviation Accident Rate Green
NextGen Interoperability Green
Global Average Annual Fuel Efficiency Green Workplace of Choice (2)
FAA Ratings by Employees Red
New: Financial and Human Resources Management Success Rate
Green
Sustain our Future (5)
Renewable Jet Fuel Green
GA Replacement Fuel Green
Noise Exposure Green
Emissions Exposure Green
NAS Energy Efficiency Red
Table 9. Destination 2025 performance & FY 2013 4th quarter performance scorecard
결과를 보여주고 있으며, 24개의 목표치 중에서 20개의 measure을 만족하였으며, Next Level of Safety에 서는 일반항공의 사망사고율이 목표기준에 만족하지 못 했다.
3. 국내
국토교통부는 2008년 국가항공안전프로그램의 제정 및 운영을 통해 국가의 항공안전 목표 및 지표를 설정하 였다. 사고 위험 관리 및 안전 활동 성과를 명확히 하기 위해, 정량적 안전 목표 및 지표를 5개년 단위인 종합관 리지표와 1년 단위인 분야별 성과지표로 관리하도록 되 어 있다(MOLIT, 2011, 2014).
분야별 성과지표는 국가항공안전프로그램 별표 4(서 브파트 분야별 안전성과지표)에 관제, 공항, 항행시설 등의 3분야로 나뉘어 25개의 고유지표를 가진다.
4. 시사점
본 연구를 통하여, 유럽의 경우는 NoA라는 정기적인 회의를 통하여 수립된 Common SPIs를 기초로하여 EASA 회원국가들은 각 나라의 상황에 맞게 수립하여 이행하고 있었다. 제시된 SPIs는 미국과 국내와는 다르 게 사건의 유형(Event 혹은 Occurrence type)의 지표 를 설정하였으며, 이를 야기 시키는 세부 하위지표를 구 축하여 이행하고 있는 것으로 나타났다. 위의 유형은 전 세계적으로 가장 많이 발생한 사망사고와 고위험군으로 도출된 지표이다. CAA UK의 경우에는, Common SPIs에서 다루지 않았던 ‘Fire’ 부분을 추가적으로 고려하 였으며, 안전성과지표 뿐만 아니라, 중요 개별 subject 역량(Capability)를 향상시키기 위한 Action를 위한 지표(Table 7) 및 주요 7개의 안전이슈의 위험을 경감 하기 위한 활동(Activities)도 개발하였다. 미국 FAA 의 경우는 세계에서 가장 안전한 수준을 지향하는 것 뿐 만 아니라, 가장효율적인 항공시스템을 제공하고자 하는 목표를 가지고 안전성과지표의 항목이 보다 넓게 나타나 있었다. 그 중에서 “Safety” 부분과 관련해서 국내와 EU에서 다루지 않는 “Commercial Space Launch Accidents, IT Risk Management and Information Systems Security” 지표들이 관리되고 있었으며, 이는 우주왕복선을 운영하거나 테러의 민감한 미국 항공의 상 황이 반영된 안전성과지표라 할 수 있겠다. 마지막으로 국내는 사망자와 사고 수 등의 대표지표 외에 서브관리 지표로서, 관제, 공항, 항행이라는 부서별 안전성과지표 로 나뉘어져 관리되고 있음을 알 수 있었다. 하지만 이런 성과지표에 대한 항목만 제시가 되었을뿐 지표설정의 이 유, 측정범위, 방법 및 지표 결과 값의 대한 조치사항들 의 계획은 나타나 있지 않았다. 2007년 SMS가 수행된 이후로, 정부에서 관리하였던 운항관련 안전성과지표가 항공사의 자발적 이행으로 이관되어, 통합안전정보시스템 (NARMI(나르미), National Aviation Resource &
Management Information System)를 통해서 운항 관련 안전성과가 관리되고 있으며, 관제/공항/항행처럼 안전성과지표의 내용과 결과는 공개되지 않고 있다.
결론 및 한계점
항공사고를 감축할 수 있는 방법에는 다양한 방법들 이 있으나, 본 연구는 안전계획이나 항공안전성과지표에
제한하여 항공선진국인 유럽과 미국의 항공안전 계획 및 안전성과지표개발 동향 및 사례를 조사․분석하고 국내 와 비교하여 시사점을 도출하였다. 분석결과, 각 나라별 로 항공안전 향상을 위하여 항공안전계획 및 활동을 수 행하고 있으며, 자국의 실정에 맞는 안전성과지표를 구 축하여 이행하고 있었다. 항공선진국의 지표들은, 지표 별 안전목표, 위험을 감소하기 위한 활동까지도 세부적 으로 개발하여 관리하고 있었다. 뿐만 아니라, 지표별 측 정단위, 측정방법, 측정범위, 목표 값이나, 지표 선택의 이유, 공공 이익, 관련 부처, 지표 값이 주는 외부 효과, 데이터 획득 방법 등으로 지표를 설정하고 관리하고 있 었다.
이에 비해, 국내에서 사용되고 있는 지표는 2008년 국가항공프로그램이 제정된 이후로 동일한 지표를 이용 하여 관리하고 있으며, 현재의 항공상황 또한 전혀 반영 되지 못하고 있다. 그러므로, 우리나라 또한 현재 우리나 라의 실정을 파악하고, 현재 상황이 고려되면서 다각적 으로 검토된 안전성과지표의 개발이 필요하다. 더 나아 가, 개발된 안전성과지표 값들의 절감만을 목표로 하기 보다는, 안전성과지표별 사고연관성이나 절감을 위한 안 전성과지표의 추가 개발이나 단계적 활동에 대한 연구들 또한 필요 할 것으로 판단된다.
ACKNOWLEDGEMENT
This research was supported by a grant (11 Aviation-Safety 06) from the Aviation Technology Research Program funded by the Ministry of Land, Infrastructure and Transport of the Korean Government.
REFERENCES
Chang Y. H., Yeh C. H. (2004), A new airline safety index, Transportation Research Part B 38, 369-383.
Civil Aviation Authority UK (2009), CAP 784 State Safety Programme for the United Kingdom, Attachment 2, 3.
Civil Aviation Authority UK (2011), Safety Plan 2011 to 2013.
Civil Aviation Authority UK (2014), Safety Plan 2014-16, 6-34, 55-77.
Enoma A., Allen S. (2007), Developing key performance indicators for airport safety and security, Facilities, 25, 296-315.
European Aviation Safety Agency (2012), European Aviation Safety Plan 2012-2015.
European Aviation Safety Agency (2013), European Aviation Safety Plan 2013-2016.
European Aviation Safety Agency (2014), European Aviation Safety Plan 2014-2017.
Federal Aviation Administration (2007), FAA Flight Plan 2007-2011.
Federal Aviation Administration (2008), FAA Flight Plan 2008-2012.
Federal Aviation Administration (2009), FAA Flight Plan 2009-2013.
Federal Aviation Administration (2011), Destination 2025.
Federal Aviation Administration (2011), FAA Order 8000.368A, Flight Standards Service Oversight.
Federal Aviation Administration (2012), FY 2012 Portfolio of Goals.
Federal Aviation Administration (2013), FY 2013 4th Performance Measure Scorecard.
Finnish Transport Safety Agency (2014), Finnish Aviation Safety programme, Annex 2 Finland’s Safety Objectives and Safety performance Indicators.
International Civil Aviation Organization (2013), Annex 19, Safety Management.
International Civil Aviation Organization (2013), Safety Management Manual (SMM) 3rd edition.
Korea Airports Corporation (2014), SMS Safety Bulletin.
Korea Transportation Safety Authority (2011), A Study on the Development of Korea Aviation State Program(SSP) 한국형 국가항공안전프로그램(SSP) 개발 연구.
Ministry of Land, Infrastructure and Transportation (2006), Transportation Safety Master Plan 2007- 2011, 129.
Ministry of Land, Infrastructure and Transportation (2008, 2009, 2011, 2013, 2014), Korea Aviation
Safety program.
Ministry of Land, Infrastructure and Transportation (2009), Press Release(Aviation).
Ministry of Land, Infrastructure and Transportation (2011), SMS Coordination Committee Operational Regulation.
Ministry of Land, Infrastructure and Transportation (2011), Transportation Safety Master Plan 2012-2016, 32, 216.
Ministry of Land, Infrastructure and Transportation (2013), Press Release(Aviation).
Network of Analysts Safety Performance Indicator Sub Group (2012), EASA Member Sates Common Safety performance Indicator.
Network of Analysts Safety Performance Indicator Sub Group (2012), Summary of Safety performance Indicator Survey of the Network of Analysts, 1-4.
The Korea Transportation Institute (2007), A Study for master plan Establishment of Air Transport Safety, p1-47, 66-69, 123-128.
The Korea Transportation Institute (2007), A Study on the Development and Estimation of performance indicators for Air Transportation, 34-53, 67-76.
♧ 주 작 성 자 : 이지선
♧ 교 신 저 자 : 윤윤진
♧ 논문투고일 : 2014. 5. 22
♧ 논문심사일 : 2014. 7. 15 (1차) 2014. 8. 9 (2차)
♧ 심사판정일 : 2014. 8. 9
♧ 반론접수기한 : 2015. 2. 28
♧ 3인 익명 심사필
♧ 1인 abstract 교정필