Application of Google Search Queries for Predicting the Unemployment Rate for Koreans in Their 30s and 40s
Jae Un Jung1, Jinho Hwang2*
1Assistant Professor, Department of Management Information Systems, Dong-A University
2PhD Student, Department of Management Information Systems, Dong-A University
한국 30~40대 실업률 예측을 위한 구글 검색 정보의 활용
정재운1, 황진호2*
1동아대학교 경영정보학과 조교수, 2동아대학교 경영정보학과 박사과정
Abstract Prolonged recession has caused the youth unemployment rate in Korea to remain at a high level of approximately 10% for years. Recently, the number of unemployed Koreans in their 30s and 40s has shown an upward trend. To expand the government’s employment promotion and unemployment benefits from youth-centered policies to diverse age groups, including people in their 30s and 40s, prediction models for different age groups are required. Thus, we aimed to develop unemployment prediction models for specific age groups (30s and 40s) using available unemployment rates provided by Statistics Korea and Google search queries related to them. We first estimated multiple linear regressions (Model 1) using seasonal autoregressive integrated moving average approach with relevant unemployment rates. Then, we introduced Google search queries to obtain improved models (Model 2).
For both groups, consequently, Model 2 additionally using web queries outperformed Model 1 during training and predictive periods. This result indicates that a web search query is still significant to improve the unemployment predictive models for Koreans. For practical application, this study needs to be furthered but will contribute to obtaining age-wise unemployment predictions.
Key Words : 30s and 40s Unemployment, Web Search Query, Prediction, SARIMA Model, Machine Learning
요 약 장기불황으로 인해 한국 청년실업률이 수년간 10% 안팎의 높은 수준을 유지하고 있는 가운데, 주요 경제활동 인구인 30~40대의 실업률이 최근 상승세를 보이고 있다. 정부의 기존 청년 중심의 고용촉진 및 실업복지 정책을 30~40대를 포함한 다양한 연령층으로 확대·강화하기 위해서는 각 연령층에 대한 실업예측 모형 연구가 필요하다. 이 에 본 연구에서는 한국 통계청 실업률 자료와 구글 검색어를 활용하여 한국 30~40대 연령층에 특화된 실업률 예측모 형을 개발하고자 하였다. 실업률 자료와 계절성 자기회귀누적이동평균 모형을 활용하여 기초모형(Model 1)을 다중선 형회귀 모형으로 추정하였으며, 개선된 모형을 구하고자 구글 검색 질의어 정보를 Model 1에 추가 활용하였다(Model 2). 그 결과, 30대와 40대 연령층 모두 구글 검색 질의어를 추가 활용한 Model 2가 Model 1보다 우수한 예측력을 보였다. 이는 웹 검색 질의어가 여전히 한국의 실업률 예측모형을 개선하는 데 유의미함을 의미한다. 본 연구는 실질적 인 활용을 위해 추가적인 연구가 필요하지만, 연령대별 실업률 예측 연구에 기여할 것으로 판단된다.
주제어 : 30~40대 실업률, 웹 검색어, 예측, SARIMA 모형, 머신러닝
*This work was supported by the Ministry of Education of the Republic of Korea and the National Research Foundation of Korea (NRF-2017S1A5A8018867)
*Corresponding Author : Jinho Hwang([email protected])
Received August 9, 2019 Revised August 30, 2019
Accepted September 20, 2019 Published September 28, 2019
1. Introduction
Unemployment rate is a key indicator of the national economy [1]. It is periodically and systematically measured by governments [2,3]. In Korea, the youth (15-29 year-olds) unemployment rate has reached a high level of around 10% for the past few years under the influence of low global economic growth [4,5]. Further, the unemployment rates for workers in their 30s (30-39 year-olds) and 40s (40-49 year-olds) who form a major proportion of the working-age population, has shown upward trends [5]. Despite the Korean government’s attempts to avoid a prolonged recession, the overall unemployment rate has shown an accelerated rise with concerns about a deeper recession caused by the vicious cycle between job insecurity and household income reduction [6,7].
To expand Korea’s youth-centered unemployment policies [8] to more diverse and wider age groups, including the 30s and 40s, unemployment predictive studies, which form the basis for the government’s policies on employment promotion and unemployment benefits, also must be expanded to include these age groups.
The unemployment rate is conventionally measured based on the data collected by investigators who visit and interview people [3].
The rate thus measured is released with a few weeks delay. For more rapid and accurate predictions, recent unemployment prediction studies employed advanced techniques using web search queries in addition to the unemployment rate. Since Askitas and Zimmermann [9]
demonstrated the possibility of applying Google search queries to forecast the unemployment rate in Germany by identifying correlations between the Google search frequency of certain queries and unemployment rate data, web search queries of various types (classified by language, web search engine, region, and etc.) have been applied to forecast unemployment rate. Choi and Varian [10] used Google search queries to
forecast initial claims for unemployment benefits in the USA. Anvik and Gjelstad [11] used Google search queries to forecast the unemployment rate in Norway. In Korea, Kwon, et al., [12] used the Naver search engine to estimate Korea’s unemployment rate, and Kwon and Jung [13]
applied Naver search queries to predict the Korea’s youth unemployment rate.
These studies established that utilizing web search queries in addition to unemployment rates can improve the performance of naive models that employ only unemployment rates.
Jung [14] compared the Korean youth unemployment prediction model based on Google search queries with that based on Naver search queries and showed that using Google search queries led to better performance.
Classified working-age groups help in building a prediction model for concrete dynamics (i.e.
labor supply [15]); however, applications for unemployment predictions are not activated.
With the same spirit of their researches, the aim of our study is to develop predictive models specialized for unemployment rate of Koreans in their 30s and 40s. Using seasonal autoregressive integrated moving average (SARIMA) models, we estimate the unemployment rates of Koreans in their 30s and 40s (described in Section 3). And then, we developed advanced predictive models applying Google web search queries together with estimated SARIMA models (described in Section 4). Finally, we compared the predictabilities of naive predictive models and advanced predictive models (in Section 4).
2. Unemployment Rate Data for Koreans in Their 30s and 40s
In this study, the baseline predictive model The unemployment rate in Korea is officially measured monthly and released to the public by
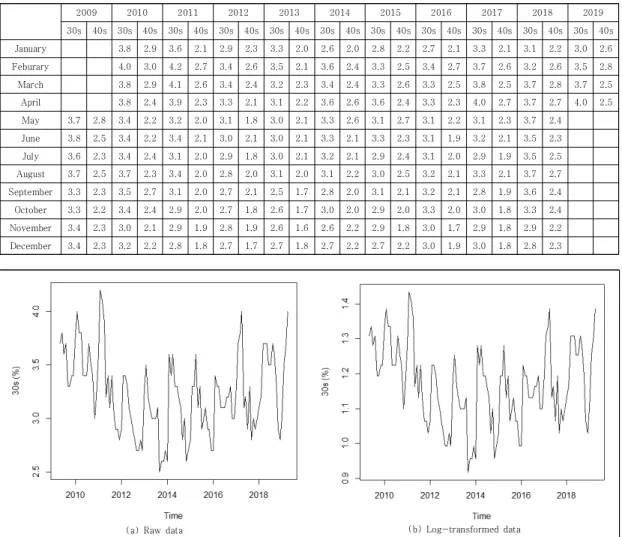
Statistics Korea. We retrieved the unemployment rate for Koreans aged 30-39 year-olds (30s) and 40-49 year-olds (40s) from the website of Korean Statistical Information Service [16]. Table 1 lists the raw unemployment rates for Koreans in their 30s and 40s from May 2009 to April 2019.
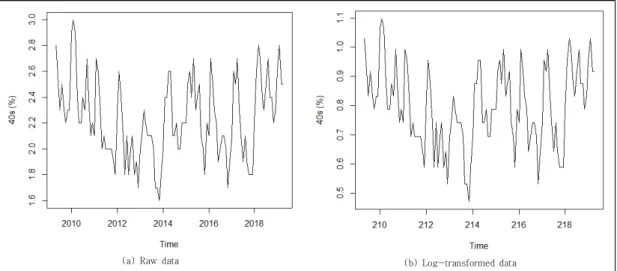
Fig. 1 and 2 present the changes of the unemployment rates for 30s and 40s. From examining Fig. 1 and 2 (raw data), we note that observations in different segments of time look much alike with cycles of 12 months. Often the first and second differences of observations may reduce a non-stationary time series to a
stationary series. Occasionally, taking the natural logarithm of the original series will be useful in achieving stationarity (Montgomery, et al., [17]. In section 3, we will consider the stationary properties of unemployment rate time series of 30s and 40s.
3. Baseline Unemployment Prediction Models for 30s and 40s Groups
3.1 Identification of Stationarity
To identify an appropriate SARIMA model for
2009 2010 2011 2012 2013 2014 2015 2016 2017 2018 2019
30s 40s 30s 40s 30s 40s 30s 40s 30s 40s 30s 40s 30s 40s 30s 40s 30s 40s 30s 40s 30s 40s
January 3.8 2.9 3.6 2.1 2.9 2.3 3.3 2.0 2.6 2.0 2.8 2.2 2.7 2.1 3.3 2.1 3.1 2.2 3.0 2.6
Feburary 4.0 3.0 4.2 2.7 3.4 2.6 3.5 2.1 3.6 2.4 3.3 2.5 3.4 2.7 3.7 2.6 3.2 2.6 3.5 2.8
March 3.8 2.9 4.1 2.6 3.4 2.4 3.2 2.3 3.4 2.4 3.3 2.6 3.3 2.5 3.8 2.5 3.7 2.8 3.7 2.5
April 3.8 2.4 3.9 2.3 3.3 2.1 3.1 2.2 3.6 2.6 3.6 2.4 3.3 2.3 4.0 2.7 3.7 2.7 4.0 2.5
May 3.7 2.8 3.4 2.2 3.2 2.0 3.1 1.8 3.0 2.1 3.3 2.6 3.1 2.7 3.1 2.2 3.1 2.3 3.7 2.4 June 3.8 2.5 3.4 2.2 3.4 2.1 3.0 2.1 3.0 2.1 3.3 2.1 3.3 2.3 3.1 1.9 3.2 2.1 3.5 2.3 July 3.6 2.3 3.4 2.4 3.1 2.0 2.9 1.8 3.0 2.1 3.2 2.1 2.9 2.4 3.1 2.0 2.9 1.9 3.5 2.5 August 3.7 2.5 3.7 2.3 3.4 2.0 2.8 2.0 3.1 2.0 3.1 2.2 3.0 2.5 3.2 2.1 3.3 2.1 3.7 2.7 September 3.3 2.3 3.5 2.7 3.1 2.0 2.7 2.1 2.5 1.7 2.8 2.0 3.1 2.1 3.2 2.1 2.8 1.9 3.6 2.4 October 3.3 2.2 3.4 2.4 2.9 2.0 2.7 1.8 2.6 1.7 3.0 2.0 2.9 2.0 3.3 2.0 3.0 1.8 3.3 2.4 November 3.4 2.3 3.0 2.1 2.9 1.9 2.8 1.9 2.6 1.6 2.6 2.2 2.9 1.8 3.0 1.7 2.9 1.8 2.9 2.2 December 3.4 2.3 3.2 2.2 2.8 1.8 2.7 1.7 2.7 1.8 2.7 2.2 2.7 2.2 3.0 1.9 3.0 1.8 2.8 2.3 Table 1. Korea’s 30s and 40s unemployment rate (%)
(a) Raw data (b) Log-transformed data
Fig. 1. Trends of unemployment rate for 30s
unemployment rates for 30s and 40s, we first transform the original data by taking logarithm.
Changes in the level of the log-transformed series indicates that at least one difference will be required to achieve stationarity. We adjusted the time series given in Fig. 1(b) and 2(b) through the differencing the 1 degree of log-transformed series. Often in unemployment rates, the most pronounced seasonal effect is at lag 12 months.
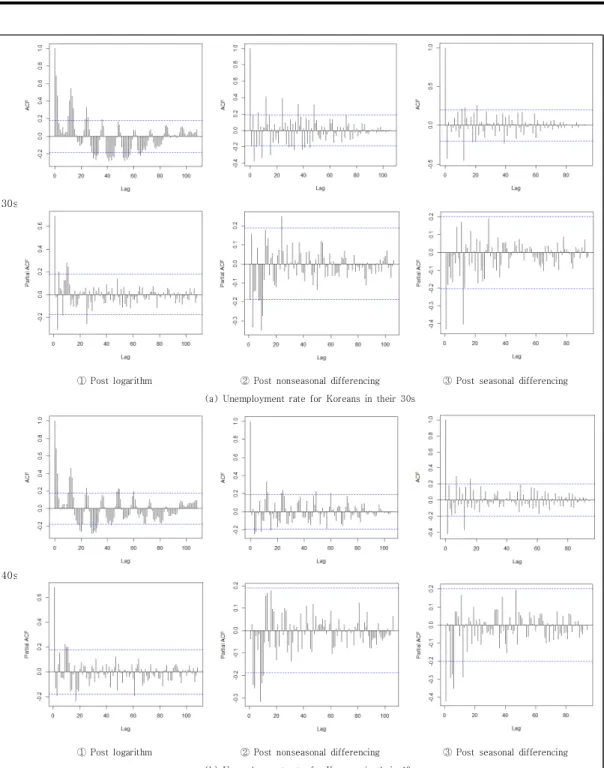
Thus, we applied the seasonal differences of lag of 12 months. For these processes of 30s and 40s, we respectively computed the sample autocorrelation function (ACF) and partial ACF (PACF). The results are shown in Fig. 3 (a) and (b) in order of ①, ②, and ③. The two-standard-error limits are plotted on the graph as dashed lines.
We see from Fig. 3(a)-①, and 3(b)-① that the sample ACFs tail off with sinusoidal decays, while the sample PACFs seem to cut off after lag 0 with several exceptions. Fig. 3(a)-② and 3(b)-② present the ACFs and PACFs, respectively for 30s and 40s. We see that similar trends of ACFs with Fig. 3(a)-① and Fig 3(b)-①, respectively. Still the sample ACF for the series of first difference display large autocorrelations, particularly at lags 12.
Finally we obtain the sample ACFs and PACFs for 30s and 40s shown in Fig. 3(a)-③ and 3(b)-③.
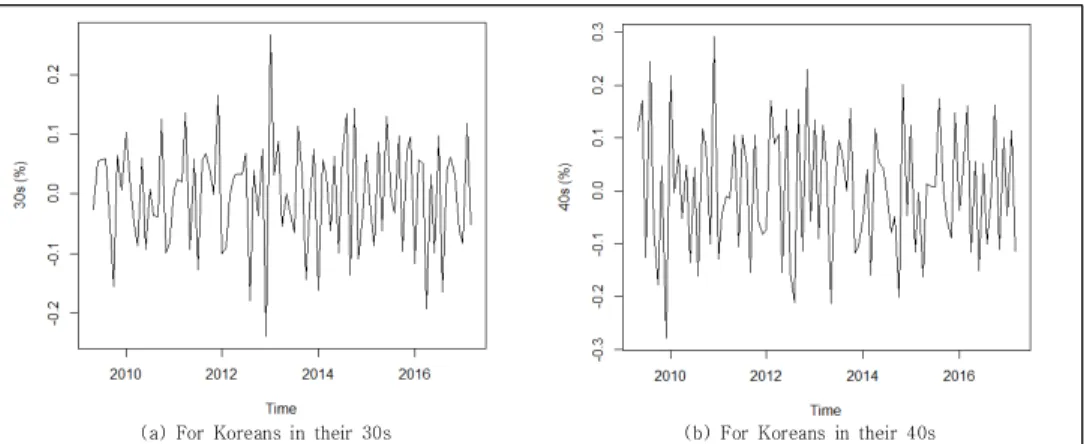
Compared to the ACFs anf PACFs of Fig. 3(a)-② and 3(b)-②, seasonal adjusted figures show the closer tendency of stationary process although the autocorrelations at lags some values are relatively large. Overall visual expressions of adjusted time series in Fig. 4 seem to be stationary processes nearly. Under the condition of stationarity of given time series (removed trend and seasonality from Fig. 1 and 2), we develop the SARIMA model to predict the unemployment rates for 30s and 40s.
To develop the desired unemployment prediction models, we applied SARIMA approach with the log-transformed unemployment rates for the 30s and 40s. The SARIMA model is classified as , where pis the number of nonseasonal autoregressive (AR) terms, d is the number of nonseasonal differences for stationarity, q is the number of nonseasonal moving average (MA) terms, P is the number of seasonal autoregressive (SAR) terms, Dis the number of seasonal differences, Q is the number of seasonal moving average (SMA) terms, and s is the seasonal period [18,19]. Using unemployment rates for period from May 2009 to April 2019 (108 months), we identify the SARIMA model. The remained data (12 months) were used for model test (prediction).
(a) Raw data (b) Log-transformed data
Fig. 2. Trends of unemployment rate for 40s
3.2 Developing SARIMA Model for 30s
To estimate the orders of SARIMA processes automatically, we employed the auto.arima() function in R (S/W) [20] and
was selected. The
is the most commonly used seasonal ARIMA model; seasonal random trend model plus MA(1) and SMA(1) terms [19].
30s
① Post logarithm ② Post nonseasonal differencing ③ Post seasonal differencing (a) Unemployment rate for Koreans in their 30s
40s
① Post logarithm ② Post nonseasonal differencing ③ Post seasonal differencing (b) Unemployment rate for Koreans in their 40s
Fig. 3. ACF and PACF plots
Table 2 lists the coefficients of the estimated SARIMA model.
Model
Coefficient MA1: -.5281
SMA1: -.8643 Akaike information
criterion (AIC) -241.82
Table 2. Estimated SARIMA model for unemployment rate of Koreans in their 30s
For this estimated model, we performed the diagnostic process of residuals. The results are shown in Fig. 5. We note that the standardized residuals show no particular pattern, and autocorrelation residuals were within the confidence range (between dotted lines). The p-values located outside the dotted line (significant range). These results indicate that the estimated model is appropriate to describe the considered time series.
Fig. 5. Diagnostic plots of the SARIMA model for unemployment rates of 30s (a) For Koreans in their 30s (b) For Koreans in their 40s
Fig. 4. Stationary process of unemployment rate for Koreans in their 30s and 40s
The can be represented as the following regressive model:
(1)
where is log-transformed unemployment rate for 30s at time t, is a coefficient of variable, and is an error term at time t. The coefficients of Equation (1) are estimated by the input method in SPSS Statistics 25. We see that the coefficient of was not significant. Applying the stepwise method yields the estimators of the coefficients of Model 1 as Table 3. Model 1 shows 57.6% of the explanatory power (: 0.576).
Substitution of model parameters gives Model 1 as
for
(2)
Predictor Unstandardized β
(Std. Error) Standardized β t Sig.
Constant .158 (.089) 1.775 .079
ln(Xt-1) .427 (.078) .423 5.464 .000
ln(Xt-12) .429 (.072) .459 5.934 .000
R2(Adjusted) .576 (.567)
Std. Error of the Estimate .0714715701 Table 3. Estimated coefficients of Model1 for 30s
3.3 Developing SARIMA Model for 40s
Applying the same procedure in Section 4.1 produces the SARIMA model for the unemployment rates of 40s as . Table 4 presents the results of estimated SARIMA model for 40s.
We performed the diagnostic process of residuals for this estimated model. The results are shown in Figure. 6. We note that the standardized residuals show no particular pattern, and autocorrelation residuals were within the confidence range (between dotted lines). The p-values located outside the dotted line (significant range). These results indicate
that the estimated model is appropriate to describe the considered time series.
Model
Coefficient
AR1: .5431, MA1: .0058, MA2: .3029, SAR1: .9993, SMA1:
-.7605, SMA2: -.2122, Intercept: .7919
AIC -207.6
Table 4. Estimated SARIMA model for unemployment rate of Koreans in their 40s
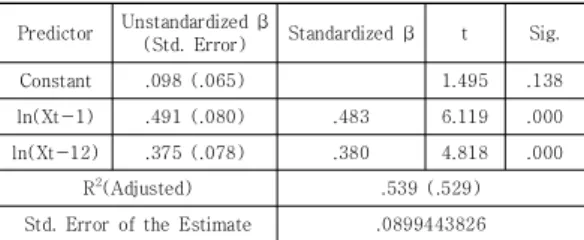
Table 5 presents the estimated coefficients of the selected SARIMA model for 40s. We note that the coefficient of was not significant as the case of 30s. Applying the stepwise method yields the estimators of the coefficients of Model 1 as Table 5. Model 1 shows 53.9% of the explanatory power.
Predictor Unstandardized β
(Std. Error) Standardized β t Sig.
Constant .098 (.065) 1.495 .138
ln(Xt-1) .491 (.080) .483 6.119 .000
ln(Xt-12) .375 (.078) .380 4.818 .000
R2(Adjusted) .539 (.529)
Std. Error of the Estimate .0899443826 Table 5. Estimated coefficients of Model1 for 40s
The estimated Model 1 for 40s can be represented as follows:
for
(3)
4. Improving Predictive Models with Google Search Queries
4.1 Collecting and Preprocessing Google Search Queries
We try to apply the web information to improve the predictability of Model 1. Korean
Google search queries were used as new predictors to estimate the unemployment rates.
Google search query information provides the value scaled from 0 to 100 as a relative frequency, which was obtained from Google Trends [21].
Previous our studies [12,13] retrieved keywords for web queries related to the Korea’s youth unemployment rate through the analysis of Korean SNS (social network service) and blog data, and found 16 Korean keywords simultaneously mentioned with unemployment rate among 577 online documents or messages in Korean (twitter: 279, blog: 298); company,
economy, employment, enter-graduate-school, join-the-army, permanent position, rental house, government, get-a-job, graduate school, job, support, unemployment, youth startup, youth unemployment, youth unemployment rate. In addition to the 16 keywords, we added the two keywords of unemployment benefits and youth
employment which showed a high correlation with unemployment rate.
Keywords Keywords
Q1 기업(company) Q10 정규직(permanent
position)
Q2 경제(economy) Q11 임대주택(rental house)
Q3 고용(employment) Q12 지원(support)
Q4 대학원진학(enter-
graduate-school) Q13 실업(unemploy- ment) Q5 정부(government) Q14 청년창업(youth startup)
Q6 취업(get-a-job) Q15 청년실업(youth
unemployment) Q7 대학원(graduate school) Q16 청년실업률(youth
unemployment rate)
Q8 일자리(job) Q17 청년취업(youth
employment) Q9 입대(join-the- army) Q18 실업급여(unempl-oyment
benefits) Table 6. 18 keywords associated with Korea’s youth
unemployment rate ([13]; Fig.6)
This study aims to improve the unemployment predictive model by use of web search queries.
Thus, we referenced the same 18 keywords Fig. 6. Diagnostic plots of the SARIMA model for unemployment rates of 40s
(Q1-Q18) used in Kwon and Jung [13] and Jung [14] (see Table 6).
We collected the time series of the monthly Korean Google search queries corresponding the unemployment rates during the same period (May, 2009-April, 2019) as defined in Table 1.
4.2 Developing Predictive Models for Unemployment Rate of 30s with Use of Google Search Queries
For a better prediction of unemployment rate, we consider a method which utilizes web query information correlated with unemployment rate.
We combine the web search information together with the SARIMA time series model of Equation (1), and build a linear model (Model 2) as follows:
(4)
where , and are the same as in Equation (1), is a coefficient of query value and are the values of search volume index log-transformed at time t.
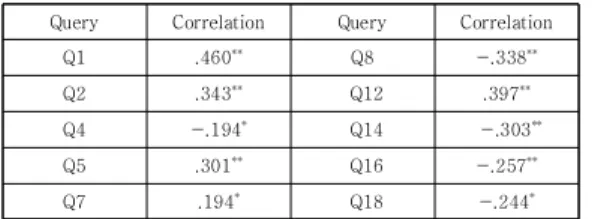
Based on the correlation analysis, the following 10 queries were selected as candidates queries for new predictors (see Table 7).
Query Correlation Query Correlation
Q1 .460** Q8 -.338**
Q2 .343** Q12 .397**
Q4 -.194* Q14 -.303**
Q5 .301** Q16 -.257**
Q7 .194* Q18 -.244*
**Correlation is significant at the 0.01 level (2-tailed)
*Correlation is significant at the 0.05 level (2-tailed)
Table 7. Google search queries correlated with Korea’s unemployment rate of 30s
The stepwise regression on the linear model of Equation (4) presents the estimated model as follows:
Predictor Unstandardized β
(Std. Error) Standardized β t Sig.
Constant .400 (.142) 2.826 .006
.450 (.077) .445 5.817 .000
.465 (.073) .497 6.387 .000
-.080 (.037) -.154 -2.172 .032
(Adjusted) .597 (.583)
Std. Error of the Estimate .0700698197
Table 8. Estimated coefficients of Model 2 for unemployment rate of 30s
We note that only the second query is selected in combined model (4) for estimating the unemployment rate for 30s.
4.3 Developing Predictive Models for Unemployment Rate of 40s with Use of Google Search Queries
Applying the same procedures in Section 5.2, we develop the predictive model to estimate the unemployment rate of 40s. Six queries in Table 9 show the correlations with the unemployment rate data for this group.
Query Correlation Query Correlation
Q1 .331** Q12 .359**
Q2 .217* Q14 -.311**
Q5 .229* Q16 -.217*
**Correlation is significant at the 0.01 level (2-tailed)
*Correlation is significant at the 0.05 level (2-tailed)
Table 9. Google search queries correlated with Korea’s unemployment rate of 40s
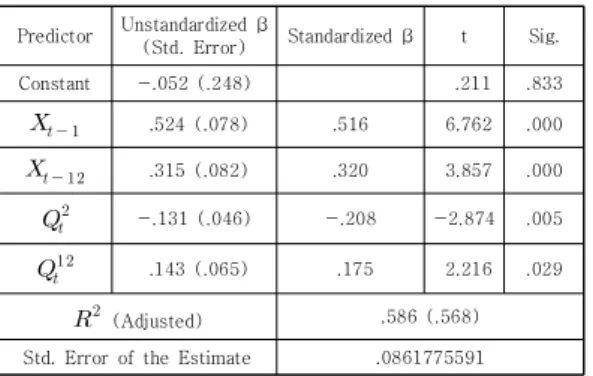
Applying the stepwise method yields the estimated model (Model 2) as follows:
Compared to the case of 30s, two keywords of
and are included in Equation (4) for estimating the unemployment rate of 40s. The explanatory power is 58.6% (: 0.586).
Comparing the results of Model 1, we note that Model 2 shows better performance with regard to the explanatory power of model.
Predictor Unstandardized β
(Std. Error) Standardized β t Sig.
Constant -.052 (.248) .211 .833
.524 (.078) .516 6.762 .000
.315 (.082) .320 3.857 .000
-.131 (.046) -.208 -2.874 .005
.143 (.065) .175 2.216 .029
(Adjusted) .586 (.568)
Std. Error of the Estimate .0861775591 Table 10. Estimated coefficients of Model 3
5. Predictive and Comparative Analysis
For both training period (first 108 months) and predictive period (remained 12 months), Model 2 shows better performances that those of Model 1 with respect to the and RMSE (root mean squared error) in estimating employment rate of 30s and 40s (see Tables 11 and 12).
Training Period Predictive Period
RMSE RMSE
Model 1 .576 .0704 .587 .0866
Model 2 .597 .0686 .700 .0738
Table 11. Comparative performance of the unemployment prediction models for 30s
Training Period Predictive Period
RMSE RMSE
Model 1 .539 .0885 .509 .1055
Model 2 .586 .0839 .711 .0809
Table 12. Comparative performance of the unemployment prediction models for 40s
For training period, Model 2 improves the value of about by 4%-9%. Also predictability of Model 2 is much better than that of Model 1 in terms of with increase of about 13%-40%.
Based on these results, we are sure that in estimating the unemployment rate, the time series
model additionally utilizing the web search queries is better than the classical time series model.
This result goes the same direction with the previous studies of Choi and Varian [10], and Kwon and Jung [13]. Selecting a set of appropriate keywords is a significant factor affecting the performance of considered model.
6. Conclusion
To implement the unemployment policies to more diverse and wider age groups, including the 30s and 40s, unemployment predictive studies form the basis for the government’s policies on employment promotion and unemployment benefits. Recent unemployment prediction studies employ advanced techniques using web search queries in addition to classical time series models. For a more advanced predictive model, we develop a model which utilize the information of Korean Google search queries together with using the classical SARIMA model specialized Koreans in their 30s and 40s.
Utilizing Google search queries information with SARIMA model demonstrated better predictability of unemployment rates than the naive model using only their time series data. We consider that web search query information will be helpful to improve the classical model for predicting Korea’s unemployment rates.
Compared to the results of a previous study, we could also identify that Google search queries (keywords) relative to Korea’s unemployment predictions differed by age group.
To implement the developed prediction models for unemployment rates among Korean in their 30s and 40s in a practical manner, this study must be furthered by exploring web search queries that are related to the unemployment rates of more diverse age groups. Recently getting appropriate information from web query is much easier, so we expect that utilizing such
information would be recommended for more accurate estimation and prediction of response such as unemployment rates.
REFERENCES
[1] J. M. Lovati. (1976). The Unemployment Rate as an Economic Indicator, Review, Issue Sep, 58(9), 2-9.
[2] Unemployment: Its Measurement and Types(Online).
https://www.rba.gov.au/education/resources/explaine rs/unemployment-its-measurement-and-types.html [3] Economically Active Population Survey(Online).
http://kostat.go.kr/portal/eng/surveyOutline/4/1/inde x.static
[4] K. Choi. (2017). Why Korea’s Youth Unemployment Rate Rises, KDI Focus, 88.
[5] Statistics Korea(Online).http://www.index.go.kr [6] Y. S. Kim. (2018). Korea’s Unemployment, GDP Growth Enter
Critical Phase.The Korea Herald(Online).
http://www.koreaherald.com/view.php?ud=20181220000289 [7] J. Burton. (2019). Solution to Korea Jobless Owes.
Koreatimes.(Online).
http://www.koreatimes.co.kr/www/opinion/2019/03/3 96_265537.html
[8] H. J. Lee. (2018).Gov’t Spends Big to Reduce Rate of Youth Unemployment. Korea Joongang Daily(Online).
http://koreajoongangdaily.joins.com/news/article/arti cle.aspx?aid=3045660
[9] N. Askitas & K. F. Zimmermann. (2009). Google Econometrics and Unemployment Forecasting, Applied Economics Querterly, 55(2),107-120.
DOI : 10.3790/aeq.55.2.107
[10] H. Choi & H. Varian. (2009). Predicting Initial Claims for Unemployment Benefits(Online).
https://static.googleusercontent.com/media/research.
google.com/ko//archive/papers/initialclaimsUS.pdf [11] C. Anvik & K. Gjelstad. (2010). Just Google It: Forecasting
Norwegian Unemployment Figures with Web Queries, Master’s Thesis, BI Norwegian School of Management.
[12] C. M. Kwon, S. W. Hwang & J. U. Jung. (2015).
Application of Web Query Information for Forecasting Korean Unemployment Rate. Journal of the Korea Society for Simulation, 24(2),31-39.
DOI : 10.9709/JKSS.2015.24.2.031
[13] C. M. Kwon & J. U. Jung. (2016). Forecasting Youth Unemployment in Korea with Web Search Queries.
LNCS 9870,3-14.
DOI : 10.1007/978-3-319-46301-8_1
[14] J. U. Jung. (2018). Comparative Usefulness of Naver and Google Search Information in Predictive Models
for Youth Unemployment Rate in Korea. Journal of Digital Convergence, 16(8), 169-179. DOI : 10.14400/JDC.2018.16.8.169
[15] J. Fuchs, D. Söhnlein, B. Weber & E. Weber. (2017).
Forecasting Labour Supply and Population: An Integrated Stochastic Model, IAB-Disscussion Paper, 1/2017.(Online).
http://doku.iab.de/discussionpapers/2017/dp0117.pdf [16] Korean Statistical Information Service(Online).
www.kosis.kr
[17] C. D. Montgomery, L. C. Jennings & M. Kulahci.
(2008). Introducing to Time Series Analysis and Forecasting, Wiley-Interscience: Hoboken.
[18] E. P. B. Box, G. M. Jenkins, G. C. Reinsel & G. M.
Ljung. (2015). Time Series Analysis: Forecasting and Control, Wiley: Hoboken.
[19] R. Nau. (2019). Statistical Forecasting: Notes on Regression and Time Series Analysis(Online). https://people.duke.edu/~rnau/411home.htm
[20] R. Hyndman. (2019). Auto.arima. RDocumentation(Online).
https://www.rdocumentation.org/packages/forecast/v ersions/8.7/topics/auto.arima
[21] Google Trends(Online). https://trends.google.com
Jae Un Jung(정재운) [정회원]
․ Feb. 2008 : Dong-A University, M,S. in MIS
․ Oct. 2010 : Dong-A University, Ph.D. in MIS
․ Mar. 2017 ~ : Dong-A University, Dept. of MIS, Assistant Professor
․ Research Area : Advanced Data Analysis, Logistics Information Systems, System Dynamics
․ E-Mail : [email protected]
Jin ho Hwang(황진호) [정회원]
․ Feb. 2000 : Dong-A University, M,S. in MIS
․ Mar. 2003 ~ : Dong-A University, Dept. of MIS, Doctoral Course
․ Aug. 2017 ~ : Strategic Engineering, CEO.
․ Research Area : Management Information Systems, Functional Safety.
․ E-Mail : [email protected]