Effect of R-Z Relationships Derived from Disdrometer Data on Radar Rainfall Estimation during the Heavy Rain Event on 5 July 2005
GyuWon Lee1,* and Byung-Huk Kwon2
1Department of Astronomy and Atmospheric Sciences, Kyungpook National University, Daegu 702-701, Korea
2Department of Environmental Atmospheric Sciences, Pukyong National University, Busan 608-739, Korea
2005년 7월 5일 폭우 사례 시 우적계 R-Z 관계식이 레이더 강우 추정에 미치는 영향
이규원1,*·권병혁2
1경북대학교 천문대기과학과, 702-701, 대구광역시 북구 대학로 80
2부경대학교 환경대기과학과, 608-739, 부산광역시 남구 신선로 365
Abstract: The R-Z relationship is one of important error factors to determine the accuracy of radar rainfall estimation. In this study, we have explored the effect of the R-Z relationships derived from disdrometer data in estimating the radar rainfall. The heavy rain event that produced flooding in St-Remi, Quebec, Canada has been occurred. We have tried to investigate the severity of rain for this event using high temporal (2.5 min) and spatial resolution (1o by 250 m) radar data obtained from the McGill S-band radar. Radar data revealed that the heavy rain cells pass directly over St-Remi while the coarse raingauge network was not sufficient to detect this rain event. The maximum 30 min (1 h) accumulation reaches about 39 (42) mm in St-Remi. During the rain event, the two disdrometers (POSS; Precipitation Occurrence Sensor System) were available: One used for the reflectivity calibration by comparing disdrometer Z and radar Z and the other for deriving disdrometric R-Z relationships. The result shows the significant improvement with the disdrometric reflectivity-dependent R-Z relationships against the climatological R-Z relationship. The bias in radar rain estimation is reduced from +12% to −2% and the root-mean squared error from 16 to 10% for daily accumulation. Using the estimated radar rainfall rate with disdrometric R-Z relationships, the flood event was well captured with proper timing and amount.
Keywords: heavy rainfall, disdrometer, radar, R-Z relationship, drop size distributions
요 약: R-Z 관계식은 레이더 강우추정의 정확도를 결정하는 중요한 요소이다. 본 연구에서는 캐나다 궤벡주의 셍레미 에서 홍수를 야기한 폭우사례에서 관측된 우적계 및 레이더 자료를 이용하여 레이더 강우추정 시 우적계 자료에서 도 출된 R-Z 관계식의 효과를 분석하였다. 이를 위하여 맥길 S-밴드 레이더에서 시간 분해능 2.5분과 공간 분해능 1o× 250 m로 관측된 레이더 반사도를 사용하였다. 레이더 반사도 자료에서는 폭우를 동반한 강우세포가 셍레미를 통과한 것으로 관측되었지만 우량계 관측망에서는 낮은 공간 분해능으로 인하여 이 세포가 관측되지 않았다. 셍레미에서 30분 과 1시간 최대 누적 강우량은 각각 39 mm와 42 mm였다. 강우사례 동안 두 개의 우적계(POSS; Precipitation Occurrence Sensor System)가 사용되었다. 하나의 우적계는 레이더 반사도와 우적계 반사도를 비교하여 레이더 반사도를 보정하고
*Corresponding author: [email protected]
*Tel: +82-53-950-6361
*Fax: +82-53-950-6359
This is an Open-Access article distributed under the terms of the Creative Commons Attribution Non-Commercial License (http://
creativecommons.org/licenses/by-nc/3.0) which permits unrestricted non-commercial use, distribution, and reproduction in any medium, provided the original work is properly cited.
하였을 때 홍수사례에 대하여 강우 발생 시간 및 강우량이 잘 일치하였다.
주요어: 폭우, 우적계, 레이더, R-Z 관계식, 우적크기분포
Introduction
Weather radars provide areal averaged rainfall information in high temporal and spatial resolution (typically 1o by 1 km) of areal averaged rainfall information. The rainfall intensity is typically derived from the radar reflectivity factor Z using known R-Z relationships1). This transformation process causes the significant error (Fujiwara, 1965; Joss and Waldvogel, 1970; Zawadzki, 1984; Lee and Zawadzki, 2005b; Lee et al., 2007; Berenguer and Zawadzki, 2008; Berenguer and Zawadzki, 2009; Tokay et al., 2009). The use of a single climatological R-Z relationship can lead to 41% error in Montreal, Quebec, Canada (Lee and Zawadzki, 2005b) and however can be significantly reduced to 7% with proper R-Z relationships that are classified with proper microphysical processes.
There were several attempts to reduce this R-Z transformation error by classifying rain events into precipitation types (stratiform/convective or drizzle) and synoptic situations (Joss and Waldvogel, 1970;
Richards and Crozier, 1983). This error is also linked with the vertical structure of precipitation (Huggel et al., 1996; Berenguer and Zawadzki, 2008). However, a practical method that can be applied in real-time is barely available beside stratiform/convective classification.
In practice, the use of dual-polarimetric radar parameters eliminates some of this uncertainty and should be noticed as an alternative.
Recent works show this R-Z transformation error has temporal and spatial coherence. The decorrelation time of this error could be longer than one hour (Lee et al., 2007). The decorrelation time is defined as the
time that the exponential correlation function drops to e−1. Lee et al. (2009) attempted to attribute this longer decorrelation time into the coherence of microphysical processes in space and time. In addition to the temporal coherence, they explored the spatial structure of the error using a coarse network of disdrometers and showed significant coherence in this error and additional microphysical parameters. In fact, the decorrelation distance of this error was significantly longer than the maximum distance (~33 km) between disdrometers in their disdrometer network.
In this paper, we try to explore the effect of disdrometer data to improve the radar quantitative rain estimations in particular at a position apart from the disdrometer location. Since the error in R-Z transformation has significant spatial correlation, the disdrometer data should in general help to reduce the error. It would be beneficial to explore this by using a dense network of disdrometer. However, we had only two disdrometers available within a radar coverage (240 km radius). We have used a case of severe thunderstorms that were developed and produced heavy rain in the south-western Québec and the Eastern Townships, Canada, on 5 July 2005. This storm caused flooding at the St.-Remi area during the early evening on 5 July 2005.
Data used are described in section 2 and the overall feature of the precipitation and its movement is shown in section 3. The proper R-Z relationship and radar rainfall estimation are performed in section 4. The flood event is analyzed in terms of radar rainfall estimations.
1)The expression of Z-R relationship is commonly used. However, the Z is an independent variable and R is a dependent variable. Thus, the expression of R-Z is more relevant than that of Z-R.
Data
We have used three types of data: 1) radar data from the McGill S-band radar, 2) disdrometric data from two Precipitation Occurrence Sensor Systems (POSS), and 3) rain amount from 12 gauges within 240 km radius from the radar.
The McGill S-band radar is located at the west end of the metropolitan Montreal (see Fig. 1: Latitude=
45.425 and longitude= −73.936 degree) and performs a full volume scan every 5 minutes with 6 rpm. A volume scan is composed with two sets of 12 elevation Plan Position Indicators (PPIs). Typically, these two sets of 12 PPIs are combined after
correcting the movement of precipitation system. In this study, we have used these two sets separately to improve the temporal resolution of radar data, that is 2.5 minutes instead of 5 minutes. The period of 21:00 LST 4 July 2005 to 19:00 LST 5 July 2005 is selected.
Instead of using the radar reflectivity at a constant altitude PPI (CAPPI), the lowest radar reflectivity that are free from the ground echo above gauge locations is used to estimate rainfall intensity. The reflectivity at 1.5 km CAPPI is used to examine the movement and general characteristics of precipitation systems.
The POSS is a bi-static continuous wave x-band radar that measures power spectra. These power spectra are converted into the drop size distributions every minute by an iterative procedure using the known drop diameter – terminal fall velocity relationship obtained by Gunn and Kinzer (1949). The sampling volume of POSS is three orders of the magnitude larger than that of the typical disdrometer such as Joss-Waldvogel disdrometer. Thus, the POSS is less affected by the undersampling error (Sheppard, 1990;
Sheppard and Joe, 1994; Lee and Zawadzki, 2005a).
The detail description of POSS can be found in Sheppard (1990). In this study, we have used disdrometer data from two POSSs: One (POSS1) located at the McGill radar site and the other (POSS2) at the P. E. Trudeau International Airport. The distance between two POSSs are about 16 km and these disdrometers are about 31 km and 25 km apart from the St-Remi. The POSS1 is used to calculate the Fig. 1. Locations of McGill S-band radar, two POSSs, and
St-Remi where there were flooding.
Table 1. Surface raingauge stations of Environment Canada that are used in the comparison with radar rainfall estimation. The nearest gauge to St-Remi is St-Clothilde
Stations Latitude (degree) Longitude (degree) Daily accumulation (mm)
P. E. Trudeau airport 45.467 -73.75 62.2
McTavish 45.505 -73.579 49.9
St-Hubert 45.517 -73.417 26.0
L'Acadie 45.294 -73.350 21.8
L'Assomption 45.81 -73.435 29.4
St-Clothilde 45.167 -73.679 11.2
St-Jovite 46.067 -74.550 12.0
St-Anicet 45.117 -74.283 39.8
Ottawa Macdonald-Cartier 45.317 -75.667 12.4
Ottawa CDA RCS 45.367 -75.717 9.4
Moose Creek 45.25 -74.95 2.0
St-Polycarpe 45.300 -74.300 20.0
proper R-Z relationship and POSS2 to calibrate the McGill S-band radar by the calibration method of Lee and Zawadzki (2006). The calibration bias of 2.5 dB is obtained and applied. The 12 gauges are used for the comparison and their locations are shown in Table 1. They are located within 140 km from the radar. The maximum rainfall appears at the P. E. Trudeau International Airport (~62.2 mm). The nearest raingauge, St-Clothilde, to St-Remi showed about 11.2 mm and does not have any clues on the flood in St-Remi.
Overall Features of Precipitation Systems
There were two main periods of rain during 4 July and 5 July 2005 (see Figs. 2 and 3). Total rainfall accumulation at the P. E. Trudeau International Airport reached 62.2 mm (Table 1) that is a maximum amount since 1970 during the month of July. About 86% of this total rain fell during the two periods around 02:12 LST and 17:35 LST. The characteristic of radar Fig. 2. Radar reflectivity maps (or transformed rainfall intensity) at 1.5 km height from 0154 LST to 0224 LST on 5 July 2005. A moderate rain cell (30-40 mm h−1 rainfall rate) passes over the municipality of St-Remi around 02:14 LST. About 8 mm of rain amount is recorded at St-Remi during this period. The municipality of St-Remi is indicated with the arrow.
reflectivity around the St.-Remi (indicated by black arrows) shows interesting feature. First period (01:50- 02:20 LST: Fig. 2) shows relatively moderate reflectivity (or rainfall intensity). Rainfall intensity reaches 20-40
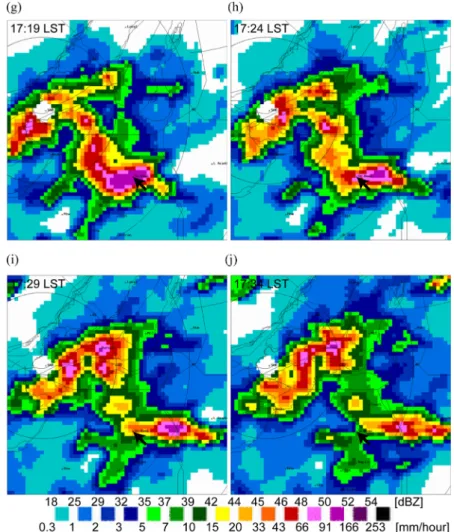
mm h−1. As convective cells approach to St-Remi, they intensify and move quickly to the west. Maximum rainfall intensity (over 100 mm h−1) occurs in the west of St-Remi. Another strong rain cell develops as the Fig. 3. Radar reflectivity (rainfall intensity) maps for the second period from 16:49 LST to 17:34 LST on 5 July 2005 with five minutes interval. Strong convective cells are located at the south of Montreal Island. They develop into an organized and strong convective system and directly pass over St-Remi. Rainfall intensity reaches 170-250 mm h−1. The municipality of St-Remi is indicated with the arrow.
system approach into the airport area. The mean system speed is about 50-60 km h−1.
The second period (17:00-18:00 LST: Fig. 3) showed extreme rains during a short time period.
Strong convective rain systems are less organized around 16:49 LST as they pass over the south of the radar site (Beauhanois area) but still have rain intensity over 100 mm h−1. A meso-cyclone (black square area) is identified from the Doppler radial velocity with possible genesis of tornados. As they approach to St-Remi, they intensify and form an extremely heavy rain and well-organized thunderstorm.
Rainfall intensity reaches over 200 mm h−1. The core of this system is located at south and south-east of Beauhanois. Later on, this core directly hits the
municipality of St-Remi from 17:14 LST although this core becomes slightly weaker. Rain over 100 mm h−1 lasts about 10-15 minutes. This system becomes weaker and moves to east. From these radar images, we clearly see that the main core of severe thunderstorms passes over St-Remi during the second period and torrential rains pour over this area.
However, heavier rain occurs in the east of St-Remi.
The size of these heavy rainfall areas is about 20-30 km which cannot be properly resolved by the current coarse raingauge network around metropolitan Montreal area. In addition, the municipality of St-Remi is located in between two nearby gauges (about 30 km apart).
Thus, the heavy rain cells that pass over St-Remi are completely missed by the current gauge network.
Fig. 3. Continued.
Time-series of radar-measured reflectivity (Fig. 4a) and estimated rainfall rate (Fig. 4b) in St-Remi are shown. The rainfall rate is estimated from measured radar reflectivity with derived R-Z relationships introduced in section 3. These figures well illustrate the previous description. There are two main periods of rain: 1) 01:50-02:20 LST and 2) 17:00-18:00 LST.
For the first period, rainfall intensity has a maximum of about 100 mm h−1 and is less than 10 mm h−1 for the overall period. However, for the second period, heavy rain over 10 mm h−1 lasts about 25 minutes with a maximum of about 200 mm h−1 at 17:30 LST.
Then, the moderate rain follows over 1 hour.
Radar Rainfall Estimation
Rainfall intensity (R) – Radar reflectivity (Z) relationship.
Radar measured radar reflectivity (Z) should be transformed with known R-Z relationships to estimate rainfall intensity and then, accumulation. This relationship can be derived from rain drop size distributions (DSDs) measured by a disdrometer. We have used the disdrometer data (Fig. 5a) obtained from the POSS1 that is located at the radar site (POSS 2 is used to calibrate the radar). Measured DSDs show the systematic evolution of the shape of exponential function. The slope becomes broader with increasing rainfall intensity (from cold to warm colors). Then the number concentration at the smaller sizes dramatically decreases and vice versa for bigger sizes. For the Fig. 4. Time series of observed radar reflectivity (left) and estimated rainfall rate (right) from McGill S-band radar on 5 July 2005 at St-Remi (latitude=45.2627 degree and longitude= −73.579), Quebec, Canada. The temporal resolution of radar data is 2.5 minutes.
Fig. 5. (a) Measured drop size distributions (DSDs) from POSS (Precipitation Occurrence Sensor System) at the radar site on 5 July 2005.The color indicates the rainfall intensity from weak rain (purple) to heavy rain (red). (b) R-Z relationships that are used to estimate rainfall rate for the case of 5 July 2005. Data (circles) are obtained from POSS disdrometer. The climatological relationship is adapted from Lee and Zawadzki (2005b).
From these measurements of rain drop size distributions, N(D)[m−3 mm−1], rainfall intensity R[mm h−1] and radar reflectivity Z[mm6 m−3 or dBZ in 10logZ] are calculated with the following equations:
(1) (2)
The scatterplot in Fig. 5b shows that the actual data points are deviated from the climatological R-Z relationship (Z=210R1.47) in Montreal area. Here, the climatological R-Z relationship is derived from the 5- yr disdrometric data set (Lee and Zawadzki, 2005b).
The climatological relationship will overestimate rainfall intensity up to 45 dBZ and underestimate when Z>45 dBZ. In this case, a single relationship does not satisfy the entire range of Z.
Typically, a power law R-Z relationship is used and is based on the scaling law between different moments of drop size distributions (Sempere-Torres et al., 1998;
Lee et al., 2004). In this case, the scatterplot clearly indicates a single power law relationship is not relevant. Thus, we have divided the data set into two categories with respect to Z=45 dBZ and derived two R-Z relationships with the weighted total least squared fit (WTLS). The WTLS properly explains the measurement noise in the fitting and thus provides relationships less affected by the disdrometric measurement noise (Lee and Zawadzki, 2005a). The polynomial fit is another way but did not show any improvement against two reflectivity-dependent relationships in this case.
Two reflectivity-dependent relationships are calculated:
Z=329 R1.43 for Z<45 dBZand Z=1106 R1.03 for Z 45 dBZ. When Z<45 dBZ, the coefficient is larger than the climatological one, indicating overestimation in R by the climatological relationship. When Z 45 dBZ, the exponent approaches to the unity, that can be expected by the equilibrium between collision/coalescence
number concentration rather than the diameter (see Fig. 5a). These two equations are used to estimate rainfall intensity/amount from measured radar reflectivity.
Note that radar reflectivity of 54 dBZ provides rainfall intensity over 200 mm h−1. Since the total rainfall amount is highly controlled by heavy rain, the improper R-Z relationship that cannot well explain the heavy rain can lead to significant error in radar rain estimation. The climatological R-Z relationship is also used for comparison.
Comparison of daily rain accumulation from radar and gauges
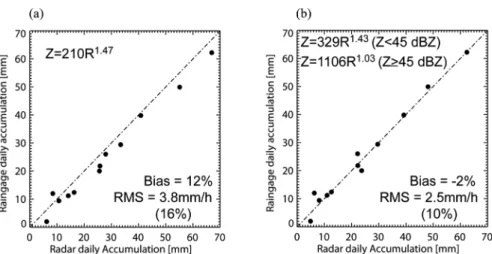
To investigate the accuracy of daily rain accumulation from radar, we compare daily accumulation from rain gauges and from radar. Twelve gauges (Table 1) from surface meteorological stations of Environment Canada are selected. Radar rain accumulation is derived from high temporal resolution data (2.5 minutes). First, rainfall intensity is calculated from each 2.5-minute datum at a resolution of 1 km by 1 deg. using the climatological R-Z relationship and two reflectivity- dependent R-Z relationships in Fig. 5b. Then, it is converted into 2.5 minute accumulation which is subsequently added to obtain daily total rain amount.
Fig. 6 shows the scatterplots of radar-derived and gauge-measured daily accumulations. In general, radar- derived accumulation is in a good agreement with that from rain gauges.
However, two approaches (climatological R-Z and two reflectivity-dependent relationships) show significant difference. The climatological relationship overestimates the daily accumulation about 12% and the root mean square error is 16%. However, when the two reflectivity- dependent relationships are used, the bias is removed and the root mean square error is reduced to 10%.
This significant improvement suggests that the two used R-Z relationships well represent overall areas within the radar coverage. In addition, this result indicates the S-band radar is properly calibrated during R 6π 10–4 v D( )D3N D( )dD
Dmin Dmax
×
∫
=
Z D6N D( )dD
Dmin Dmax
∫
=
this period. This is very interesting result that emphasizes the spatial coherence of the R-Z relationship or of the R-Z transformation error (Lee et al., 2009).
Although the R-Z relationship is derived from a single point within radar coverage from which gauge locations are far (maximum 140 km), this relationship is still applicable to improve the accuracy in rain estimation. Thus, this result alludes the potential use of disdrometer networks to improve the accuracy of radar rainfall estimation. However, the density of disdrometer is still in question and should be explored further.
Rainfall Accumulation Around the Municipality of St-Remi
In the previous section, it was shown that the uncertainty of radar rainfall estimation is 10%. It is reasonable to assume that this accuracy should be also applicable if there is no significant deteriorating factors such as bright band, ground clutter, long range from the radar, etc. In particular, St-Remi is about 31 km away from the radar and this area does not show any significant contamination by ground clutter. In this section, we will investigate the heavy rainfall event on 5 July 2005 that caused the flood at St-Remi using radar rainfall estimation.
The cumulative rainfall accumulation in St-Remi
(Fig. 7) well illustrates this flooding event. As in Fig.
6b, the two reflectivity-dependent R-Z relationships are used to improve the accuracy. The two curves are shown: One (solid line) from the reflectivity data at a radar pixel over St-Remi and the other (dotted line) at a radar pixel that produced the maximum rain within 5 km (radial direction) by 2.5 km (azimuthal direction).
Radar estimated total accumulation is about 55.8 mm in St-Remi on 4-5 July 2005. This amount is drastically different from the rainfall amount from the nearest rain gauge, St-Clothilde (=11.2 mm). There are two abrupt increases associated with the two main rain Fig. 6. A scatterplot of radar-derived and gauge-measured daily rain accumulation at 12 surface stations of Environment Can- ada. The climatological and two reflectivity-dependent R-Z relationships are used to estimate rainfall intensity from radar data.
Fig. 7. Cumulative rain accumulation around St-Remi. The solid line is obtained at St-Remi (latitude=45.2627 degree and longitude −73.579 degree) while the dotted line is a maximum accumulation in an area of 5 km (range) by 2.5 km (azimuthal direction) that is centered at St-Remi. Note a dramatic increase of rain amount around 17:14 (LST).
periods that are explained in section 3. In particular, the sudden increase during the second period around 17:30 LST is remarkable. The variation of accumulation is over 40 mm during 10-15 minutes. This is related to the passage of strong reflectivity echoes explained in section 3. The maximum cumulative accumulation (dotted line) should show even heavier rain during this second period. Total maximum accumulation is slightly greater than that in St-Remi. This means the peak rain area actually does not passed St-Remi. In addition, the variation of rain accumulation around 17:14 LST is dramatic. It changes from 5 mm to 57 mm. This indicates the severity of rain around St- Remi during the second period.
To investigate the severity of rain at shorter time periods, we have calculated 30 minute (left panels in Fig. 8) and 1 hour accumulation (right panels in Fig.
8) every 2.5 minutes. The top panels show 30 minute and 1 hour accumulation for the entire period and the bottom panels is an inset of the top panel during the
second heavy rain period. The solid line indicates accumulation in St-Remi and the dotted line means maximum accumulation at an area of 5 km by 2.5 km centered in St-Remi. During the first period, maximum 30-minute accumulation is only 8 mm and maximum 1 hour accumulation is about 9 mm. However, the maximum 30-minute accumulation reaches about 39 mm in St-Remi and 46 mm at the surrounding area.
The maximum 1 hour accumulation is about 42 mm in St-Remi and 49 mm at the surrounding area. Thus, we can conclude that the flood event occurred in St-Remi is associated with heavy rain for shorter than 30 min.
Conclusion
The heavy rainfall event had occurred around south- western Québec and the Eastern Townships on 5 July 2005. Flash flood is reported at St-Remi, Quebec, Canada. The current coarse gauge network does not provide detailed information on this rain event, Fig. 8. Time series of rain accumulation for 30 min (left panels) and 1 h (right panels). Temporal resolution of rain accumula- tion is 2.5 minutes. Bottom panels show rain accumulation during the heavy rain period (17:00-18:00 LST). Note that 30-min accumulation reaches 39 mm with a maximum of 46 mm around St-Remi and that 1-hour accumulation reaches 42 mm with a maximum of 49 mm.
especially around the municipality of St-Remi. The nearest rain gauge is about 10 km far from St-Remi.
In this short paper, we have tried to investigate the severity of rain for this event using high temporal and spatial resolution radar data obtained from the McGill S-band radar located at the west end of the metropolitan Montreal. Radar rain accumulation is in a good agreement with gauge measurements. Radar data revealed that the heavy rain cells pass directly over St-Remi. The coarse gauge network is not sufficient to resolve these heavy rain cells. Heavy rains occur during the period between 17:00 LST and 18:00 LST around St-Remi. The maximum 30 min (1 h) accumulation reaches about 39 (42) mm at St-Remi and 46 (49) mm at a small surrounding area.
We have investigated the effect of disdrometer derived R-Z relationship on radar rainfall estimation.
Two POSSs were located within the radar coverage:
one used for the radar reflectivity calibration and the other for deriving R-Z relationships. Compared with gauge measurements, the daily rain accumulation derived from the climatological R-Z relationship overestimates. However, the use of two derived reflectivity-dependent R-Z relationships reduced the bias and random error significantly, leading to accurate rainfall estimation. This result illustrates the spatial coherence of R-Z relationships or of the error structure due to R-Z transformation.
As illustrated by Lee et al. (2009), the spatial error structure has long de-correlation distance. Thus, the R- Z relationship derived from a disdrometer away from an interest area should help to improve the accuracy of the rainfall estimation. However, it is important to investigate the influence distance of disdrometric R-Z relationship and furthermore relevant density of disdrometer networks that can improve radar rainfall estimation in real-time. It is recommended to further explore the spatial structure of R-Z transformation error with dense disdrometer networks and their application for real-time radar rainfall retrieval.
Acknowledgment
This work was funded by the Korea Meteorological Administration Research and Development Program under Grant CATER 2012-2072.
References
Berenguer, M. and Zawadzki, I., 2008, A study of the error covariance matrix of radar rainfall estimates in stratiform rain. Weather and Forecasting, 23, 1085-1101.
Berenguer, M. and Zawadzki, I., 2009, A study of the error covariance matrix of radar rainfall estimates in stratiform rain. Part II: Scale dependence. Weather and Forecasting, 24, 800-811.
Fujiwara, M., 1965, Raindrop-size distribution from individual storms. Journal of Atmospheric Sciences, 22, 585-591.
Gunn, R. and Kinzer, G.D., 1949, The terminal velocity of fall for water droplets in stagnant air. Journal of Meteorology, 6, 243-248.
Huggel, A., Schmid, W., and Waldvogel, A., 1996, Raindrop size distributions and the radar bright band.
Journal of Applied Meteorology, 35, 1688-1701.
Joss, J. and Waldvogel, A., 1970, A method to improve the accuracy of radar measured amounts of precipitation. Proceedings of the fourteenth conference on Radar Meteorology, American Meteorological Society, Tucson, USA, 237-238.
Lee, C.K., Lee, G., Zawadzki, I., and Kim, K.E., 2009, A preliminary analysis of spatial variability of raindrop size distributions during stratiform rain events. Journal of Applied Meteorology and Climatology, 48, 270-283.
Lee, G.W., Zawadzki, I., Szymer, W., Sempere-Torres, D., and Uijlenhoet, R., 2004, A general approach to double-moment normalization of drop size distributions.
Journal of Applied Meteorology, 43, 264-281.
Lee, G.W. and Zawadzki, I., 2005a, Variability of drop size distributions: Noise and noise filtering in disdrometric data. Journal of Applied Meteorology, 44, 264-281.
Lee, G.W. and Zawadzki, I., 2005b, Variability of drop size distributions: Time scale dependence of the variability and its effects on rain estimation. Journal of Applied Meteorology, 44, 241-255.
Lee, G.W. and Zawadzki, I., 2006, Errors in the radar calibration by gauge, disdrometer, and polarimetry:
Theoretical limit and application to operational radar.
time. Journal of Applied Meteorology and Climatology, 46, 742-756.
List, R., Donaldson, N.R., Stewart, R.E., 1987, Temporal evolution of drop spectra to collisional equilibrium in steady and pulsating rain. Journal of Atmospheric Sciences, 44, 362-372.
List, R., 1988, A linear radar reflectivity-rainrate relationship for steady tropical rain. Journal of Atmospheric Sciences, 45, 3564-3572.
Richards, W.G. and Crozier, C.L., 1983, Precipitation measurement with a C-band weather radar in southern Ontario. Atmosphere-Ocean, 21, 125-137
Sempere-Torres, D., Porrà, J.M., and Creutin, J.-D., 1998, Experimental evidence of a general description for raindrop size distribution properties. Journal of Geophysical Research, 103, 1785-1797.
Sheppard, B.E., 1990, Measurement of raindrop size
size distribution measurements by a Joss-Waldvogel disdrometer, a PMS 2DG spectrometer, and a POSS Doppler radar. Journal of Atmospheric and Oceanic Technology, 11, 874-887.
Tokay, A., Hartmann, P., Battaglia, A., Gauge, K.S., Clark, W.L., and Williams, C.R., 2009, A field study of reflectivity and Z-R relations using vertically pointing radars and disdrometers. Journal of Atmospheric and Oceanic Technology, 26, 1120-1134.
Zawadzki, I., 1984, Factors affecting the precision of radar measurements of rain. Proceedings of the twenty-second conference on Radar Meteorology, American Meteorological Society, Zurich, Switzerland, 251-256.
Zawadzki, I. and Antonio, M.A., 1988, Equilibrium raindrop size distributions in tropical rain. Journal of Atmospheric Sciences, 45, 3452-3459.
2012년 11월 8일 접수 2012년 11월 22일 수정원고 접수 2012년 12월 3일 채택