최 기 흥
한성대학교 기계기스템공학과 (2009. 9. 2. 접수 / 2011. 11. 21. 채택)
Control Strategy for Industrial Safety Based on Dynamic Modeling of Safety Budget-Industrial Accidents Relationship
Gi Heung Choi
Department of Mechanical Systems Engineering, Hansung University (Received September 2, 2009 / Accepted November 21, 2011)
Abstract : This study focuses on the control strategy for industrial safety in Korea. Specifically, the effect of safety budget such as the industrial accident prevention fund on the safety performance to prevent and reduce industrial ac- cidents is statistically examined first and modeled as a second order system. The effectiveness of such a dynamic model is also explained with a simple PI control mechanism in a feedback loop. The simulated model, however, suggests that, without improving the efficiency of the safety system, extra safety budget needed to decrease the accident rate to a level in advanced countries is far beyond the social consensus. An efficient way of reducing industrial accidents based on such a dynamic model with more internal damping but with less elastic nature in a feedback loop framework needs to be implemented.
Key Words : safety assessment, safety budget, accident rate, PI control
1. Introduction*
Safety activities by government, industries and non- government organizations(NGOs), in general, require a safety budget whose source may vary depending on the types of their activities. Design of the safety-gua- ranteed industrial environment is, in particular, important since it determines the ultimate outcomes of industrial activities involving safety of workers. Looking back the past 20 years, the accident rate in Korea was drasti- cally reduced to less than half of that 20 years ago.
Despite the increasing efforts these days to prevent and reduce the industrial accidents, however, the accident rate has stayed almost constant over the last few years.
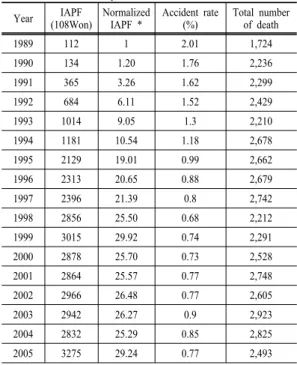
Table 1 shows this point clearly. Since the year 1997, the rate has not improved much from a value between 0.7% and 0.8%.
Safety policies and safety management in industrial work places in Korea are known to be non-systematic
Table 1. Industrial accident prevention fund(IAPF), accident rate and total number of deaths in industrial accidents over the 20 years1)
Year IAPF
(108Won) Normalized
IAPF * Accident rate
(%) Total number of death
1989 112 1 2.01 1,724
1990 134 1.20 1.76 2,236
1991 365 3.26 1.62 2,299
1992 684 6.11 1.52 2,429
1993 1014 9.05 1.3 2,210
1994 1181 10.54 1.18 2,678
1995 2129 19.01 0.99 2,662
1996 2313 20.65 0.88 2,679
1997 2396 21.39 0.8 2,742
1998 2856 25.50 0.68 2,212
1999 3015 29.92 0.74 2,291
2000 2878 25.70 0.73 2,528
2001 2864 25.57 0.77 2,748
2002 2966 26.48 0.77 2,605
2003 2942 26.27 0.9 2,923
2004 2832 25.29 0.85 2,825
2005 3275 29.24 0.77 2,493
nagement system, a more realistic and efficient safety management system is required to prevent further loss of lives and minimize the related property damages2).
Table 2 shows that the fatality rate in Korea (number of death in industrial accidents per 10,000 workers) is about 5 to 10 times greater than that of Japan and most of major European countries3-5). Note that UK uses different measures for calculating accident rate and, therefore, these values in Table 2 are not directly compatible with data in other countries.
It is noted in Table 1 and Table 2 that the current safety management system is neither able to cope with the increasing demand for a safer work place nor ef- fective in terms of reducing the accidents and saving lives and properties of workers and industries, respec- tively. Therefore, a new method to enhance the overall performance of the safety management system must be devised and implemented.
Among many factors that affect the safety of wo- rkers in general, the safety budget is known to have the fastest and the most significant influence on preven- ting and reducing industrial accidents2). Another ad- vantage of the safety budget over other safety factors is that it is easily controlled and, therefore, easy to evaluate its performance. Among the various types of safety budgets, attention needs to be paid to the in- dustrial accident prevention fund(IAPF) which is dis-
Table 2. Industrial accident rate in major countries3-5) Country Number of death per 10,000 workers
due to industrial accidents
Korea 1.47
Japan 0.3
Germany 0.26
UK 0.07
France 0.35
Sweden 0.14
Australia 0.14
fety budget such as IAPF on the safety performance in Korea is statistically examined. The role and control performance of IAPF are particularly addressed to re- duce the related accidents. The effectiveness of IAPF- industrial accident rate relationship is then explained with a simple PI control mechanism.
2. Safety budget-accident rate relationship
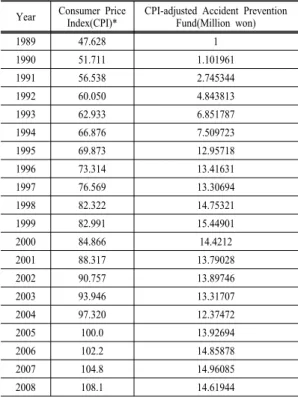
Fig. 1 graphically shows the trends of IAPF and the industrial accident rate over the past 20 years (from 1989 to 2008). In the figure, accident prevention fund was adjusted first using consumer price index over the past 20 years in Table 3, and then normalized using the value in the beginning year 1989. The industrial accident rate was also normalized for comparison pur- pose to fit to the form
α1+β(1 −α2) (1)
where α1( = 0.3) is the target value of accident rate (accident rate in Japan), α2 is the actual(current) acci- dent rate and β is the proportionality constant. β is the difference between the accident rate (0.71) in the last year of the past 20 year period(2008) and the target value (0.3).
Ignoring various factors that might affect the accident rate other than safety budget, the figure indicates a striking similarity and, therefore, a remarkable corre- lation between them. This implies that one can model a system that has the normalized IAPF as input and the accident rate as output.
A discrete time model that best matches the input- output relationship was then identified to be
(2)
(a)
(b)
Fig. 1. Comparison of the normalized IAPF (a) and the accident rate (b) over the past 20 years in Korea.
Table 3. Normalized accident prevention fund as adjusted using consumer price index over the past 20 years.
Year Consumer Price Index(CPI)*
CPI-adjusted Accident Prevention Fund(Million won)
1989 47.628 1
1990 51.711 1.101961
1991 56.538 2.745344
1992 60.050 4.843813
1993 62.933 6.851787
1994 66.876 7.509723
1995 69.873 12.95718
1996 73.314 13.41631
1997 76.569 13.30694
1998 82.322 14.75321
1999 82.991 15.44901
2000 84.866 14.4212
2001 88.317 13.79028
2002 90.757 13.89746
2003 93.946 13.31707
2004 97.320 12.37472
2005 100.0 13.92694
2006 102.2 14.85878
2007 104.8 14.96085
2008 108.1 14.61944
* CPI is assumed to be 100 in 2005
Fig. 2. Comparison of the actual accident rate with the si- mulated values from the model over the past 20 years.
The model in Eq.(1) was identified to minimize the root mean squared error between the model output and the actual output. The corresponding continuous time model is
(3)
In order to verify the identified model, the output (accident rate from the model in Equation (2)) was ge- nerated using the actual input in Table 1 and compared with the actual output (the accident rate in Fig. 1) in Fig. 2.
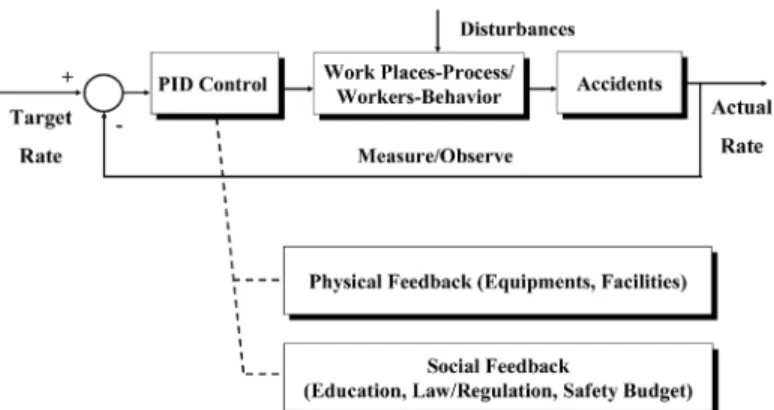
3. A framework for control mechanism In order to model the industrial accident prevention fund-industrial accident rate relationship and find a useful mechanism that can control the accident rate, a feedback model for the safety management system is considered as shown in Fig. 3. In the figure, the system model (open-loop system) is a work place-process or worker-behavior model with industrial accident preven- tion fund as the input and the actual industrial accident rate as the output. Any difference between the target accident rate (input to the feedback system) and the ac- tual accident rate (output of the feedback system) works to drive physical and social efforts to improve safety environment. The actual rate is the result of all the safety activities based on the physical and social feed- back. For example, one may invest on upgrading and automating equipments and facilities, educate his em- ployees to comply with safety rules in the work places, ask government to update or upgrade any unreasonable
Fig. 3. Feedback control model of industrial accident prevention fund – industrial accident rate relationship.
or ineffective safety-related laws. All these are the con- trol variables to drive the safety management system as targeted. After all, the government and its agency need safety budgets to perform all these safety activities and achieve the target accident rate. Then, a question arises as to how effectively the government can control the situation with the safety budget. In this study, the safety budget such as IAPF is considered as a feedback control variable and a framework to enhance its control performance in the feedback model is suggested.
4. Simulations
The accident rate in Fig. 1 shows that as the efforts for prevention in terms of budget saturated over the last several years, the accident rate appears to converge to the value of 0.7% and stays within a narrow band thereafter. Fig. 1 also indicates that the accident rate does not seem to converge to the target value of 0.3%
or so in Japan and major European countries in Table 2. Such tendency strongly implies that the safety budget such as IAPF needs to be increased to further decrease the accident rate to the level in advanced countries which is 0.3%.
Assuming that a system model of work place-process or worker-behavior in Korea has a typical second order system in Equation (4) with IAPF as input, such sta- tistical data in Table 1 indicates that the safety system model in Korea has the form of type zero system (N = 0 in Equation (2)) and so does the system transfer func- tion. Type zero system has no pole at the origin of the s-plane and, therefore, inherently has no integral action in the system.
(4)
The most widely used form of a feedback controller is a PID controller. A PID controller is a controller with three terms in which the output of the controller is the sum of a proportional term, an integrating term and a differentiating term, with an adjustable gain for each term. This controller typically has functional sim- plicity and exhibits robust control performance under a wide range of conditions. The selection of three gains of a PID controller is basically a search problem in a three dimensional space. However, in the case dis- cussed in this study, a gain for the differentiating term may be ignored for simplicity.
A simulation study was performed using a simul- ation software package7) to see whether the control ob- jective can be met with P-control only. Then, starting with the accident prevention fund which was 371.6 billion won in 2008, calculate how much extra fund is needed to hit the target rate by the year 2030 which is 22 years after 2008. The safety system model given in Equation (3) was used for simulation. The result for a type zero system with only a proportional gain in ne- gative feedback is shown in Fig. 4 and Fig. 5. A type zero system with P-control only has no pole at the origin of the s-plane and, therefore, can’t make the per- manent error zero as shown in Fig. 4. Extra fund needed is, however, within the manageable range. What Fig.
4 and Fig. 5 suggest is that the current safety system model coupled with only P-action tends to find an eq- uilibriumstate with less input and permanent error. Any
Fig. 4. Accident rate over the next 10 years with P-action only in the feedback loop.
Fig. 5. Extra safety budget needed to accomplish accident rate in Fig. 3 over the next 10 years.
safety policy based on the error between the target rate and the actual (current) rate will fail to track the target accident rate.
In order to eliminate the permanent error between target accident rate and the actual rate, one needs to include an integral action of the form given in Equation (5) in the feedback controller:
(5)
The appropriate gains for proportional and integral actions in the feedback controller can be found to drive the actual accident rate to the target value.
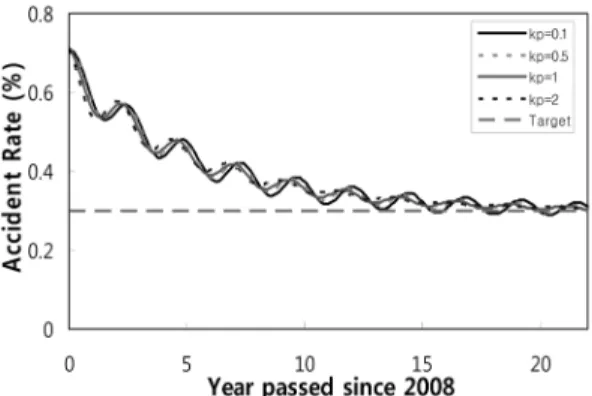
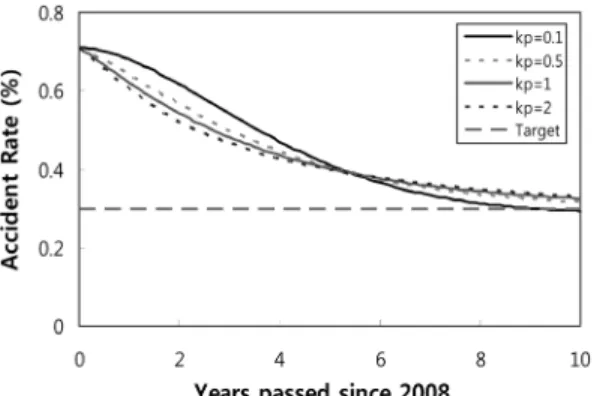
Fig. 6 shows the simulated result with PI action in the feedback loop. In the figure, it is clearly shown that the target accident rate can be met by incorporating I-action in the feedback loop. The extra IAPF to be put on every year in addition to the amount in the year 2008 is, however, increases drastically and reaches to
Fig. 6. Accident rate over the next 22 years with PI-action in the feedback loop.
Fig. 7. Extra safety budget needed to accomplish accident rate in Fig. 6 over the next 22 years.
approximately 4.5 trillion won in the year 2030 as shown in Fig. 7. This is more than 12 times the fund in 2008. Our safety system model in Equation (3) also exhibits the oscillatory behavior as expected. Then, a method that uses IAPF to reduce the accident rate more efficiently or a policy to alter the safety system model to a more efficient one needs to be devised.
As noted in Equation (2), the safety system model in concern inherently has the stronger internal elastic nature than the damping nature. The safety system model has to be altered accordingly so that the system exhibits more damping nature than elastic nature. For example, when the safety system model in Equation (2) is mo- dified to the one with more internal damping with less elastic nature it is represented by
(2) The simulated result is shown in Fig. 8 and Fig. 9.
Fig. 8. Accident rate over the next 22 years with PI-action in the feedback loop.
Fig. 9. Extra safety budget needed to accomplish accident rate in Fig. 8 over the next 22 years.
The gain ki was set to 1 for the simulation. What these figures imply is that effort in industrial safety activities in Korea needs to be directed toward modifying the internal structure of the safety system. This may cost a little but guarantee a more efficient way to reduce the accident rate to the target level.
5. Conclusions
In this study, the effect of a safety budget such as industrial accident prevention fund (IAPF) on the safety
cident rate to the target value. The amount of IAPF required to reduce the accident rate from the current level to the target level, however, was found to be far beyond the social consensus. As the simulation example suggests, a more efficient safety system model with more internal damping with less elastic nature needs to be devised and implemented in the future.
Acknowledgement : This study was supported by the Hansung University in the year of 2010.
References
1) Annual Industrial Accident Report, KOSHA, 1989~
2008.
2) Gi Heung Choi, “A Framework for Control of Safety Budget-Industrial Accidents Relationship”, Int. J. Sa- fety, Vol. 7, No. 2, 2008.
3) The 2nd 5-year Industrial Accident Prevention Plan (2005~2009), Ministry of Labor, 2005(in Korean).
4) Trends in International Industrial Safety and Health [1], KOSHA, 2006(in Korean).
5) Policies and Systems for Industrial Accident Preven- tion in France and Germany, Ministry of Labor, 2007 (in Korean).
6) Tae Gu Kim, et al, “Effect Analysis of Financial Su- pporting Work for Factory and Future Development Direction”, Research Report, KOSHA, 2006(in Korean).
7) MATLAB Users Guide, Mathworks, Inc., 2006.