Convergence Evaluating Food Safety Knowledge, Attitude, and Practice regarding Food handler
Junghyun Kim 1 , Youngtae Cho 2*
1
Ph.D. Candidate, Department of Public Health, Graduate School of Public Health, Seoul National University
2
Professor, Department of Public Health, Graduate School of Public Health, Seoul National University
식품취급자의 식품안전에 대한 지식, 인식 및 행태의 융합적 평가
김정현 1 , 조영태 2*
1
서울대학교 보건대학원 보건학과 박사과정수료,
2서울대학교 보건대학원 보건학과 교수
Abstract This study aimed to assess the level of food safety knowledge, attitude and practices (KAP) among 500 Food handlers of hospitals in Korea and to explore the association between their knowledge, attitude and practices (KAP) and the socio-demographic characteristics. Self-reported questionnaire contains 50 questions: 15 for knowledge, 15 for attitude, and 20 for practice on food safety. The results showed that the overall mean of the knowledge score is 3.25, attitude 3.65, and practice 3.36 respectively. There was a significant difference between the mean score for knowledge, practice and overall KAP in three aged groups. Also, the overall KAP scores were significantly ( p < 0.05) affected by the education level, where the average scores increased with the level of education. Public health preventive education and program should be provided to the food handlers in order to minimize foodborne hazards.
Key Words : Convergence, Knowledge, Attitude, Practices, Food safety, Food handler
요 약 본 연구는 국내 의료기관 500명의 식품 취급자들의 식품안전에 관한 지식, 인식 및 행태 수준을 평가하고 지식, 인식, 행태와 사회인구학적 특성과의 연관성을 분석하였다. 자가보고 설문지는 식품안전에 관한 지식 15문항, 인식 15 문항, 행태 20문항 등 총 50문항으로 구성되었으며 연령별, 교육수준별, 경력별에 따른 지식, 인식, 행태와 KAP과의 관련성분석은 t 또는 ANOVA test를 실시하였다. 분석 결과 식품안전에 관한 평균 지식점수는 3.25, 인식 3.65, 행태 3.36으로 나타났다. 연령그룹별 식품안전에 관한 지식, 인식, KAP score는 차이가 나타났으며, KAP과 교육수준과의 관련성은 교육수준이 증가할수록 KAP score가 증가하는 것을 확인하였다(P < 0.05). 식품위해를 최소화하기 위해서 식품 취급자에게 공중보건학적차원의 지속적인 식품안전 예방교육 및 프로그램을 제공해야 할 것으로 사료된다.
주제어 : 융합, 지식, 인식, 태도, 식품안전, 식품취급자
*Corresponding Author : YoungtaeCho([email protected]) Received April 16, 2019
Accepted June 20, 2019
Revised May 31, 2019 Published June 28, 2019
1. Introduction
Although the complexity of food safety problems is growing, the government's food safety management policy and administrative system
are not responding appropriately to these
changes. Millions of people worldwide suffer
from food-borne illness and disease resulting
from the consumption of contaminated food,
which has become one of the most wide spread
public health problems in the contemporary world[1]. Food-borne diseases are attributed to a large number of bacteria, parasites, viruses and toxic chemicals[2]. Knowledge, attitude and practice (KAP) play major role in the incidence of food poisoning[3]. Food poisoning is not only the ignorance of food hygiene, but also the lack of applying the acquired knowledge[4]. Especially, there are chances of food handlers spreading food poisoning by dealing contaminated food[5].
There are some studies which has evaluated food handlers’ knowledge, attitude, and practice towards food safety[5-13]. Also, High School and college students other than food handlers were evaluated on food safety by the Knowledge, attitude and practice (KAP) and based on this data, research was conducted[14-21]. According to the Knowledge, attitude and practice (KAP) evaluation research, the food handlers who received education on food safety scored higher on the assessment than the group who did not[5, 9-10]. As for the college students, male students were superior on knowledge and practice than female students and students who were majoring in health related studies scored higher on knowledge and attitude[14-17]. Many studies were conducted to evaluate Food safety knowledge, attitude and practices on university students. Only target populations for Knowledge, attitude and practice (KAP) studies on food safety were university students and there were no studies which examined the knowledge and practice of food poison among staff or food handlers in hospital. Thus, the aim of this study was to assess the knowledge, attitudes and self-reported practices relevant to food safety of Food handler of hospital in Korea.
2. Materials and Methods 2.1 Sample collection and variables
A cross-sectional study was conducted among food handlers through self-reported questionnaires during1
stSeptember to 31
stDecember in 2016.
We examined a total of 516 consecutively enrolled food handlers working in hospital located in two regions in Korea (Seoul and Gyonggi) during this period. Subjects with less than the age and those who didn’t comply with questionnaires were excluded from this study.
The final study sample included 500 subjects.
Written consent forms were signed by the study participants. Self-reported questionnaire contains 50 questions: 15 for knowledge addressing ‘foodborne disease standards’, 15 for attitude addressing of
‘contamination prevention and disinfection procedures’, ‘safe times and temperatures for cooking’ and storing food’, and 20 for practice addressing ‘foods that increase risk of foodborne disease’ and ‘common food sources of foodborne disease pathogens’ on food safety.
Each correct answer scored 1 point and incorrect answer scored 0 point and score for knowledge, attitude, and practice ranged from 1 to 5 using Likert-scale. Cronbach’s alpha reliability coefficient for valid questionnaire was 0.824. In the study, demographic variable included gender, age, educational level, carriers (service period). Age was categorized into three groups: 30-39, 40-49, and over 50. Educational level was divided into less than high school and over college. The Carrier was classified into three groups: less than 3, 3-5 and more than 5 years in current job position.
2.2 Statistical analysis
STATA software(version 12.0: StataCorp,
College Station, TX) for Window was used for the
statistical analysis. Descriptive statistics were
used to analyze general characteristics. T-test
and ANOVA test was used for comparison of
knowledge, attitude, practice, and Knowledge,
attitude and practice (KAP) according to
education level, carrier, and age respectively. The results were presented as mean (SD) or frequency (percentage). Two-sided P-value < 0.05 was considered statistically significant.
3. Result and discussion
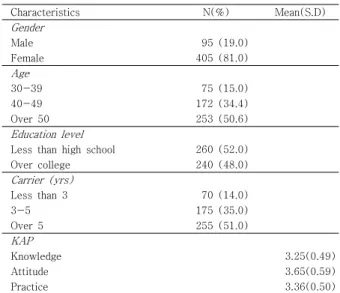
General characteristics of the study participants was shown in Table 1. Overall, male subjects are 19% and female ones are 81%. Among age variable, age is 30-39(15.0%), 40-49 (34.4%), and over 50 (50.6%) respectively. In educational level, the respondents have acquired a less than high school (52.0%) or over college (48.0%). The Carrier duration is less than 3 (14.0%), 3-5 (35.0%), and over 5yrs (51.0%). The overall mean of the knowledge score is 3.25, attitude 3.65, and practice 3.36.
Difference of knowledge, attitude and practice according to age, education, and carrier was presented in Table 2. There was a significant difference between the mean score for knowledge, practice and overall Knowledge, attitude and practice (KAP) in three aged groups:
“30-39”, “40-49”, and “over 50”. However, only the mean score of attitude in three aged groups was not significantly different (p >0.05), the aged 30-39 mean Knowledge, attitude and practice (KAP) score was 3.35±0.49 and that for 40-49 and Over 50 was 3.42± 0.47 and 3.49± 0.46 separately. The mean scores for Knowledge, attitude and practice (KAP) were higher for the aged over 50 compared to those for 30-39 and 40-49.
The overall Knowledge, attitude and practice (KAP) scores, knowledge, attitude, and practice were significantly (P < 0.05) affected by the education level, where the average scores increased with the level of education. This study was carried out to investigate the Knowledge, attitude and practice (KAP) regarding the prevention of food poisoning of employees in Korean hospital. The subjects’ knowledge,
attitude, and practic e (KAP) were evaluated on Likert-scale (5 point) and it was found out that the average point of knowledge was 3.25, attitude 3.65, and practice 3.36; the Knowledge, attitude and practice (KAP) score regarding to food poisoning prevention of the subjects were average. The research shows that scores on knowledge tended to be lower than the attitude and practice scores, and this characteristic is a common phenomenon in other research conducted from different groups of people as well[22-27].
However, several research[8-13] that were based on another group of handlers showed that the score on knowledge were the highest, followed by attitude and practice; for the college students, the knowledge score was the highest as well[2,15-16].
The subjects’ socioeconomic status (SES) and their scores on the Knowledge, attitude and practice (KAP) were compared and it was found out that the more elderly the subjects, the higher were the scores on the attitude and practice on food safety. Also the more education received, higher scores on knowledge, attitude, and practice were noted.
The research of the correlation of age and
Knowledge, attitude and practice (KAP) scores on
food handlers[7] as well as the research done on
college students[14] showed that the more elderly
the subjects, the Knowledge, attitude and
practice (KAP) scores were higher. However,
according to the Siow Oi Nee[14], the age of the
restaurant employees did not have any
significant effect on the Knowledge, attitude and
practice (KAP) scores, and also the college
student study[8,25] did not show any significant
correlation between the students’ age (or their
school year) and the Knowledge, attitude and
practice (KAP) food safety scores. Just like the
many other studies[7-9], the tendency of highly
educated people scoring high on the Knowledge,
attitude and practice (KAP) on this evaluation
has led to the conclusion that the level of
education has significant effect on the Knowledge,
Characteristics Knowledge p
aAttitude p
aPractice p
aKAP p
aAge
0.013** 0.087 0.011** 0.013**
30-39 3.18(0.53) 3.58(0.59) 3.30(0.49) 3.35(0.49)
40-49 3.26(0.52) 3.66(0.57) 3.33(0.44) 3.42(0.47)
Over 50 3.31(0.45) 3.71(0.60) 3.45(0.53) 3.49(0.46)
Education level
0.039** 0.048** 0.001** 0.014**
Less than high school 3.19(0.54) 3.61(0.58) 3.37(0.50) 3.41(0.51)
Over college 3.30(0.44) 3.69(0.60) 3.35(0.48) 3.45(0.42)
Carrier (yrs)
0.623 0.293 0.009** 0.334
Less than 3 3.23(0.50) 3.69(0.59) 3.25(0.47) 3.39(0.49)
3-5 3.25(0.49) 3.59(0.59) 3.39(0.49) 3.41(0.46)
Over 5 3.27(0.48) 3.67(0.59) 3.44(0.50) 3.46(0.47)
All values are shown as mean ± SD for continuous nonparametric variable, or n (%) for categorical variables.
a
Calculated by t test or ANOVA test.
**