INTRODUCTION
With increasing fertilizer consumption, phosphate, have accumulated in the uplands soils and green- houses in Korea. Over time, phosphate levels have exceeded optimum ranges for plant growth and so have created new agricultural and environmental problems. A national soil survey revealed that the content of available phosphate (P) reached 350 mg kg-1 in the 1970s and increased to over 450 mg kg-1 in the 1990s, markedly exceeding the optimum range of 130-220 mg kg-1 for plant production1). Despite this P accumulation, phosphate fertilizer is
still applied to the soil every year during plantation due to very low P solubility and availability as a result of precipitation and adsorption in the soil.
Phosphate adsorption in the soil is influenced by the presence of organic matter and inorganic anions, such as silicate, sulfate, and hydroxyl2,3). Particularly, silicate strongly competes with phosphate for adsorption sites on different soil components4,5). Silicate and phosphate adsorbed by the same specific exchange mechanism and specific-surface sites onto Fe and Al oxides6). Addition of silicate to soil7)and Mg8) reduced P adsorption and increased its availability.
The ability of silicate to compete with phosphate is highly pH-dependent because silicic acid (H4SiO4) is weakly dissociated below pH 9.7, which limits it's effectiveness to compete with orthophosphate acid (H3PO4) in the pH-range of most soil. Higher
Reduction of Phosphate Adsorption by Ion Competition with Silicate in Soil
Yong Bok Lee1) and Pil Joo Kim2,3)*
1)National Institute of Agricultural Science & Technology, RDA, Suwon, 441-707, South Korea
2)Division of Applied Life Science (BK21), Gyeongsang National University, Jinju, 660-701, South Korea
3)Institute of Agriculture and Life Science, Gyeongsang National University, Jinju, 660-701, South Korea (Received November 15, 2007, Accepted December 15, 2007)
ABSTRACT: To increase phosphate (P) availability in soils, the efficiency of silicate (Si) in reducing P adsorption was investigated by competitive adsorption tests under changing conditions of pH, ion concentrations, and order of anion addition along with single adsorption properties of each ion at 20°C. In the single ion adsorption study, P and Si ions showed the opposite reaction patterns: phosphate adsorption decreased with increasing pH and attained adsorption maximum however, silicate adsorption increased with increasing pH without attaining adsorption maximum. Phosphorus and Si adsorption were influenced by pH in the range of 5.0 - 9.0 and the type and amount of P and Si concentration. Silicate added to soil before P or in a mixture with P significantly reduced P adsorption above pH 7.0; however, there was no significant Si-induced decreased in P adsorption at pH 5.0 when anions were added as mixture. The efficiency of Si in reducing P adsorption increased with increasing Si concentration and pH. The effect of P on Si adsorption was relatively small at pH 5.0 and no effect of P on silicate adsorption was observed at pH 9.0.
The presence of Si strongly depressed P adsorption when Si was added before P compared to P and Si added as a mixture. These results suggest that application of Si may decrease P adsorption and increase the availability of P in soils. Furthermore, a Si source would be better to add before P application to enhance the availability of P in soils.
Key Words: silicate, phosphate, competitive adsorption, phosphate availability in soils
*Corresponding author:
Tel: +82-55-751-5466 Fax: +82-55-757-0178 E-mail: [email protected]
286
levels of solution P following addition of Si to soils high in accumulations P result from replacement of P by Si 9). The enhancement of P availability would be a key measure in reducing the amount of phosphate fertilizer and consequently decreasing the P accumulation in the soil. Although many researchers have shown that silicate competes with phosphate for adsorption sites on soil, however, the quantitative information about the efficiency of Si in reducing P adsorption as function of pH is limited. The objectives of this study were to determine the effect of Si concentration as functions of pH (5.0-9.0) and the order of P and Si addition on P adsorption on soil.
MATERIALS AND METHODS
Soil selection and analysis
Samples (0-15 cm) collected from an unfertilized alpine soil were air-dried and crushed to pass a 0.5-mm sieve. The physical and chemical properties of the soil were determined as follows: pH (1:5 water extraction), organic matter content by the Walkley and Black method as described by Allison10), available P content (5 g of soil were extracted with 20 ml of 0.33 M CH3CHOOH, 0.15 M lactic acid, 0.03 M NH4F, 0.05 M (NH4)2SO4 and 0.2 M NaOH at pH 4.25)11). Ammonium acetate (pH 7.0)-exchangeable Ca, Mg, and K were determined by atomic absorption spectrophotometry. Particle size distribution was analyzed by the pipette method12) and cation exchangeable capacity (CEC) was determined by the 1 N CH3COONH4 method11). Oxalate-extractable iron and Al oxide contents were measured using the McKeague and Day13) method. The surface area of the < 2 m-fraction was measured by sorption ofμ N2at liquid N2temperatures14). Total P was determined after digestion with conc. HClO4using the ascorbic acid method15)
The soil selected was of silt loam texture (SL, 21% clay, 61% silt and 18% sand). Available P content (4.0 mg kg-1) was below the optimum range (130-220 mg kg-1) for plant cultivation1) and indicated a virgin soil not affected by fertilization (Table 1). The content of total P was 325 mg kg-1 and water soluble P was below the detection limit by the ascorbic acid method15).
P and Si single adsorption at different pHs
Silicate adsorption studies were carried out at pH 5.0, 7.0 and 9.0 using 1 g soil samples that were placed in 50 ml polypropylene centrifuge tubes with 20 ml of silica at concentrations in the range of 0 ~ 2.3 mM Si L-1 using Na2SiO3 in 0.1 M NaCl, whose pH was previously adjusted with 0.1 M HCl or 0.5 M NaOH. Phosphate adsorption was characterized at concentrations in the range of 0 ~ 5.0 mM P L-1 with KH2PO4 in 0.1 M NaCl, whose pH was previously adjusted with 0.1 M HCl or 0.5 M NaOH. The suspensions were shaken for 12 h at 20°C on a reciprocating shaker.
P and Si competitive adsorption at different pHs The experiments on the competition between P and Si were carried out at pH 5.0, 7.0, and 9.0 (i) by adding to the soil mixtures of P (0~5 mM L-1) and Si (0, 0.5, 1.0 and 2.0 mM L-1) and (ii) by adding 0 to 5 mM P L-1 to the soil equilibrated previously by each concentration of Si (0, 0.5, 1.0, and 2.0 mM L-1) at the same pH. The anions were added to the soil as described below:
P and Si added as a mixture (P+Si system).
Solutions containing both P and Si were added to 1 g of soil samples in 20 mL of 0.1 mol L-1 NaCl, whose pH was previously adjusted. The suspensions were shaken for 12 hrs at 20°C.
Si introduced before P (Si/P system). To flasks containing 1 g of the soil in 20 mL of 0.1 mol L-1 NaCl, whose pH was previously adjusted, silicate Table 1. Physical and chemical properties of the soils
used in the adsorption test Parameters
pH (1:5 with H2O) OM (g kg‐1)
Available P (mg kg‐1) Total P (mg kg‐1) Fe2O3 (g kg‐1) Al2O3 (g kg‐1)
Ex. cations (cmolc kg‐1) CaMg
CEC (cmolK c kg‐1) Surface area (m2 g‐1)
5.23.6 3254.0 2.364.71
0.492.0 0.169.7 53 OM, organic matter; Ex. cations, exchangeable cations;
CEC, cation exchange capacity
solutions were added. After 12 hrs, phosphate solutions were added and the suspensions were shaken for an additional 12 hrs.
In all the experiments, two drops of toluene were initially added to each tube to inhibit microbial activity. The pH of the suspensions was periodically adjusted with 0.1 M HCl or 0.5M NaOH to maintain the target pH. At the end of the shaking periods, the samples were centrifuged for 5 min at 5,000 rpm, and the supernatant filtered through a 0.45 μ m mixed cellulose ester membrane filter. The supernatant was analyzed for P using the ascorbic acid method15)and Si in the solution was determined colorometrically using the method of Prince16). Levels of adsorbed P and Si were calculated based on the reduction in the concentration of the initial solution.
RESULTS AND DISCUSSION
Adsorption Isotherms of P and Si
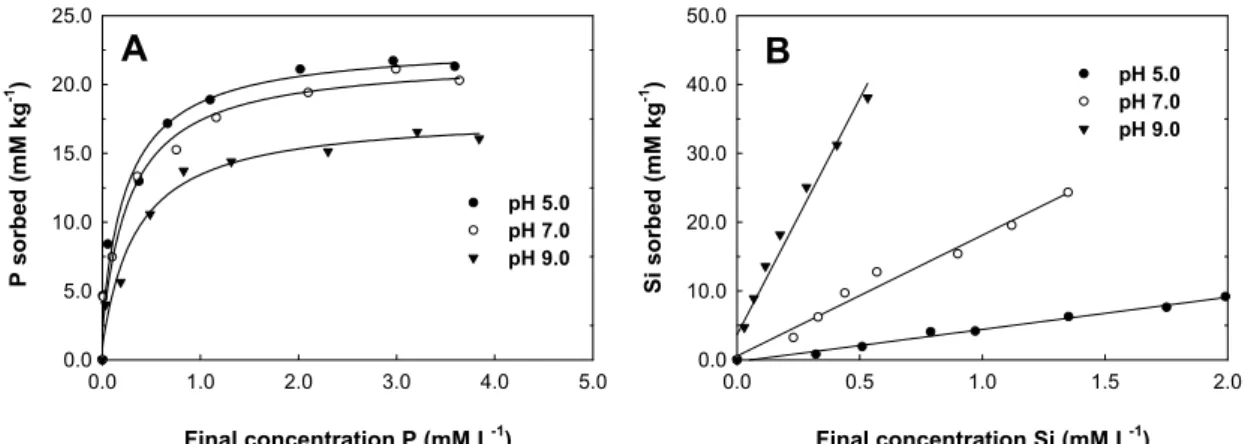
Figure 1 shows the adsorption isotherms for P (Fig. 1A) and Si (Fig. 1B) on the selected soil at pH of 5.0, 7.0, and 9.0. The adsorption data of P for the range of concentrations studied conformed to the Langmuir equation S = SmKc/(1 + Kc), where S is the amount of adsorbate taken up per unit mass of adsorbent (mmol kg-1), Sm is the maximum amount of adsorbate that may be bound, c is the equilibrium solution concentration of the adsorbate (mmol L-1), and K is a constant related to the adsorption energy2). To calculate the P adsorption maximum and K constant, the adsorption data for phosphate was plotted as the linear form of the Langmuir
equation (Table 2). The isotherm for P adsorption showed typical Langmuir characteristics and the calculated adsorption maximum decreased with pH increase from 22.3 mmol kg-1 at pH 5.0 to 17.3 mmol kg-1 at pH 9.0.
The amount of Si adsorbed increased linearly with increasing pH from 5.0 to 9.0. Phosphate adsorption decreased with increasing pH and approach adsorption maximum at all pH's. Miller et al.17) reported that Si adsorption by goethite is a L type, which implies that adsorption does not approach a fixed values. Hingston et al.18)determined the adsorption envelope by shaking goethite sample in solutions sufficiently concentrated with Si to ensure maximum adsorption. The Si maximum occurred at about pH 9.2, just below the pKa (9.7) of silicic acid6). Multilayer silicate formation at the soil surface19) is the reason that Si adsorption could not reach a constant value.
Competitive Adsorption of P and Si
Phosphate adsorption was affected by the order of P and Si addition, Si concentration and pH.
Figure 2 shows the amounts of P adsorbed at different Si concentrations and pH when P was added as a mixture with Si (Si+P system) and after equilibration with Si (Si/P system). The P adsorption maximum were slightly decreased by addition of 20 and 40 mM kg-1 of Si in both systems at pH 5.0 but it was drastically decreased by Si in both systems at pH 7.0 and 9.0, especially in Si/P system (Table 2). These results indicated that the ability of Si to compete with P increases with rising pH because the pKa value of silicic acid
Final concentration P (mM L-1)
0.0 1.0 2.0 3.0 4.0 5.0
P sorbed (mM kg-1 ) 0.0 5.0 10.0 15.0 20.0 25.0
pH 5.0 pH 7.0 pH 9.0
Final concentration Si (mM L-1)
0.0 0.5 1.0 1.5 2.0
Si sorbed (mM kg-1 ) 0.0 10.0 20.0 30.0 40.0 50.0
pH 5.0 pH 7.0 pH 9.0
A B
Fig. 1. Isotherms for the adsorption of phosphate (A) and silicate (B).
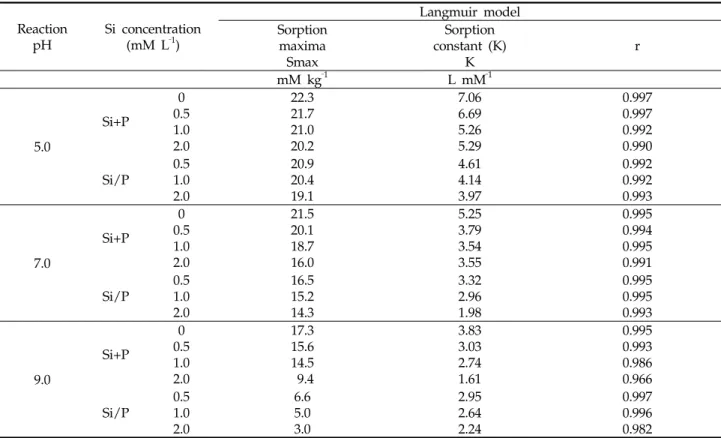
Table 2. Langmuir sorption isotherm parameters for P sorption on soil.
Reaction
pH Si concentration (mM L‐1)
Langmuir model Sorption
maxima Smax
Sorption constant (K)
K r
mM kg‐1 L mM‐1
5.0
Si+P
0.50 1.0 2.0
22.321.7 21.0 20.2
7.066.69 5.26 5.29
0.997 0.997 0.992 0.990
Si/P 0.5
1.02.0
20.9 20.419.1
4.61 4.143.97
0.992 0.992 0.993
7.0
Si+P
0 0.51.0 2.0
21.5 20.118.7 16.0
5.25 3.793.54 3.55
0.995 0.994 0.995 0.991
Si/P 0.5
1.02.0
16.515.2 14.3
3.322.96 1.98
0.995 0.995 0.993
9.0
Si+P
0.50 1.0 2.0
17.315.6 14.5 9.4
3.833.03 2.74 1.61
0.995 0.993 0.986 0.966
Si/P 0.5
1.0 2.0
6.65.0 3.0
2.952.64 2.24
0.997 0.996 0.982 Note) Si+P; phosphorus and silica added as a mixture
Si/P; Silica added before phosphorus
Final concentration P (mM L-1)
0.0 1.0 2.0 3.0 4.0
P sorbed (mM kg-1) 0.0 5.0 10.0 15.0 20.0 25.0
Final concentration P (mM L-1)
0.0 1.0 2.0 3.0 4.0
P sorbed (mM kg-1) 0.0 5.0 10.0 15.0 20.0 25.0 P sorbed (mM kg-1)
0.0 5.0 10.0 15.0 20.0
25.0 A (pH 5.0)
Si 10 mM kg-1 Si 20 mM kg-1 Si 40 mM kg-1
B (pH 5.0)
A (pH 7.0) B (pH 7.0)
A (pH 9.0) B (pH 9.0)
Fig. 2. Effects of pH and silicate concentration on P adsorption by soil. (A is P+Si system, B is Si/ P system)
(H4SiO4 ; 9.7) is higher than orthophosphoric acid (H3PO4 ; 2.1). Similar results were obtained by Brinkman20).
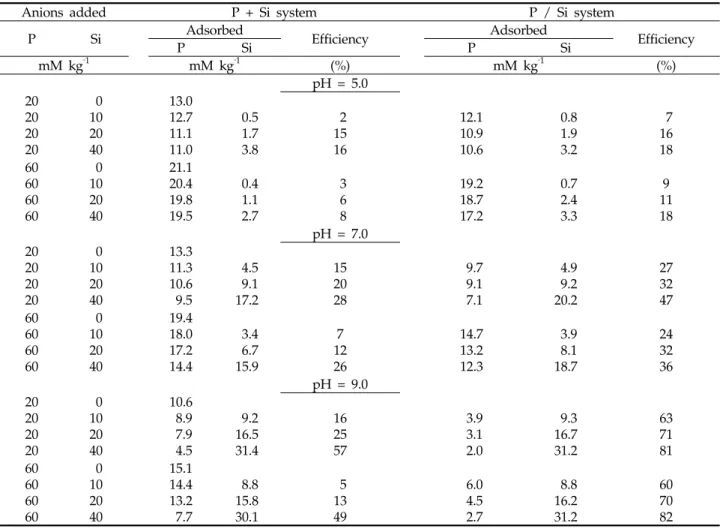
The amount of P adsorption was less in Si/P system than in Si+P system at all pH and Si concentrations (Fig 2 and Table 3) and the difference in the amount of P adsorbed between the Si/P and Si+P systems increased with increasing pH at the same Si concentration. For example, when 60 mM P and 40 mM Si kg-1 added, the amount of P adsorption was 19.5 mM kg-1 in Si+P system and 17.2 mM kg-1 in Si/P system at pH 5.0, 14.4 mM kg-1 in Si+P system and 12.3 mM kg-1 in Si/P system at pH 7.0, 7.7 mM kg-1 in Si+P system and 2.7 mM kg-1 in Si/P system pH 9.0 (Table 3). These results could explain that, when silicate is adsorbed before phosphate addition, the number of site available for phosphate on soil was reduced, thus the
amount of P adsorption may be higher in P+Si system than in Si/P system.
The percent efficiency of Si in preventing P adsorption was calculated according to the expression of Deb and Datta21):
Efficiency of Si (%) = (1 - Psi/ Po) × 100.
Where Psi is the P adsorption in the presence of Si, and Po is the single P adsorption. The efficiency of Si in preventing P adsorption increased with increasing pH in all experiments and the efficiency was higher in the Si/P system compared to the P+Si system. For example, in the 20 mM Si kg-1 and 60 mM P kg-1of Si/P system, the efficiency of Si in decreasing P adsorption was 11% at pH 5.0, 32% at pH 7.0 and 70% at pH 9.0. The efficiency of Si increased by 10% when Si was introduced before P (Si/P system) in 60 mM P kg-1 and 40 mM Si kg-1 at pH 7.0, compared with P and Si
Table 3. Amounts of P and Si adsorbed on soil and the efficiency of Si (%) in reducing P adsorption at different pH.
Anions added P + Si system P / Si system
P Si PAdsorbedSi Efficiency P Adsorbed Si Efficiency
mM kg‐1 mM kg‐1 (%) mM kg‐1 (%)
pH = 5.0 2020
2020
100 2040
13.012.7 11.111.0
0.51.7 3.8
152 16
12.110.9 10.6
0.81.9 3.2
167 18 6060
6060
100 2040
21.120.4 19.819.5
0.4 1.12.7
3 68
19.2 18.717.2
0.7 2.43.3
9 1118 pH = 7.0
2020 2020
100 2040
13.311.3 10.69.5
4.5 17.29.1
15 2028
9.7 9.17.1
4.9 20.29.2
27 3247 6060
6060
100 2040
19.418.0 17.214.4
3.46.7 15.9
127 26
14.713.2 12.3
3.98.1 18.7
2432 36 pH = 9.0
2020 2020
100 2040
10.68.9 7.94.5
16.59.2 31.4
1625 57
3.93.1 2.0
16.79.3 31.2
6371 81 6060
60 60
100 20 40
15.114.4 13.2 7.7
15.88.8 30.1
135 49
6.04.5 2.7
16.28.8 31.2
6070 82 Note) Si+P; phosphorus and silica added as a mixture
Si/P; Silica added before phosphorus
added as a mixture (P+Si system). In the Si+P system, the efficiency of Si was significantly higher at low P levels added (20 mM kg-1) than at the high P levels added (60 mM kg-1) at three pHs, but its difference was very little in the Si/P system (Table 3). When Si added first, the adsorption of Si on soil was not largely affected by phosphate concentration added.
McKeague and Cline24) reported that dissolved Si concentrations in most river waters was from 0.2 to 0.6 mM and the Si concentration in soil solution is generally 0.1-0.6 mM22,23). In our experiments, the Si concentration was higher than levels of Si found in natural waster and soil solution and showed the Si can reduce the adsorption P onto soil. Therefore, additional Si application could improve P availability in the soil by reducing P adsorption.
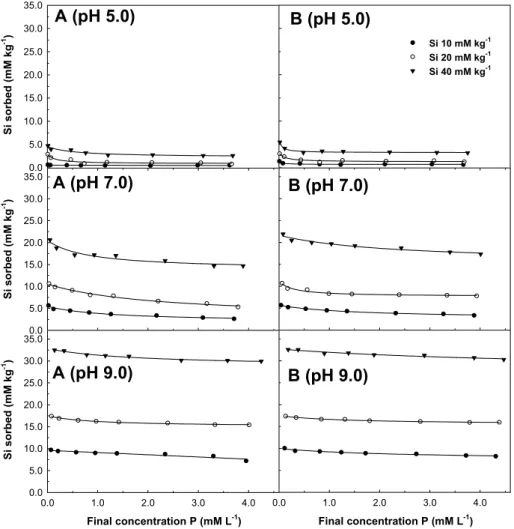
The effect of order of Si and P addition also influenced the amount of Si adsorption, but the
effect was not as much as for P adsorption (Fig 3 and Table 3). In the Si+P systems, at 20 mM Si and P kg-1, the amounts of Si and P adsorbed were 11.1 mM P kg-1and 1.7 mM Si kg-1 at pH 5.0, 10.6 mM P kg-1 and 9.1 mM Si kg-1 at 7.0, and 7.9 mM P kg-1 and 16.4 mM Si kg-1 at 9.0 (Table 3). The relative ability of P adsorption by soil was greater than Si at pH 5.0 and less than Si at pH 9.0. These results are supported by Obihara and Russell6) who concluded that silicate is adsorbed more strongly than P at high pH, particularly near pH 7.
Silicate adsorption was higher when Si was added first than when Si was added as a mixture with P and Si adsorption increased with increasing pH. At pH 9.0, silicate strongly affected the adsorption of P in both systems, but the difference in amounts of silicate adsorbed between both systems at two levels of P concentration was ignored (Table 3).
This means the affinity of silicate for the soil was markedly higher than phosphate at pH 9.0.
Si sorbed (mM kg-1) 0.0 5.0 10.0 15.0 20.0 25.0 30.0
35.0 A (pH 5.0)
Si 10 mM kg-1 Si 20 mM kg-1 Si 40 mM kg-1
B (pH 5.0)
Si sorbed (mM kg-1) 0.0 5.0 10.0 15.0 20.0 25.0 30.0 35.0
Final concentration P (mM L-1)
0.0 1.0 2.0 3.0 4.0
Si sorbed (mM kg-1) 0.0 5.0 10.0 15.0 20.0 25.0 30.0 35.0
Final concentration P (mM L-1)
0.0 1.0 2.0 3.0 4.0
A (pH 7.0) B (pH 7.0)
A (pH 9.0) B (pH 9.0)
Fig. 3. Effects of pH and phosphate concentration on Si adsorption by soil. (A is P+Si system, B is Si/ P system)
CONCLUSION
With increasing Si concentration in solution, P adsorption decreased markedly above neutral pH conditions, but Si had little effect on P adsorption in the acidic condition (pH 5.0). The order of anion addition influenced the adsorption of phosphate and silicate. Silicate reduced phosphate adsorption more when Si was added first than when added, as a mixture with phosphate and reduction in P adsorption was greater at high pH than at low pH.
The efficiency of silicate in inhibiting phosphate adsorption was stronger at pH 9.0 than at pH 7.0 or 5.0. At each pH, the efficiency of silicate was higher when silicate was added first than when added as a mixture with phosphate. The effect of phosphate on silicate adsorption was relatively small at pH 5.0 and no effect of P on silicate adsorption was observed at pH 9.0. The affinity of P adsorption was greater than Si at pH 5.0, but smaller than Si at pH 9.0. These results suggest that application of Si may decrease P adsorption and increase the availability of P in the soils. To enhance the solubility and availability of P, Si application should precede P fertilization.
ACKNOWLEDGEMENTS
This work was supported by the Korea Research Foundation Grant (KRF-2001-002-G00011).
REFERENCES
1. RDA (Rural Development Administration). 1999.
Fertilization standards to crop plants. p. 148, National Institute of Agricultural Science and Technology, RDA, Suwon, Korea (in Korean) 2. Parfitt, R.L. 1978. Anion adsorption by soils and
soil materials. Advance of Agronomy, 30, 1-50 3. Pardo, M.T. and Guadalix, M.E. 1990. Phosphate
sorption in allophanic soils and release of sulphate, silicate and hydroxyl. Journal of Soil Science, 41, 607-612.
4. Alvarez, R., Fadley, C.S., and Silva, J.A. 1980.
Silicate and phosphate adsorption on gibbsite studied by x-ray photoelectron spectroscopy angular distributions. Soil Science Society of American
Journal, 44, 422-425
5. Smyth, T.J. and Sanchez, P.A. 1980. Effects of lime, silicate, and phosphorus applications to an Oxisol on phosphorus sorption and ion retention.
Soil Science Society of American Journal, 44, 500-505
6. Obihara, C.H. and Russell, E.W. 1972. Specific adsorption of silicate and phosphate by soils.
Journal of Soil Science, 23, 105-117
7. Raupach, M. and Piper, C.S. 1959. Interactions of silicate and phosphate in a lateritic soil. Australian Journal of Agricultural Research, 10, 818-831 8. Shariatmadari, H. and Mermut, A.R. 1999. Magnesium
and silicon-induced phosphate desorption in Smectite-, Palygorskite-, and Sepiolite-Calcite systems.
Soil Science Society of American Journal, 63, 1167-1173
9. Lee, Y.B., Hoon, C., Hwang, J.Y., Lee, I.B., and Kim, P.J. 2004. Enhancement of phosphate desorption by silicate in soils with salt accumulation. Soil Science and Plant Nutrition, 50, 493-499
10. Allison, L.E. 1965. Organic carbon. In: Methods of Soil Analysis, Part II, Ed. C A Black, p.
1367-1376, ASA, Madison, WI
11. RDA (Rural Development Administration). 1988.
Methods of Soil Chemical Analysis. National Institute of Agricultural Science and Technology, RDA, Suwon, Korea (in Korean)
12. Day, P.R. 1965. Particle fractionation and particle size analysis. In Methods of soil analysis, Part , Ed. CA Black, p. 545-567, ASA, Madison, WI
Ⅰ
13. McKeague, J.A. and Day, J.H. 1966. Dithionite- and oxalate-extractable Fe and Al as acids in differentiating various classes of soils. Canadian Journal of Soil Science, 46, 13-22
14. Brunauer, S., Emmett, P.H., and Teller, E. 1938.
Adsorption of gasses in multimolecular layers.
Journal of America Chemistry Society, 60, 309-319 15. Murphy, J. and Riley, J.P. 1962. A modified single solution method for the determination of phosphate in natural waters. Analytica Chimica Acta, 27, 31-36
16. Prinec, A.B. 1965. Absorption spectrophotometry.
In Methods of Soil Analysis, Part II, Ed. CA Black, p. 866-878, ASA, Madison, WI.
17. Miller, D.M., Sumner, M.E., and Miller, W.P.
1989. A comparison of batch- and flow- generated
anion adsorption isotherms. Soil Science Society of American Journal, 53, 373-380
18. Hingston, F.J., Posner, A.M., and Quirk, J.P.
1972. Anion adsorption by goethite and gibbsite. I.
The role of the proton in determining adsorption envelopes. Journal of Soil Science, 23, 177-192 19. Iler, R.K. 1979. The chemistry of silica. John Wiley
& Sons, New York
20. Brinkman, A. 1993. A double-layer model for ion adsorption onto metal oxides, applied to experi- mental data and to natural sediments of Lake Veluwe, the Netherlands, Hydrobologia, 253, 31-45
21. Deb, D.L. and Datta, N.P. 1967. Effect of associating anions on phosphate retention in soil : Ⅰ. Under variable phosphorus concentration. Plant and Soil, 26, 303-316
22. Drees, L.R., Wilding, L.P., Smeck, N.E., and Senkayi, A.L. 1989. Silica in Soils: Quartz and disordered silica polymorphs. In Minerals in soil environments, Ed. JB Dixon and SB Weed, p.
913-974, Soil Science Society of America, Madison, WI
23. Epstein, E. 1994. The anomaly of silicon in plant biology. Proceedings of the National Academy of Sciences, 91, 11-17
24. McKeague, J.A. and Cline, M.G. 1963. Silica in soils. Advance Agronomy, 15, 339-396