40세 이상의 한국성인의 혈중 납 농도와 고혈압
− 2008년 국민건강영양조사를 바탕으로 −
김선영†·이덕희*
진주보건대학교 보건행정과, *경북대학교 의과대학 예방의학교실
Blood Lead Concentration and Hypertension in Korean Adults Aged 40 and Over According to KNHANES IV (2008)
Sun-Young Kim† and Duk-Hee Lee*
Department of Healthcare Administration, Jinju Health College, Jinju, Korea
*Department of Preventive Medicine and Health Promotion Research Center, School of Medicine, Kyungpook National University, Daegu, Korea
ABSTRACT
Objectives: The purpose of this study was to examine the cross-sectional relationship between low blood lead levels and increasing blood pressure among Korean adults using a nationally representative sample of the Korean population: the Korea National Health and Nutrition Examination Survey (KNHANES) 2008.
Methods: A total of 918 subjects aged 40 and older and not currently being treated for hypertension participated in this study. Information about age, gender, smoking status, alcohol consumption, education level, and the use of anti-hypertensive medication was collected. The blood pressure was defined as the mean of the second and the third measurements after three time measurements. Lead levels were determined by an analysis of blood samples. Multiple linear and logistic regression analyses were implemented after adjusting for covariates includ- ing age, gender, educational level, smoking status, alcohol consumption, and BMI.
Results: This study showed that the average differences in systolic and diastolic blood pressure comparing the lowest to highest quintile of blood lead were 4.33 mmHg (95% CI, 0.66-8.00; p for trend = 0.027) and 2.66 mmHg (95% CI, 0.26-5.06; p for trend = 0.021), respectively. After multivariate adjustment for covariates, the prevalence odds ratio (POR) of subjects in the highest quintile was associated with a 1.70-fold increase in the risks of hypertension (95% CI, 0.83-3.49; p for trend test = 0.112) over those in the lowest quintile of blood lead concentration, However, it was not statistically significant.
Conclusions: This study provided evidence for an association between low- levels of blood lead and elevations in blood pressure and risk for hypertension in the general population of Korea.
Key words: Adult, Blood pressure, Environmental exposure, Humans, Hypertension/chemically induced, Lead/blood
I. Introduction
In industrial societies, environmental and occupa- tional lead exposure is one of common public health
concerns, and a number of observations have asso- ciated lead exposure with human diseases over many years. Recently, it especially has been focused on the toxic effects of lead on the cardiovascular
†
Corresponding author: Department of Healthcare Administration, Jinju Health College, Jinju 660-757, Korea Tel: +82-55-740-1866, Fax: +82-55-743-3010, E-mail: skim1970@paran.com
Received: 10 November 2011, Revised: 2 December 2011, Accepted: 15 December 2011
system and its association with hypertension in humans and animals1-4) because low-level lead expo- sure remains an important contributor to all causes and cardiovascular mortality5) despite successful public health initiatives for reducing environmental lead exposure.
Several plausible pathophysiological mechanisms for the involvement of lead in hypertension have been proposed; however, these mechanisms from the reports dealing from with a positive and causal association between lead exposure and increasing blood pressure are not universally accepted6) and still incompletely understood.7) Several mechanisms have been suggested to cause lead-induced hyper- tension such as alterations in calcium exchange- ability,8) central sympathetic activity enhancement,9) increases in plasma catecholamines,10) inhibition of the Na+/K+-ATPase,11) direct activation of smooth muscle protein kinase C,12) stimulation of the renin- angiotensin system13,14,15) and endothelial dysfunc- tion.16)
Since the first observation was done by Griffith
& Lindauer (1944)17) through producing arterial hypertension in rats exposed to lead, the relationship between lead and hypertension has been demon- strated through animal experiments.18) Numerous experimental studies using animals have shown unanswerable proof that chronic exposure to low lead levels results in hypertension that persists long after the cessation of lead exposure.19) During the last two decades, a number of epidemiologic studies also have been examined the possible relation between lead exposure and hypertension in humans;
however, the results from these epidemiologic studies are still inconsistent, and the issue of whether low level exposure to lead causes increas- ing blood pressure is still contradictory and an area of ongoing scientific debate. One study reported a strong relationship between blood lead levels and hypertension;20) while some studies reported a posi- tive association which was not statistically signifi- cant.21,22) Some studies even showed a negative
association23,24) or no association.25,26)
Most of these studies based on occupational lead exposure which showed positive associations between lead exposure and blood pressure; however, some of studies showed no relationship or weak relationship. In general population study settings, there was also no consistency among the results.
Some studies showed that blood lead concentration was a predictive variable of increase in systolic blood pressure,28,29) while the other study showed that lead exposure was not inconsistently associated with increased in blood pressure or hypertension.30) The studies even using the same data set showed contradictory results.31-34)
There is continuing considerable controversy over the possible causal association between blood pres- sure and lead exposure, and this remains an unre- solved issue among Korean adults examined in this study. The purpose of this study was to examine the cross-sectional relationship between low blood lead level and increasing blood pressure among Korean adults using a nationally representative of Korean population sample which is the Korea National Health and Nutrition Examination Survey 2008.
II. Materials and Methods
1. Study population and data collection This study was based on data from the Fourth Korea National Health and Nutrition Examination Survey (KNHNES IV) which was conducted by the Korean Ministry of Health and Welfare conducted in 2007-2009. The target population was Korean individuals aged one year and older and non- institutionalized. To obtain a representative sample of civilian non-institutionalized Korean population, the survey employed stratified multistage probability sampling units based on geographic area, gender, and age, which were determined based on the household registries of the 2005 National Census Registry. The survey sample pool ultimately con-
sisted of 264,186 primary sampling units, each con- sisting of approximately 60 households. The survey had three components which are the health inter- view survey, the health examination survey, and the nutrition survey. Detailed information regarding the design was provided by Kim and Lee (2011).39)
Among a total of 2,006 adults who participated in measurement of the five heavy metals: blood lead (Pb), cadmium (Cd), mercury (Hg), manganese (Mn), and urinary arsenic (As), 797 participants who were under 40; 289 participants who reported being currently treated for hypertension, two who had missing information were excluded. Subjects who were 40 years and older were selected due to lower prevalence of hypertension in young adults. The final study sample included 918 participants for this study (Fig. 1).
During the health interview, information about age, gender, smoking status, alcohol consumption status, education level, and the use of anti-hyper- tensive medication was collected. Smoking status was divided into three categories: non-smoker, former smoker and current smoker. To assess alco- hol consumption, the participant’s drinking behav- iors during the month before the interview were asked. The average frequency of alcohol consump- tion per week was divided into four categories:
none, less than once, once to twice and more than three times. The education level was categorized into three groups: less than high school, completed high school and college or higher. For body mass index (BMI), height and weight were measure with
the participants wearing light clothing without the shoes, and the BMI was calculated as weight in kilograms divided by the square of height in meters.
For accurate blood pressure measurement, subjects were asked not to smoke for 30 minutes and take five minutes rest in a sitting position before meas- uring blood pressure. Blood pressure was measured three times with a mercury sphygmomanometer.
The final blood pressure was defined as the mean of the second and the third measurements.
2. Measurement of lead in whole blood Blood specimens were collected by venipuncture, and 3 mL blood samples were drawn into standard commercial evacuated tubes containing sodium heparin (Vacutainer® [BD, N], USA). All blood lead analysis was carried out by Neodin Medical Institute (NMI) which was a laboratory certified by the Korean Ministry of Health and Welfare, and blood lead was measured by Atomic Absorption Spectrophotometer-Graphite Furnace (AAS-600, Zeeman correction, Perkin Elmer, Singapore). For the internal quality assurance and control, a standard reference material (Lyphochek® Whole Blood Metal Control) was obtained from Bio-Rad (CA, USA).
The coefficient of variation was less than 10% for blood lead. For the external quality assurance and control, the institute passed the German External Quality Assessment Scheme (G-EQUAS) operated by Friedrich-Alexander University and passed the Quality Assurance program operated by the Korea Occupational Safety and Health Agency. The detection limit for blood lead was 0.0223µg/dl.
3. Statistical analysis
After blood pressure was measured three times to minimize error, the mean of the second and the third measurements was used in this analysis.
“Hypertension” was defined doctor-diagnosed hyper- tension or systolic blood pressure (SBP) was 140 mmHg and over or diastolic blood pressure (DBP) was 90 mmHg or over; however, the participants
Fig. 1. Exclusion flow and evolution of the sample size.
who reported being currently treated for hypertension were excluded in this study. The blood lead levels were log-transformed for normal distribution.
Multiple linear regression analysis was used to test the associations of blood lead and with systolic and diastolic blood pressures. While Model 1 was adjusted for age, gender, and education level, Model 2 was further adjusted for smoking status, alcohol consumption, and BMI. Multiple logistic regression analysis was used to test the risks of hypertension by categorizing blood lead in quintiles and com- paring those participants in blood lead quintile 2, 3, 4 and 5 with those in quintile 1. The covariates for the adjusted prevalence odd ratio (POR) calculation were age, gender, education level, smoking status,
alcohol consumption, and BMI (Models 1 and 2).
Statistical tests for trends of continuous variables were carried out in regression models by coding the medians of log-transformed lead levels for each quintile and it was analyzed as a continuous vari- able.
The confounders which influence blood pressure are associated with blood lead levels.35) These vari- ables are age, gender, BMI, smoking, drinking, ethnicity, socioeconomic status, and nutritional.36-38) In general, general characteristics such as age and gender are controlled during statistical analysis;
however, other variables vary from different studies, and it is not clear whether they are confounders or not. In this study, age, gender, education level,
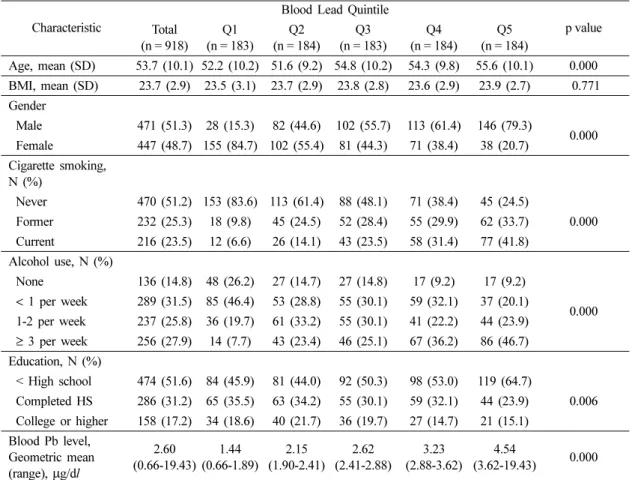
Table 1. Descriptive characteristics based on quintile of blood lead level
Characteristic
Blood Lead Quintile
p value Total
(n = 918)
Q1 (n = 183)
Q2 (n = 184)
Q3 (n = 183)
Q4 (n = 184)
Q5 (n = 184)
Age, mean (SD) 53.7 (10.1) 52.2 (10.2) 51.6 (9.2) 54.8 (10.2) 54.3 (9.8) 55.6 (10.1) 0.000 BMI, mean (SD) 23.7 (2.9) 23.5 (3.1) 23.7 (2.9) 23.8 (2.8) 23.6 (2.9) 23.9 (2.7) 0.771 Gender
Male 471 (51.3) 28 (15.3) 82 (44.6) 102 (55.7) 113 (61.4) 146 (79.3)
0.000 Female 447 (48.7) 155 (84.7) 102 (55.4) 81 (44.3) 71 (38.4) 38 (20.7)
Cigarette smoking, N (%)
Never 470 (51.2) 153 (83.6) 113 (61.4) 88 (48.1) 71 (38.4) 45 (24.5)
0.000 Former 232 (25.3) 18 (9.8) 45 (24.5) 52 (28.4) 55 (29.9) 62 (33.7)
Current 216 (23.5) 12 (6.6) 26 (14.1) 43 (23.5) 58 (31.4) 77 (41.8) Alcohol use, N (%)
None 136 (14.8) 48 (26.2) 27 (14.7) 27 (14.8) 17 (9.2) 17 (9.2)
0.000
< 1 per week 289 (31.5) 85 (46.4) 53 (28.8) 55 (30.1) 59 (32.1) 37 (20.1) 1-2 per week 237 (25.8) 36 (19.7) 61 (33.2) 55 (30.1) 41 (22.2) 44 (23.9)
≥ 3 per week 256 (27.9) 14 (7.7) 43 (23.4) 46 (25.1) 67 (36.2) 86 (46.7) Education, N (%)
< High school 474 (51.6) 84 (45.9) 81 (44.0) 92 (50.3) 98 (53.0) 119 (64.7)
0.006 Completed HS 286 (31.2) 65 (35.5) 63 (34.2) 55 (30.1) 59 (32.1) 44 (23.9)
College or higher 158 (17.2) 34 (18.6) 40 (21.7) 36 (19.7) 27 (14.7) 21 (15.1) Blood Pb level,
Geometric mean (range), µg/dl
2.60 (0.66-19.43)
1.44 (0.66-1.89)
2.15 (1.90-2.41)
2.62 (2.41-2.88)
3.23 (2.88-3.62)
4.54
(3.62-19.43) 0.000
*
p values obtained from analysis of variance (continuous variables) or X
2test (categorical variables) based on the overall test
across quintiles.
smoking status, alcohol consumption, and BMI were determined by previous studies and adjusted for multiple regression analyses. According to Shaper et al. (1982)39) and Alessio et al. (1995),40) smoking and drinking influence increase in lead absorption, and it means individuals’ lifestyle can influence lead exposure level. For the most of cases, lead absorp- tion is happened through respiratory system; how- ever, it accelerates oral invasion of lead under the conditions of poor environment, smoking and unsanitary personal hygiene. In addition, education level was added to the multiple regression model because the previous studies reported that it is associated with blood pressure and environmental factors.41)
To examine the effect of the complex survey design on the results, weights were taken into account in the regression models. All statistical analyses were performed using PASW software version 18.0 (SPSS Inc., Chicago, Illinois). A two- sided p value of less than 0.05 was considered statistically significant.
III. Results
1. General characteristics of the study population
The general demographic characteristics and the blood lead concentration of the study participants by quintile are shown in Table 1. Among 918 participants, 471 (51.3%) were male and 447 (48.7%) were female. The mean age was 53.7 years old. Overall, the geometric mean of blood lead concentrations for adults aged 40 years and over was 2.60µg/dl, and the geometric means for the quintiles of blood lead concentrations ranged from 1.44µg/dl to 4.54 µg/dl in the lowest and highest quintile, respectively. The geometric mean of blood lead concentrations in males was significantly higher than that in females (3.09µg/dl and 2.18 µg/
dl, respectively; data not shown). The number of males increased steadily from the lowest to highest
quintiles. More than 40% of current smokers were in the highest quintile, while the majority of non- smokers (83.6%) were in the lowest quintile. As the frequency of alcohol consumption increased, the blood lead levels tended to be higher. Almost half of the participants, who consumed alcohol more than three times per week, were in the highest quintile (46.7%) while most of the participants, who were non-drinkers and consumed alcohol less than once per week, were in the lowest quintile. Less educated participants were in the highest quintile (64.7%). Overall, current smokers, heavy drinkers, less educated and older adults tended to have higher blood lead concentrations and statistically significant (p< 0.05). There was no significant difference in BMI across quintiles.
2. Descriptive of hypertension and blood lead level
The geometric mean of blood lead concentrations with hypertension subjects was significantly higher than that with normotensive subjects (2.94µg/dl and 2.55µg/dl, respectively; p < 0.05; data not shown).
3. Effect of lead exposure on blood pressure Table 2 shows the multiple linear regression results of systolic blood pressure and diastolic blood pressure in this study population. Model 1 was the effects of lead exposure on systolic and diastolic blood pressure after adjustments for age, gender, and education level. Model 2 was the effects of lead exposure on systolic and diastolic blood pressure after further adjustments smoking status, alcohol consumption, and BMI. The increase in blood lead concentration was associated with the increase in systolic and diastolic blood pressure.
Before multivariable adjustments, the average differences in systolic and diastolic blood pressure comparing the lowest to highest quintile of blood lead were 8.59 mmHg (95% CI, 5.18-12.0; p-value
< 0.01) and 6.56 mmHg (95% CI, 4.38-8.75; p-value
< 0.01), respectively. As the quintile was higher,
systolic and diastolic blood pressures were increased, and there were significant dose-response relationships in both systolic and diastolic blood pressure (p-value for trend test < 0.01). After multi- variable adjustments, the average differences in systolic and diastolic blood pressure comparing the lowest to highest quintile of blood lead were 4.33 mmHg (95% CI, 0.66-8.00; p-value < 0.05) and 2.66 mmHg (95% CI, 0.26-5.06; p-value < 0.05), respectively (Table 2, Model 2) (p-value for trend test < 0.05).
4. Effect of lead exposure on hypertension Table 3 summarized the PORs for hypertension by quintile of blood lead concentrations. Before multivariate adjustment, the POR for hypertension comparing the lowest to highest quintile of blood lead concentration was 2.9 (95% CI, 1.54-5.51; p- value < 0.01), and there were significant dose- response relationships (p-value for trend test <
0.01). After multivariate adjustments for age, gender, education, smoking status, alcohol consumption, and BMI, the POR of subjects in the highest quintile was associated a 1.70-fold increase in the risks of
Table 2. Beta coefficients and 95% confidence interval of blood pressure by blood lead level in multiple regression models
*Blood Lead Mean(SD)
(cases/n. of subcases)
Unadjusted
(95% CI) p-value Model 1
†(95% CI) p-value Model 2
‡(95% CI) p-value Systolic blood pressure
Quintile 1 113.6 (15.6) (183 / 918)
0 (Reference)
0 (Reference)
0 (Reference) Quintile 2 115.9 (17.8)
(184 / 918)
2.52
(-0.76–5.80) 0.133 2.14
(-1.09–5.36) 0.193 1.64
(-1.56–4.84) 0.315 Quintile 3 116.7 (15.1)
(183 / 918)
4.57
(1.32–7.82) 0.006 2.21
(-1.60–5.47) 0.186 1.46
(-1.77–4.69) 0.374 Quintile 4 118.6 (16.7)
(184 / 918)
5.12
(1.86–8.37) 0.002 3.05
(-0.29–6.39) 0.073 2.25
(-1.07–5.58) 0.183 Quintile 5 121.3 (17.3)
(184 / 918)
8.59
(5.18–12.00) 0.000 5.60
(1.92–9.28) 0.003 4.33
(0.66–8.00) 0.021 p-value for
trend test 0.000 0.004 0.027
Diastolic blood pressure Quintile 1 73.1 (9.7)
(183 / 918)
0 (Reference)
0 (Reference)
0 (Reference) Quintile 2 75.1 (10.4)
(184 / 918)
2.25
(0.15–4.36) 0.036 0.90
(-1.23–3.04) 0.406 0.58
(-1.51–2.67) 0.585 Quintile 3 76.6 (10.4)
(183 / 918)
4.28
(2.19–6.36) 0.000 2.47
(0.31–4.63) 0.025 2.00
(-0.11–4.11) 0.063 Quintile 4 76.6 (10.6)
(184 / 918)
4.30
(2.21–6.39) 0.000 2.21
(-0.18–4.24) 0.072 1.66
(-0.52–3.83) 0.135 Quintile 5 78.9 (10.2)
(184 / 918)
6.56
(4.38–8.75) 0.000 3.44
(1.01–5.88) 0.006 2.66
(0.26–5.06) 0.030 p-value for
trend test 0.000 0.004 0.021
*
Weighted estimates were presented.
†
Model 1 was adjusted for age(years), gender, education (< high school, completed high school, college or higher).
‡
Model 2 was further adjusted for smoking (never, former, current), drinking (none, < 1 per week, 1-2 per week, 3 per week),
BMI (Kg/m
2).
hypertension (95% CI, 0.83-3.49; p-value < 0.149) than those in the lowest quintile of blood lead con- centrations, but it was not statistically significant.
IV. Discussion
In order to examine the association of lead and blood pressure, several cross-sectional and prospect- ive population-based studies have been performed from the mid-1980s.42) Even though the results from these studies have been inconsistent, there is con- siderable concordance with the directionality of the weak positive association between blood lead and both systolic and diastolic blood pressure. For the present study, biomonitoring data in KNHANES IV (2008) was analyzed in order to examine the cross- sectional relationship between low-level of blood lead and increase in blood pressure among Korean adults.
According to Kim and Lee (2011),34) the overall geometric mean of the blood lead level from KNHANES III was 2.61µg/dl in all 1,997 subjects (2.98µg/dl for males and 2.29 µg/dl for females).
In the study of Yang et al. (1996),43) 525 Korean
adults who had no previous occupational lead expo- sure were selected by random sampling to represent the general population. The geometric mean of blood lead in males (6.36µg/dl) was even higher than in females (5.09µg/dl). The overall geometric mean of the blood lead level from KNHANES IV was 2.36µg/dl in all 2,006 subjects aged 20 years and over (2.81µg/dl for males and 1.98 µg/dl for females; data not shown). It is known that environ- mental exposure to lead has decreased considerably in many countries since they have banned leaded gasoline. In Korea, leaded gasoline was being phased out in 1986 and replaced with unleaded gasoline after 1993.41,43) Since that the blood lead level has continuously declined.
The overall geometric mean of the blood lead level was 2.60µg/dl from 918 subjects for the present study. The geometric means of the blood lead level in the lowest quintile and in the highest quintile were 1.44µg/dl and 4.54 µg/dl, respectively.
In this study, the major result was that blood lead level was associated with the systolic and diastolic blood pressure in unadjusted analysis but tended to become an insignificant predictor for increasing
Table 3. PORs of hypertension by quintile of blood lead concentrations
Blood Lead
Cases/n. of subcases (N = 918)
Unadjusted
(95% CI) p-value Model 1
*(95% CI) p-value Model 2
†(95% CI) p-value
Quintile 1 15 / 183 1.0
(Reference)
1.0 (Reference)
1.0 (Reference)
Quintile 2 22 / 184 1.5
(0.76 −3.04) 0.234 1.4
(0.67–2.77) 0.391 1.3
(0.65–2.74) 0.439
Quintile 3 30 / 183 2.2
(1.14 −4.24) 0.019 1.7
(0.86–3.40) 0.124 1.7
(0.84–3.36) 0.146
Quintile 4 36 / 184 2.7
(1.43 −5.18) 0.002 2.1
(1.05–4.08) 0.035 1.9
(0.95–3.80) 0.069
Quintile 5 38 / 184 2.9
(1.54 −5.51) 0.001 2.0
(1.00–3.93) 0.062 1.7
(0.83–3.50) 0.149 p-value for
trend test 0.000 0.034 0.112
*
Model 1 was adjusted for age (years), gender, education (<high school, completed high school, college or higher).
†
Model 2 was further adjusted for smoking (never, former, current), drinking (none, < 1 per week, 1-2 per week, 3 per week),
BMI (Kg/m
2).
both systolic and diastolic blood pressures when the effects of other variables were taken into account.
The adjusted models of multiple linear regression analysis showed dose-response relationships between blood lead quintile and systolic blood pressure although not always significant and remained bor- derline significant (p for trend = 0.03 for systolic blood pressure; 0.02 for diastolic blood pressure). It was also similar to the results from logistic regres- sion analysis. Blood lead level was associated with hypertension in unadjusted analysis but tended to become an insignificant predictor for increasing both systolic and diastolic blood pressures when the effects of other variables especially, smoking status, alcohol consumption, and BMI were accounted for.
These findings were different from the results obtained in the study of Apostoli et al. (1990).44) They performed a cross-sectional study for evalu- ating the relationship between blood lead, blood pressure and hypertension. Although the well-known confounding factors such as age, weight, heredity, smoking, and alcohol were taken into account, blood lead and blood pressure were significantly correl- ated. However, the conclusion on blood lead effect was biased after re-analysis of those data.45) Sirivarasai et al. (2004)28) found a relationship between blood lead and systolic pressure but not diastolic blood pressure. These contradictory results probably are due to variation in criteria for weighting factors, covariates selected as confounders, statistical methods and including participants in the analysis.
The findings from the present study need to be considered within the context of its limitations.
Perhaps the most concerned limitation was the reliance on a single blood lead measurement to assess lead exposure. The present study is a cross- sectional study which measured the exposures and outcomes simultaneously; however, the relevant exposures affecting blood pressure and hypertension may occur months or years before the observed effect. Glenn et al. (2006)2) mentioned that com- parisons of blood lead and tibia lead may indicate
whether the effect of lead on blood pressure is an acute effect of recent dose or a chronic effect of cumulative dose. According to Cheng et al. (2001),46) the reliance of epidemiologic studies primarily on the concurrent blood lead concentration as the measure of lead exposure had hindered efforts to elucidate the cumulative efforts of low level lead exposure. Their study also supported the hypothesis that long-term lead accumulation may increase blood pressure and the risk of hypertension, and bone lead appears to be a better predictor in the association. Some studies also presented similar ideas. These studies found that blood lead was associated with systolic blood pressure only, and this association was independent of bone lead. On the other hand, tibia lead was associated with increased odd ratios of hypertension.37,47) In sum, Hu et al. (1998)48) noted that bone lead may be a more appropriate marker of lead exposure for chronic disease outcome such as hypertension. It could be one possible explanation for the weak association found in the present study.
Only blood lead level was analyzed in the present study. The lead level in blood may reflect very recent exposure and not provide the most relevant estimate of overall exposure. Thus, it is unclear whether the observed increased risk hypertension was due to lead exposure at the time of measure- ment or lead mobilization from the skeleton. In the future study, blood lead level and bone lead level should be considered as independent factors influencing the risk for hypertension; thus, it may help to understand whether the effect of lead on blood pressure is an acute effect or chronic effect.
Second, given cross-sectional design using a single blood lead measurement at one time point, inferring causality from the association may be premature; therefore, this study could not present whether lead exposure preceded blood pressure and hypertension outcomes or not, and its causal mechanisms. Although the population-based study cannot establish the cause of disease by itself,
appropriate statistical correlations can generate testable hypotheses and suggest practical inferences.
Third limitation was the small sample size (n = 918). Among the total number of 9,444 surveyed in KNHANES IV (2008), only 2,006 subjects who were 20 years and older were examined for bio- monitoring of heavy metals. In the present study, subjects who were 40 years and older were selected due to lower prevalence of hypertension in young adults. Nevertheless, these assumptions need to be assessed in prospective population studies.
Despite these limitations, the present study maintains several strengths. KNHANES IV (2008) data were collected by a rigorous study protocol with extensive quality procedures. The results are representative of the non-institutionalized civilian population in Korea. The present study provided evidence for an association between low-level of blood lead and elevations in blood pressure and the risk of hypertension at measured levels observed in the general population of Korea. The results from the present study provide support for continued efforts to decrease lead levels in the general Korean population.
V. Conclusions
This study provided evidence for an association between low-level of blood lead and elevations in blood pressure and risk for hypertension in the general population of Korea. In this study, blood lead levels in the hypertensive group was higher than the normotensive group, and it suggested an evidence that low level exposure to lead is asso- ciated with hypertension. After covariates adjust- ments, the average differences in systolic and diastolic blood pressure comparing the lowest to highest quintile of blood lead were 4.33 mmHg and 2.66 mmHg, respectively. Subjects in the highest quintile had 1.70 folds higher risk for hypertension than those in the lowest quintile of blood lead concentration, but it was not statistically significant.
Because given cross-sectional design using a single blood lead measurement at one time point, the lead level in blood may reflect very recent exposure and not provide the most relevant estimate of overall exposure. Therefore, further research need to be done to assess the association between low-level exposure to lead and hypertension and its causal mechanisms.
Acknowledgements
We would like to thank all the participants in the KNHANES project.