Development and Evaluation of Core Collection Using Qualitative and Quantitative Trait Descriptor in Sesame ( Sesamum indicum L.) Germplasm
Jong-Hyun Park*, Sundan Suresh**, Sebastin Raveendar***, Hyung-Jin Baek***, Chung-Kon Kim****, Sokyoung Lee***, Gyu-Taek Cho***, Kyung-Ho Ma***, Chul-Won Lee*****
†, and Jong-Wook Chung***
†*Food Grain Policy Division, MAFRA, Sejong 339-012, Republic of KOREA
**Department of Botony, Directorate of Distance Education, Madurai Kamaraj University, Palkalai Nagar, Madurai 625 021, Tamil Nadu, India.
***National Agrobiodiversity Center, National Academy of Agricultural Sciences, RDA, Jeonju 560-500, Republic of Korea.
****Agricultural Research & Extension Services, Jeollabuk-do, Iksan 570-704, Republic of Korea.
*****Department of Crop science, Chungbuk National University, Cheongju 361-763, Republic of Korea.
75
†
Corresponding author: (Phone) +82-43-261-2512 (E-mail) [email protected] (Phone) +82-63-238-4871 (E-mail) [email protected]
<Received 10 July, 2014; Revised 4 November, 2014; Accepted 18 November, 2015>
한작지(Korean J. Crop Sci.), 60(1): 75~84(2015) DOI : http://dx.doi.org/10.7740/kjcs.2014.60.1.075
ABSTRACT Sesame (Sesamum indicum L.) is one of the most important oilseed crops with high oil contents and rich nutrient value. The development of a core collection could facilitate easier access to sesame genetic resources for their use in crop improvement programs and simplify the genebank management. The present study was initiated to the deve- lopment and evaluation of a core collection of sesame based on 5 qualitative and 10 quantitative trait descriptors on 2,751 sesame accessions. The accessions were different countries of origin. About 10.1 percent of accessions were selected by using the power core program to constitute a core collection consisting of 278 accessions. Mean comparisons using t-test, Nei’s diversity index of 10 morphological descriptors and correlation coefficients among traits indicated that the existing genetic variation for these traits in the entire collection has been preserved in the core collection. The results from this study will provide effective information for future germplasm conservation and improvement programs in sesame.
Keywords : core collection, development, evaluation, sampling strategy, sesame germplasm
Sesame (Sesamum indicum L.), a member of the Pedaliaceae, is a diploid (2n = 26) dicotyledon and one of the oldest oil seed crops, growing widely in tropical and subtropical areas (Ashri, 2010). Its cultivation history can be traced back to between 5,000 and 5,500 years ago in the Harappa Valley of the Indian sub- continent (Bedigian and Harlan, 1986). The total area of sesame harvested in the world is currently 7.8 million hectares, and
annual production is 3.84 million tons (UN Food and Agriculture
Organization data, 2010). Sesame seed contains oil (44~58%),
protein (18~25%) and carbohydrate (13.5%) (Borchani et al.,
2010; Mohammed et al., 2011), and has desirable physiological
effects, including antioxidant activity, blood pressure, serum
lipid lowering potential. They are used as active ingredients in
antiseptics, bactericides, viricides, disinfectants, moth repellants,
and antitubercular agents because they contain natural antioxidants
such as sesamin and sesamolin (Anilkumar et al., 2010; Nweke et
al., 2012). Among the primary edible oils, sesame oil has the
highest antioxidant content (Cheung et al., 2007). The most
abundant fatty acids present in sesame oil include, oleic acid
(43%), linoleic acid (35%), palmitic acid (11%) and stearic acid
(7%) contributing toward 96% of total fatty acids (Elleuch et al.,
2007). In addition, sesame oil is important in the food industry
because of its distinct flavor. These characteristics have stimulated
interest in the biochemical and physiological composition of
sesame oil (Chung et al., 1995). India, China, and Korea are the
world’s leading countries for sesame germplasm collection and
preservation, as well as research on sesame core collection
establishment (Zhang et al., 2012). Bisht et al. (1998) inve-
stigated 19 phenotypic and agronomic traits in 3,129 sesame
accessions from seven ecogeographical regions in India and
established a sesame core collection consisting of 362 accessions
in India. To broaden the genetic bases in breeding, extensive
germplasm collections have been carried out in the Republic of
Korea. Consequently, 7,698 accessions have been collected to
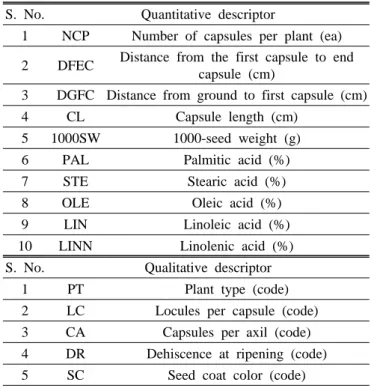
ISSN 2287-8432(Online)Table 1. List of descriptors recorded for the study.
S. No. Quantitative descriptor
1 NCP Number of capsules per plant (ea) 2 DFEC Distance from the first capsule to end
capsule (cm)
3 DGFC Distance from ground to first capsule (cm)
4 CL Capsule length (cm)
5 1000SW 1000-seed weight (g)
6 PAL Palmitic acid (%)
7 STE Stearic acid (%)
8 OLE Oleic acid (%)
9 LIN Linoleic acid (%)
10 LINN Linolenic acid (%)
S. No. Qualitative descriptor
1 PT Plant type (code)
2 LC Locules per capsule (code)
3 CA Capsules per axil (code)
4 DR Dehiscence at ripening (code)
5 SC Seed coat color (code)
date and are being preserved at the National Agrobiodiversity center, Rural Development Administration (RDA) in Suwon, Korea. These accessions are composed of 3,538 exotic collections (including 1,961 accessions from the sesame world collection), 2,660 indigenous collections, 1,072 improved genetic stocks and 428 others. Kang et al. (2006) investigated 12 agronomic traits in 2246 Korean sesame accessions from ten agroclimate zones preserved in the Rural Development Administration (RDA) Genebank in Korea and established a sesame core collection of 475 accessions. The objective of this study was to develop a core collection of sesame from 2,751 accessions representing 278 core collection accessions, 15 countries of origins and investigated 5 qualitative and 10 quantitative trait descriptors.
MATERIALS AND METHODS
Data set
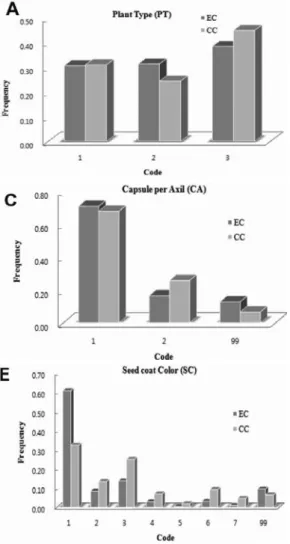
A total of 2,751 accessions of sesame collected over 15 countries. Evaluated in the experimental farm of the National Agrobiodiversity Center, National Academy of Agricultural Science, RDA, Republic of Korea during the year of 2008 -2009. Qualitative traits evaluated were, plant growth habit (PT) (cm), number of locules per capsule (LC), number of capsules per axil (CA), type of capsule dehiscence at ripening (DR), seed coat color (SC),
Quantitative traits evaluated were numbered of capsules per plant (NCP), distance from the first capsule to end capsule (DFEC) (cm), distance from ground to first capsule (DGFC) (cm), capsule length (CL) (cm) and 1000-seed weight (g) (1000SW).
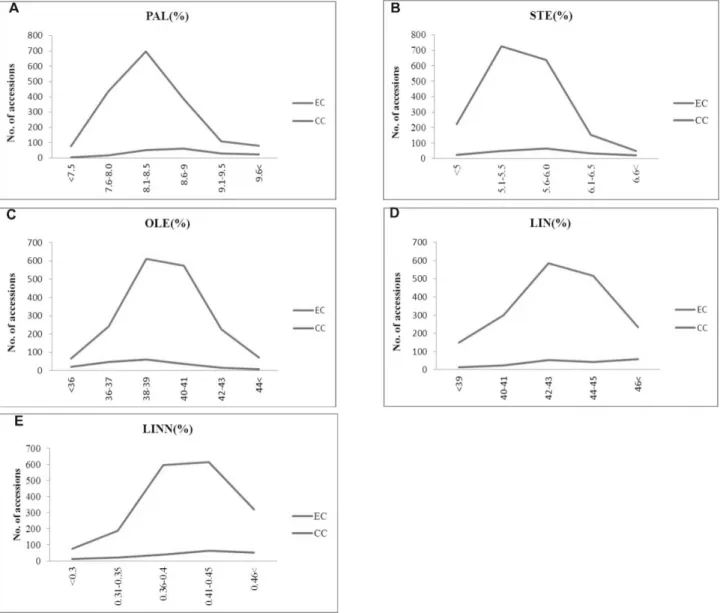
Fatty acid analysis, scanned by near infrared reflectance spectroscopy (NIRS), was conducted at the laboratory of the RDA Genebank of Korea in 2009. Fatty acids scanned by NIR were percentages of palmitic acid (PAL), stearic acid (STE), oleic acid (OLE), linoleic acid (LIN), and linolenic acid (LINN) (Table 1). The RDA, National Agrobiodiversity center has developed the Powercore software to help genebanks to identify accessions for core collection (Kim et al., 2007). The software works on identifying all useful alleles or characteristics in accessions so that these can be retained in genebank. It helps in reducing the redundancy of useful alleles and thus enhancing the richness of the core collection.
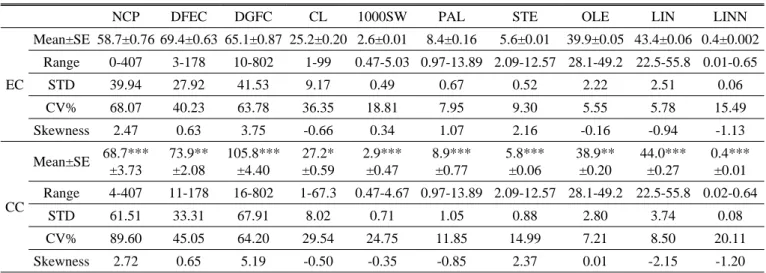
Statistical analysis in entire and core collection The means, ranges of standard deviation cumulative value, skewness and distribution homogeneity for 10 important quantitative traits to compare between entire collection and core collection were analyzed by the t-test were performed using SPSS ver.17.0.
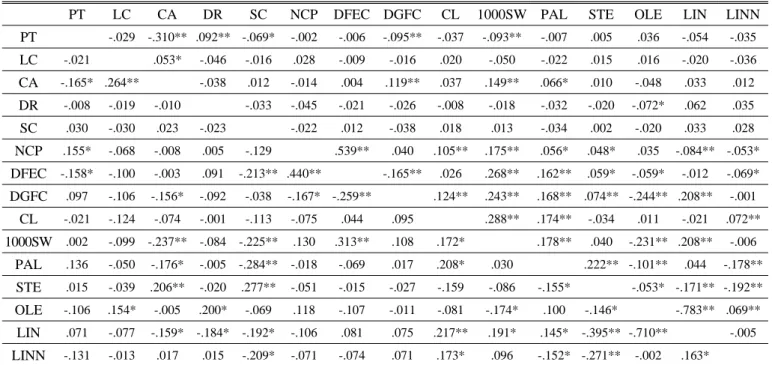
The phenotypic correlation coefficient of different traits has also been used as a measure for evaluating the quality of core collections (Reddy et al., 2005; Mahajan et al., 2007). The quantitative trait comparative frequencies were generated with the program GenAlEx version 6.41 (Peakall and Smouse, 2006) and fatty acid; Gas Chromatography (GC) was used for fatty acid analysis after (Kim et al., 2007). The diversity index of Nei’s (1973) was estimated and used as a measure of 10 important quantitative traits diversity in the entire collection and the core collection. Comparisons of various indicators percentage analysis of accessions from entire collection (EC) and core collection (CC), among countries of origin were calculated for the MD%
mean difference percentage, VD% variance difference percentage, CR% is the coincidence rate of range and VR% indicates the variable rate of the coefficient of variance.
×
Where Me is the mean of entire collection; Mc is the mean of core collection.
×
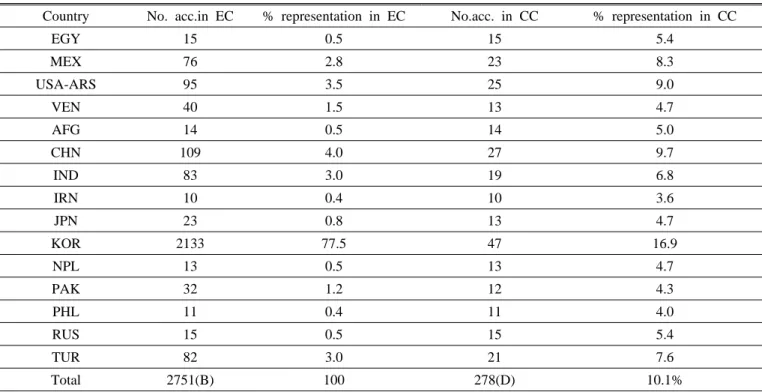
Table 2. Descriptions of entire collection (EC) and core collection (CC) of sesame germplasm.
Country No. acc.in EC % representation in EC No.acc. in CC % representation in CC
EGY 15 0.5 15 5.4
MEX 76 2.8 23 8.3
USA-ARS 95 3.5 25 9.0
VEN 40 1.5 13 4.7
AFG 14 0.5 14 5.0
CHN 109 4.0 27 9.7
IND 83 3.0 19 6.8
IRN 10 0.4 10 3.6
JPN 23 0.8 13 4.7
KOR 2133 77.5 47 16.9
NPL 13 0.5 13 4.7
PAK 32 1.2 12 4.3
PHL 11 0.4 11 4.0
RUS 15 0.5 15 5.4
TUR 82 3.0 21 7.6
Total 2751(B) 100 278(D) 10.1%
USA United State of America- Agricultural Research Service; MEX Mexico; VEN Venezuela; KOR South Korea; CHN China;
IND India; PAK Pakistan; JPN Japan; AFG Afghanistan; NPL Nepal; PHL Philippines; IRN Iran; EGY Egypt; TUR Turkey;
RUS Russia
Where Ve is the variance of entire collection; Vc is the variance of core collection.
×
Where Rc is the range of each trait for the entire collection; Re:
is the range of each trait for the core collection.
×