https://doi.org/10.14370/jewnr.2019.25.1.17
Factors Influencing the Quality of Sleep in Korean Adults by Age Groups
Choi, Jin Yi
1 ⋅Park, Young Mi
2 ⋅Choi, Dug Ja
3 ⋅Ha, Young Ok
41Associate Professor, Department of Nursing, Konkuk University, Chungju, Republic of Korea; 2Associate Professor, Department of Nursing, Ansan University, Ansan, Republic of Korea; 3Registered Nurse, Department of Nursing, Seoul National University Hospital,
Seoul, Republic of Korea; 4Assistant Professor, Department of Nursing, Ansan University, Ansan, Republic of Korea
1)연령분류에 따른 성인 수면의 질에 영향을 미치는 요인
최진이1⋅박영미2⋅최덕자3⋅하영옥4
1건국대학교 의료생명대학 간호학과 부교수, 2안산대학교 간호학과 부교수, 3서울대학교병원, 간호사, 4안산대학교 간호학과 조교수
Purpose: This study investigated the factors influencing sleep quality in adults according to age groups. The escriptive study was conducted in metropolitan areas of South Korea to control for possible sleep differences between adults living in rural areas and those living in cities. Participants were 450 adults between 19 and 65 years old. Methods: Self-administered questionnaires consisting of including the Korean Modified Sleep Leeds Evaluation Questionnaire, the International Physical Activity Questionnaire and the Perceived Stress Scale were used to assess the quality of adults’ sleep. Results: Sleep quality was poor across the all age groups Stress and subjective health status were influencing factors of sleep quality among participants in their 20s; subjective health status and circadian rhythm (evening-type) were influencing factors of those in their 30s; subjective health status, alcohol consumption, and work days of less than 8 hours were influencing factors among participants in their 40s; and stress, circadian rhythm (evening-type), subjective health status, work days of over 11 hours, past smoking habit, and light physical activity were influencing factors of those aged 50 years and over. Conclusion: The quality of sleep was low across the all adult age groups in South Korea. Although the factors influencing quality of sleep differed by age groups, they in general indicate the need to focus on maintaining and controlling health status in sleep interventions.
Key Words: Quality of sleep, Adults, Age groups
Introduction
Sleep is essential to revitalizing the body’s functions and maintaining health. Sufficient sleep increases health and safety, whereas poor sleep can result in fatigue, tiredness, decreased memory and concentration,
restlessness, and anxiety, all of which can negatively impact an individual’s quality of life [1].
The quality of sleep consists of several elements, such as latency, number of times of waking from sleep, and sleep efficiency [2]. As noted earlier, quality of sleep is directly related to overall health and
주요어: 수면의 질, 성인, 연령분류
Corresponding author:Ha, Young Ok (https://orcid.org/0000-0002-6168-2047) Department of Nursing, Ansan University
155 Ansandaehak-ro, Sangrok-gu, Ansan-si, Gyeonggi-do, Republic of Korea, 15328.
Tel: +82-31-400-7146 Fax: +82-31-400-7107 E-mail: [email protected] Received: 07 February 2019 Revised: 07 May 2019 Accepted: 07 May 2019
17
quality of life. Problems resulting from a lack of sleep include poor health, increased risk of death, hormonal and biochemical changes, high medical expenses, increased use of healthcare resources, absence from work, problems related to alcohol use, and increased risk of psychological disorders such as depression [3].
For adults, an adequate sleep duration is typically 7–8 hours [4].
However, in South Korea, the average sleep time for adults over 30 is only 6.7 hours. Approximately 19.5% of the total population is getting less than 6 hours of sleep on average [5]. Sleep problems were less common among adult subjects living in local communities than among elderly subjects. Sleep problems are often less common among adult subjects living in local communities than among elderly subjects; this makes sense, given that sleep problem tend to worsen with age. It may be necessary to intervene early in adults, especially those that proactively participate in socioeconomic activities [6,7].
According to recent studies, sleep duration and sleep quality are negatively associated with aging, and poor sleep in adults can increase the risk of cardiovascular disease, diabetes, obesity, cancer, high blood pressure, dyslipidemia, and physical stress. Poor sleep can also impair immune system functioning and the body’s natural coping abilities, and can even have direct and indirect influences on mortality [7], The factors affecting sleep quality among adults were chronic headache, socioeconomic status (e.g., occupation), depression, subjective health status, sex, age, the number of times waking up to go to the bathroom, pain, and stress [6-9]. The quality of sleep also decreases after age 45, especially among women [10].
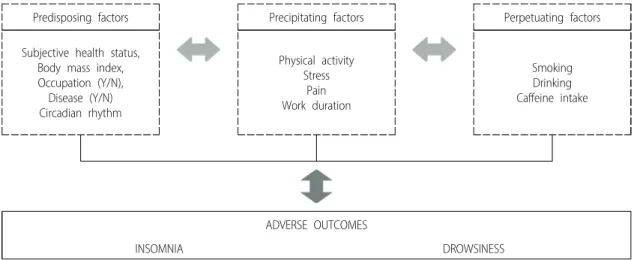
According to Spielman’s 3P biobehavioral model, a well-known model of sleep disorders, the factors influencing quality of sleep in
adults can be classified into predisposing factors, precipitating factors, and perpetuating factors, all of which organically interact with each other [11]. Predisposing factors (e.g., physical health) are considered the risk factors of sleep disorders, while precipitating factors (e.g., emotional and physical stress) act in the early stages of sleep disturbance to push individuals across the sleep disorder threshold. Upon crossing that threshold, the sleep disorder is sustained by perpetuating factors [8].
The present study investigated the quality of sleep, and its influencing factors, according to adult age groups based on Spielman’s 3P biobehavioral model. The aim was to provide baseline data for developing age-specific care strategies for sleep problems in adults.
Methods
1. Study Design
This descriptive survey used Spielman’s 3P biobehavioral model to explore the influencing factors of sleep quality according to age groups (Figure 1). According to this model, the influencing factors can be categorized into predisposing factors (subjective health status, body mass index [BMI], occupation, diseases, circadian rhythm), precipitating factors (physical activity, stress, pain, work duration), and perpetuating factors (smoking, drinking, caffeine intake). These factors are assumed to organically interact with each other [11].
2. Participants
The data were gathered over 3 months after receiving approval from the institutional review board in January 2016 (confirmation number:
AN01-201604-HR-001-01). The participants were adults ranging from
Predisposing factors Precipitating factors Perpetuating factors
Subjective health status, Body mass index, Occupation (Y/N), Disease (Y/N) Circadian rhythm
Physical activity Stress
Pain Work duration
Smoking Drinking Caffeine intake
ADVERSE OUTCOMES
INSOMNIA DROWSINESS
Figure 1. Theoretical framework
19 to 65 years old, who understood the purpose of the study, and who voluntarily agreed to participate in an internet survey. The study only included individuals living in metropolitan areas in order to control for possible sleep differences between adults living in rural areas and those living in cities. The survey used a self-report questionnaire. The exclusion criteria included those who had received a sleep disorder diagnosis from a hospital within the last 6 months, those who were taking medications related to sleep, and those residing in health care facilities. G*Power 3.1 was used to calculate the sample size based on a moderate effect size (0.15), a significance level of 0.05, and a statistical power of 0.80. According to this analysis, at least 376 subjects were needed. After considering the possible dropout rate, a target sample size of 426 was determined. In total, 450 questionnaires were obtained.
3. Measurements
The demographic characteristics included age, sex, marital status, education level, BMI, job status, work duration, underlying disease, alcohol consumption (times/week), caffeine intake (mg/day), smoking, and pain disturbance level. Caffeine intake was determined based on the average of 400 mg per day among adults in South Korea, according to the Korea Food and Drug Administration [12]. Pain disturbance level (i.e., the impact of pain on daily life) was evaluated using one item measured on a 5-point scale.
Sleep quality was measured using the Korean Modified Sleep Leeds Evaluation Questionnaire (KMLSEQ) [13]. The KMLSEQ measures 4 areas of sleep, including sleep patterns, sleep quality, waking patterns, and behavior after waking. Higher total sleep scores, derived from a set of 10 questions, indicated better sleep quality. A score below the cutoff of 66 indicated poor sleep quality. The Cronbach’s alpha of the instrument at the time of development was 0.78-.92 [14], and that in this study was 0.89.
Physical activity was assessed using the International Physical Activity Questionnaires (IPAQ), which required participants to record the weekly amount of intensive and moderate physical activity, and weekly amount of walking. The collected data was then used to calculate the metabolic equivalent task (MET) minutes based on the IPAQ point conversion method. The participants were subsequently classified into 3 groups: The light activity group comprised those who engaged in less than 600 MET-min of physical activity per week; the moderate activity group comprised those who engaged in at least 600 MET-min of activity for 5 or more days a week; and the vigorous activity group
comprised those who engaged in over 3000 MET-min of activity per week [15].
To determine morningness-eveningness, circadian rhythms were measured using Horne and Ostberg’s [16] self-assessment questionnaire, which was translated, supplemented, and revised by Lim [17]. This questionnaire comprises 19 items, and the scores for each item range from 0 to 6. The total score of the scale ranged from 16 to 86. The scoring criteria for determining sleep types are as follows: 16–41, evening type; 42–58 points, neither type; 59–86 points, morning type.
The Perceived Stress Scale (PSS) was developed by Cohen, Kamark, and Mermelstein [18]. Lee [19] then translated this tool into Korean, which we used in the present study. This scale comprises 10 items, with higher scores indicating higher levels of perceived stress. The Cronbach’s α was .83 in Lee’s [19]study and .76 in the present study.
Subjective health status was assessed using a Likert scale ranging from 1 to 5 points. Higher scores indicate a higher subjective health status.
4. Data Analysis
Data were analyzed by SPSS Statistics for Windows 22.0, using the analysis methods outlined below. Sociodemographic characteristics, physical activity status, circadian rhythms, perceived stress, and dietary intake were compared between the age groups using χ2 tests (Fisher’s exact test). Age differences in pain disturbance level, subjective health status, perceived stress, and quality of sleep were analyzed using one-way analyses of variance (ANOVAs); Scheffe’s test was used for the post-hoc analysis. The relationships between the major factors and quality of sleep were analyzed using the Pearson correlation coefficient in each age group. To explain the independent factors of quality of sleep in adults, all significant factors in the correlation analysis were included as response variables in a stepwise multiple regression analysis.
The significance level for the analyses was set at .05.
Results
1. Sociodemographic Characteristics of the Participants according to Age Groups
Of the 450 participants, 17.3% were in their 20s, 33.4% in their 30s, 30.4% in their 40s, and 18.9% were aged 50 years or over. More than 50% of participants in their 30s and 40s were male, while over 50%
of the participants in their 20s and those who were aged 50 or over were female. We found a significant difference in the age group
Age groups (yr)
χ2 or F (p) 20–29
(n=78)a
30–39 (n=150)b
40–49 (n=137)c
≥50 (n=85)d n (%) or Mean±SD
Gender Male 28 (35.9) 77 (51.3) 78 (56.9) 42 (49.4) 8.96
(.030)
Female 50 (64.1) 73 (48.7) 59 (43.1) 43 (50.6)
Marital status Unmarried 74 (94.9) 75 (50.0) 27 (19.7) 6 (7.1) 165.41
(<.001)
Married 4 (5.1) 75 (50.0) 110 (80.3) 79 (92.9)
Educational level <High school 32 (41.0) 16 (10.7) 24 (17.5) 22 (25.9) 30.85
(<.001)
>college 46 (59.0) 134 (89.3) 113 (82.5) 63 (74.1)
BMI (kg/m2)
<18.5 10 (12.8) 12 (8.0) 3 (2.2) 2 (2.4)
23.87 (.005)
18.5–22.9 46 (59.0) 84 (56.0) 66 (48.2) 52 (61.2)
23–24.9 8 (10.3) 26 (17.3) 38 (27.7) 14 (16.5)
≥25 14 (17.9) 28 (18.7) 30 (21.9) 17 (20.0)
Circadian rhythm
Evening type 8 (10.3) 13 (8.7) 5 (3.6) 6 (7.1)
6.84 (.336)
Neither type 70 (89.7) 132 (88.0) 127 (92.7) 76 (89.4)
Morning type - 5 (3.3) 5 (3.6) 3 (3.5)
Occupation Yes 36 (46.2) 130 (86.7) 115 (83.9) 62 (72.9) 52.95
(<.001)
No 42 (53.8) 20 (13.3) 22 (16.1) 23 (27.1)
Work duration (hours)
None 42 (53.8) 20 (13.3) 22 (16.1) 23 (27.1)
62.58 (<.001)
<8 21 (26.9) 57 (38.0) 55 (40.1) 35 (41.2)
9 9 (11.5) 46 (30.7) 32 (23.4) 12 (14.1)
10 2 (2.6) 18 (12.0) 18 (13.1) 12 (14.1)
≥11 4 (5.1) 9 (6.0) 10 (7.3) 3 (3.5)
Presence of a disease
Yes 9 (11.5) 17 (11.3) 15 (10.9) 24 (28.2) 16.14
(.001)
No 69 (88.5) 133 (88.7) 122 (89.1) 61 (71.8)
Physical activity (MET)
Light (<600) 16 (20.5) 42 (28.0) 28 (20.4) 10 (11.8)
11.14 (.084) Moderate
(600–2999) 39 (50.0) 67 (44.7) 69 (50.4) 40 (47.1)
Vigorous (≥3000) 23 (29.5) 41 (27.3) 40 (29.2) 35 (41.2)
Alcohol consumption (times/week)
None 38 (48.7) 47 (31.3) 45 (32.8) 26 (30.6)
17.74 (.038)
1/week 29 (37.2) 51 (34.0) 42 (30.7) 30 (35.3)
2/week 5 (6.4) 26 (17.3) 21 (15.3) 17 (20.0)
≥3/week 6 (7.7) 26 (17.3) 29 (21.2) 12 (14.1)
Caffeine intake (mg/day)
<400mg 67 (85.9) 135 (90.0) 115 (83.9) 73 (85.9) 2.41
(.492)
>400mg 11 (14.1) 15 (10.0) 22 (16.1) 12 (14.1)
Smoking
Smoke daily 10 (12.8) 43 (28.7) 34 (24.8) 25 (29.4)
31.43 (<.001)
Smoke sometimes 2 (2.6) 16 (10.7) 15 (10.9) 10 (11.8)
Ex-smoker 4 (5.1) 18 (12.0) 24 (17.5) 14 (16.5)
Non-smoker 62 (79.5) 73 (48.7) 64 (46.7) 36 (42.4)
Pain disturbance level 1.94±0.94 2.05±0.86 2.18±0.91 2.33±0.92 2.59 (.052)
Subjective health status 3.59±1.01 3.48±0.83 3.33±0.92 3.42±0.94 1.45 (.227)
Perceived stress 30.41±5.03 30.18±5.14 30.26±4.33 28.24±5.88 4.02 (.008)
d<a,b,c
Quality of Sleep
Mean 59.72±18.68 59.72±17.02 63.18±19.91 63.57±18.34 1.44 (.232)
Good (<66) 53 (67.9) 102 (68.0) 80 (58.4) 47 (55.3)
5.80 (.122)
Poor (≥66) 25 (32.1) 48 (32.0) 57 (47.6) 38 (44.7)
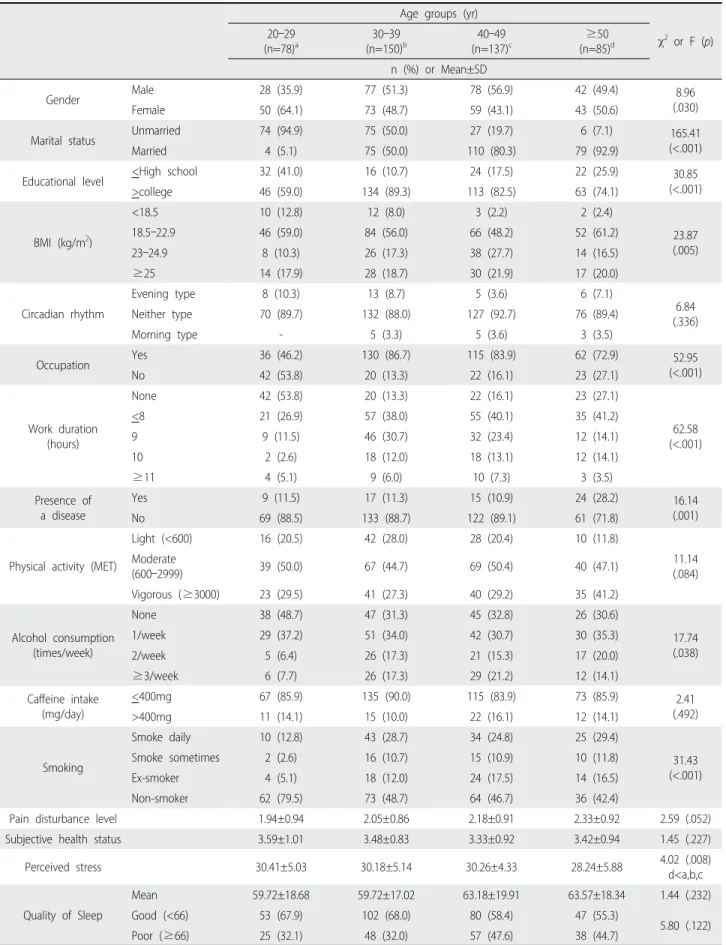
Table 1. Sociodemographic Characteristics of Participants According to Age Groups (N=450)
(p=.030). The proportion of married subjects also significantly differed by age groups (p<.001). Over 50% of participants in all age groups had attained an educational level higher than college, although there was still a significant difference by age (p<.001). The mean quality of sleep score was below 66 points (poor sleep) in all age groups, and over 55%
of the participants in each age group reported poor sleep. The quality of sleep did not significantly differ according to age.
2. Predisposing Factors
Classification of the sample according to BMI (low body weight, normal body weight, overweight, and obesity) showed that the proportion of participants who were overweight and obese increased with age, and there was a significant difference in proportion according to age (p=.005). The proportion of participants who had a job increased with age, although it began to decrease among those in aged 50 years and over; the proportions significantly differed by age groups (p<.001).
The proportion of participants suffering from some type of disease increased with age, and the age differences were significant (p=.001).
Over 80% of the participants in all age groups were categorized as having the “neither type” of circadian rhythm, and the proportions did not significantly differ by age. There was a declining trend in subjective health status from the 20s to 40s age groups, but participants aged 50 years or over reported a slightly better subjective health status; however, the answers did not significantly differ according to age.
3. Precipitating Factors
After dividing participants according to physical activity (into light activity [below 600 MET-min], moderate activity [600–2999 MET-min], and vigorous activity [over 3000 MET-min]), we found that the moderate activity was most prevalent in all age groups. The proportion of individuals engaged in vigorous activity was noticeably higher among individuals aged 50 years or over. However, there were no significant differences in activity level by age. There was a significant difference
in perceived stress according to age groups, and a post-hoc analysis showed that perceived stress was lower among individuals aged 50 years or over than among those in their 20s, 30s, and 40s (p=.008). The level of pain disturbance increased with aging, but it did not significantly differ according to age. Additionally, the number of groups working 8 hours per day increased with age, and there was a significant difference according to age groups (p<.001).
4. Perpetuating Factors
The number of participants currently smoking increased significantly from the 20s to 30s (p<.001). The number of individuals who never drank alcohol also decreased with age, and this age difference was significant (p=.038). Daily adult caffeine consumption was divided into two groups based on the Korea Food and Drug Administration’s standard of 400 mg. Consumption over 400 mg was considered excessive, while anything below 400 mg was considered appropriate.
Over 80% of participants in all the age groups consumed an appropriate amount of caffeine, and there was no significant difference according to age [20].
5. Correlation between Quality of Sleep and Independent Variables according to Age Groups
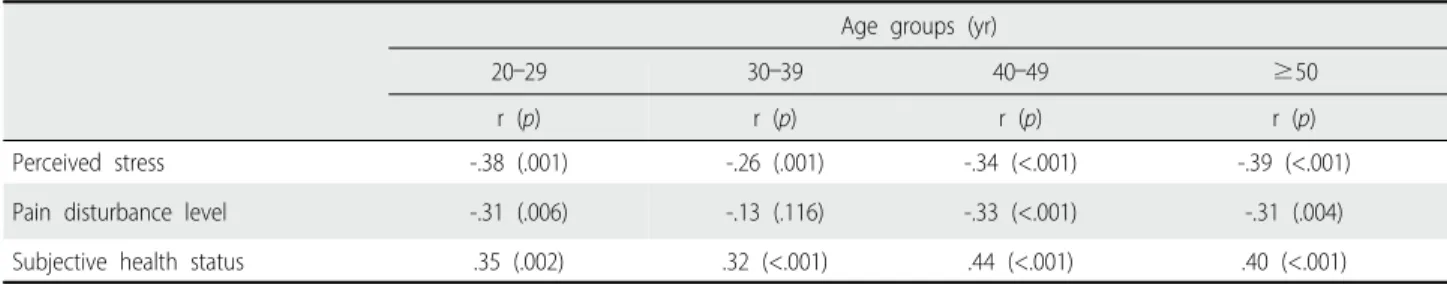
For adults in their 20s, 40s, and aged 50 years and over, quality of sleep was significantly correlated with perceived stress (20s: r=-.380, p=.001; 40s: r=-.34, p<.001; and aged 50 years and over: r=-.39, p<.001) and pain disturbance level (20s: r=-.31, p=.006; 40s: r=-.33, p<.001; aged 50 years and over: r=-.31, p<.001) (Table 2). A statistically significant correlation was also observed with the predisposing factor of subjective health status (20s: r=.35, p=.002; 40s: r=.44, p<.001; aged 50 years and over: r=.40, p<.001). These findings indicated that quality of sleep for adults in their 20s, 40s, and 50 years and over decreased as perceived stress and pain disturbance levels increased. However, quality of sleep increased with subjective health status. For adults in their 30s, however,
Age groups (yr)
20–29 30–39 40–49 ≥50
r (p) r (p) r (p) r (p)
Perceived stress -.38 (.001) -.26 (.001) -.34 (<.001) -.39 (<.001)
Pain disturbance level -.31 (.006) -.13 (.116) -.33 (<.001) -.31 (.004)
Subjective health status .35 (.002) .32 (<.001) .44 (<.001) .40 (<.001)
Table 2. Correlation between Sleep Quality and Independent Variables According to Age Groups (N=450)
quality of sleep showed a significant and negative correlation with perceived stress (r=-.26, p<.001), and although a positive association was observed between quality of sleep and subjective health status (r=.32, p<.001). Individuals in their 30s did not show a significant correlation between quality of sleep and pain disturbance levels.
6. Comparison of Factors Influencing Quality of Sleep in Adults according to Age Groups
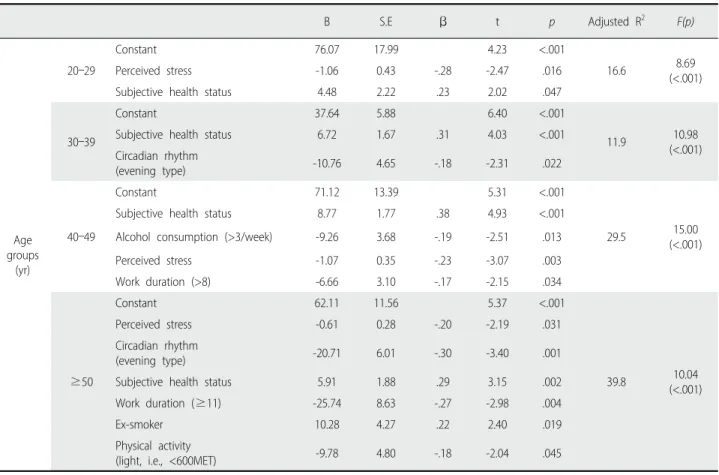
Circadian rhythms, BMI, work duration, physical activity, and smoking were processed as dummy variables to analyze the factors that affect quality of sleep in adults according to age group. Table 3 shows the results of the regression analysis. In the 20s group, perceived stress and subjective health status were shown as factors affecting the quality of sleep, and the explanatory power of this model was 16.6% (F=8.69, p<.001). In the 30s group, the predisposing factors of subjective health status and circadian rhythms (morning type) were found to influence quality of sleep; the explanatory power of this model was 11.9%
(F=10.98, p<.001). In the 40s group, the predisposing factor of subjective health status, the perpetuating factor of having 3 or more
alcoholic drinks per week (compared to less than 3 drinks per week), and the predisposing factor of working for fewer than eight hours per day (compared to less than eight hours) were significantly related to quality of sleep. The explanatory power of this model was 29.5%
(F=15.00, p<.001). Among those aged 50 years and over, the following were factors significantly related to quality of sleep, presented in order of effect: the precipitating factor of perceived stress, the predisposing factors of circadian rhythm (evening type) and subjective health status, the precipitating factor of working for more than 11 hours per day, the perpetuating factor of past smoking habits, and the precipitating factor of engaging in light activity (below 600 MET-min). The explanatory power of this model was 39.8% (F=10.04, p<.001).
Discussion
This study explored the factors that influence the quality of sleep according to age groups using Spielman’s 3P biobehavioral model. The goal of this study was to provide baseline data aiding in the development of differentiated sleep intervention methods based on age groups.
B S.E β t p Adjusted R2 F(p)
Age groups
(yr)
20–29
Constant 76.07 17.99 4.23 <.001
16.6 8.69
(<.001)
Perceived stress -1.06 0.43 -.28 -2.47 .016
Subjective health status 4.48 2.22 .23 2.02 .047
30–39
Constant 37.64 5.88 6.40 <.001
11.9 10.98
(<.001)
Subjective health status 6.72 1.67 .31 4.03 <.001
Circadian rhythm
(evening type) -10.76 4.65 -.18 -2.31 .022
40–49
Constant 71.12 13.39 5.31 <.001
29.5 15.00
(<.001)
Subjective health status 8.77 1.77 .38 4.93 <.001
Alcohol consumption (>3/week) -9.26 3.68 -.19 -2.51 .013
Perceived stress -1.07 0.35 -.23 -3.07 .003
Work duration (>8) -6.66 3.10 -.17 -2.15 .034
≥50
Constant 62.11 11.56 5.37 <.001
39.8 10.04
(<.001)
Perceived stress -0.61 0.28 -.20 -2.19 .031
Circadian rhythm
(evening type) -20.71 6.01 -.30 -3.40 .001
Subjective health status 5.91 1.88 .29 3.15 .002
Work duration (≥11) -25.74 8.63 -.27 -2.98 .004
Ex-smoker 10.28 4.27 .22 2.40 .019
Physical activity
(light, i.e., <600MET) -9.78 4.80 -.18 -2.04 .045
Table 3. Comparison of Factors Influencing Quality of Sleep in Adults According to Age Groups (N=450)
An appropriate amount of sleep is crucial for maintaining health and is arguably the best method of restoring physical and mental functioning [1]. Despite this, we found that all age groups showed poor quality sleep, with the younger age groups showing the worst (although the differences by age were not significant). This result runs counter to the notion that quality of sleep and the amount of time spent sleeping decreases with age [7] but coincides with the findings of studies that reported decreased quality of sleep in adults in their 20s [21]. Additionally, over 55.0% of participants in all adult age groups showed poor quality of sleep. This is higher than the percentage in preceding studies, where poor quality of sleep was found in around 44.7% of Korean adults, 34.9% of Australian adult women aged 34.3–
67.4 years, 16.0% of Chinese adults aged 50–70 years, and 38.2% of Spanish adults aged 43–71 years [9,10,22,23]. Results of this study suggest that the sleep quality of adults of all ages in Korea is worse than what has been found in existing domestic and foreign studies.
Therefore, it is necessary to develop proactive sleep intervention methods tailored to specific age groups to prevent problems resulting from poor quality of sleep.
The factors affecting the quality of sleep in 20's age group were perceived stress and subjective health status. This was similar to the findings of preceding studies, which showed that the risk of sleep disorders for adults in their 20s increased when their subjective health status declines, and that insufficient sleep or sleep disorders can arise from increased stress and job dissatisfaction [21,24].The findings also do not differ from those of another study showing that many nursing students experience sleep disturbances and that there is a significant relationship between sleep quality and stress [25].
These findings may only indicate that the quality of sleep for young adults in their 20s is more affected by their own understanding of their health status than by any actual disease, which could be related to young adults being more sensitive to accepting a negative subjective health status [9]. Therefore, for adults in their 20s, there should be various practical intervention programs aimed at lowering the level of stress, which could help to improve their quality of sleep.
For adults in their 30s, poor subjective health status negatively affected quality of sleep, particularly among those with the evening type of circadian rhythm. Another study also showed that poor health status in adults, resulting from the predisposing factor of physical pain, leads to insufficient sleep [26]. Similarly, the evening type was the most prevalent circadian rhythm among adults in their early 30s, and it
negatively affected the quality of sleep [7,27,28]. These results indicate that the evening type of circadian rhythm and activities associated with it, such as drinking, negatively affect the quality of sleep for adults in their 30s and 40s [29]. We should also note that one reason for the low explanatory power of the factors affecting the quality of sleep for adults in their 30s is that much sleep research has been conducted using college students and middle-aged participants, or elderly subjects.
When constructing a study based on variables in previous studies, it appears to be more difficult to unveil the factors affecting the quality of sleep for adults in their 30s.
In addition to the predisposing factor of subjective health status, the following were shown to be factors negatively affecting the quality of sleep among adults in their 40s: the perpetuating factor of having 3 or more alcoholic drinks per week and the precipitating factor of working for more than 8 hours per day. The results for alcohol consumption suggest that it increases sleep-related problems. The average consumption of alcohol in South Korea is high and drinking and alcohol dependency problems are highest among adults in their 30s and 40s. Alcohol consumption increases the duration of slow-wave sleep and decreases rapid-eye-movement sleep [3,29]. Furthermore, similar to earlier research showing that long office hours for middle-aged adults negatively affect sleep duration, decreasing the number of daily office hours to below 8 hours positively affects the quality of sleep [30]. Thus, we suggest applying interventions that consider the specific health behaviors and life habits of individuals to ensure improvements in subjective health and sleep status.
The following were identified as factors affecting the quality of sleep for adults in aged 50 years and over, in this order: the precipitating factor of high stress levels, the predisposing factor of the evening type of circadian rhythm, poor subjective health status, the precipitating factor of working for more than 11 hours per day, the perpetuating factor of past smoking habits, and the precipitating factor of low physical activity (below 600 MET-min). The findings accord with those of earlier studies showing that health status, depression, amount of sleep, low physical activity, smoking, alcohol consumption, and obesity affected the quality of sleep [22,26,30]. In earlier studies, the morning type of circadian rhythm became increasingly more prevalent as age increased; in this study, however, the neither type was the most prevalent among all the age groups, and the morning type decreased as age increased [7,27,28]. These results might be because 72.9% of the subjects aged 50 years old or older in this study had a job and 31.7%
worked for more than 8 hours a day, meaning that the evening type of circadian rhythm negatively affected quality of sleep.
We did not consider emotional variables (except stress) or menopause in this study. In addition, some variables such as physical activity and caffeine intake were measured only using a questionnaire; thus, there are limitations in the interpretation of our results. Future research is required including emotional variables and physiological measurements.
Finally, we suggest the development of a comprehensive sleep intervention program considering both physical and emotional health states.
Conclusion
This study revealed that the quality of sleep was poor among adults of all age groups in South Korea. Moreover, the factors affecting the quality of sleep differed according to age groups, although they in general suggested that maintaining health status should be included in sleep interventions for all age groups. In addition, age-specific interventions for improving the quality of sleep should be developed.
Specifically, the intervention needs the following: stress management for adults in their 20s; consideration of circadian rhythms for adults in their 30s; controlled alcohol consumption and working hours for adults in their 40s; and stress management, consideration of circadian rhythm, decreased smoking, and increased physical activity for adults aged 50 years or over.
ORCID
Choi, Jin Yi https://orcid.org/0000-0003-3257-0465
Park, Young Mi https://orcid.org/0000-0003-4330-5843
Choi, Dug Ja https://orcid.org/0000-0002-1018-3926
Ha, Young Ok https://orcid.org/0000-0002-6168-2047
REFERENCES
1. Edell-Gustafsson UM, Kritz EI, Bogren IK. Self-reported sleep quality, strain and health in relation to perceived working conditions in females. Scandinavian Journal of Caring Science. 2002;16:179-87.
https://doi.org/10.1046/j.1471-6712.2002.00078.x
2. Krystal AD, Edinger JD. Measuring sleep quality. Sleep Medicine.
2008;9(Suppl1):S10-7. https://doi.org/10.1016/S1389-9457(08)70011-X 3. Crum RM, Storr CL, Chan YF, Ford DE. Sleep disturbance and
risk for alcohol-related problems. American Journal of Psychiatry.
2004;161(7): 1197-203. https://doi.org/10.1176/appi.ajp.161.7.1197
4. Ayas NT, White DP, Al-Delaimy WK, Manson JE, Stampfer MJ, Speizer FE, et al. A prospective study of self-reported sleep duration and incident diabetes in women. Diabetes Care. 2003;26(2):380-4. https://doi.org/10.2337/
diacare.26.2.380.
5. Ministry of Health and Welfare Korea Center for Disease Control and Prevention. Korea Health Statistics 2010: Korean National Health and Nutrition Examination Survey (KNHANES V-1). Seoul: Korea Center for Disease Control and Prevention; 2011.
6. Choi HJ, Kim BM, Kim IJ. Prevalence and risk factors of sleep disturbance in community dwelling adults in Korea. Korean Journal of Adult Nursing.
2013;25(1):183-93. https://doi.org/:10.7475/kjan.2013.25.1.183
7. Luca G, Haba Rubio JH, Andries D, Tobback N, Vollenweider P, Waeber G, et al. Age and gender variations of sleep in subjects without sleep disorders. Annals of Medicine. 2015;47(6):482-91. https://doi.org/10.3109/
07853890.2015.1074271
8. Ong JC, Park M. Chronic headaches and insomnia: Working toward a biobehavioral model. Cephalalgia. 2012;32(14):1059-70. https://doi.org/
10.1177/0333102412455709.
9. Yi HR. Sleep quality and its associated factors in adults. Journal of Korean Public Health Nursing. 2013;27(1):76-88. https://doi.org/10.5932/
JKPHN.2013.27.1.76
10. Madrid-Valero JJ, Martínez-Selva JM, Ribeiro do Couto B, Sánchez- Romera JF, Ordoñana JR. Age and gender effects on the prevalence of poor sleep quality in the adult population. Gaceta Sanitaria. 2017;31 (1):18-22. https://doi.org/10.1016/j.gaceta.2016.05.013
11. Kryger M, Roth T, Dement M. Principles and practices of sleep medicine 4th ed. Philadelphia, PA: Saunders; 2005. pp. 1359-77.
12. Ministry of Food and Drug Safety (2019). Issue 16. Caffeine. Available from https://www.foodsafetykorea.go.kr/portal/board. Revised Mar 2019.
13. Choi HJ, Kim SJ, Kim BJ, Kim IJ. Korean versions of self-reported sleep questionnaires for research and practice on sleep disturbance. Korean Journal of Rehabilitation Nursing. 2012;15(1):1-10. https://doi.org/
10.7587/kjrehn.2012.1
14. Tarrasch R, Laudon M, Zisapel N. Cross-cultural validation of the Leeds Sleep Evaluation Questionnaire (LSEQ) in insomnia patients. Human Psychopharmacology: Clinical & Experimental. 2003;18(8):603-10. https://
doi.org/10.1002/hup.534
15. IPAQ Research Committee. Guidelines for data processing and analysis of the international physical activity questionnaire (IPAQ) - short and long forms. Available from https://sites.google.com/site/theipaq/questionnaire_
links. Revised Nov 2005.
16. Horne JA, Ostberg O. A self-assessment questionnaire to determine morningness-eveningness in human circadian rhythms. International Journal of Chronobiology. 1976;4(2):97-110.
17. Lim NY. Effect of shift rotation on the circadian rhythm. Unpublished doctoral dissertation. Seoul: Yonsei University; 1985.
18. Cohen S, Kamarck T, Mermelstein R. A global measure of perceived stress. Journal of Health and Social Behavior. 1983;24(4):385-96.
http://dx.doi.org/10.2307/2136404
19. Lee JE. The effects of self-complexity and self-efficacy on depression and perceived stress. Unpublished master’s thesis. Suwon: Ajou University;
2005.
20. Korea Ministry of Food and Drug Safety. Caffeine Intake Assessment Results. Available from http://www.mfds.go.kr/brd/m_99/view.do?seq=
28091. Published June 30, 2015. Accessed October 24, 2016.
21. Doi Y, Minowa M, Tango T. Impact and correlates of poor sleep quality in Japanese white-collar employees. Sleep. 2003;26(4):467-71.
22. Haseli-Mashhadi N, Dadd T, Pan A, Yu Z, Lin X, Franco OH. Sleep quality in middle-aged and elderly Chinese: Distribution, associated factors and associations with cardio-metabolic risk factors. BMC Public Health.
2009;9(9):130-40. https://doi.org/10.1186/1471-2458-9-130.
23. Soltani M, Haytabakhsh MR, Najman JM, Williams GM, O'Callaghan MJ, Bor W, et al. Sleepless nights: The effect of socioeconomic status, physical activity and lifestyle factors on sleep quality in a large cohort of Australian women. Archives of Women’s Mental Health. 2012;15(4):
237-47. https://doi.org/10.1007/s00737-012-0281-3
24. Jung SH, Park J. Effect of life stress on the sleeping disorder of university student. The Journal of the Korea Institute of Electronic Communication Sciences. 2013;8(2):345-53. https://doi.org/10.13067/JKIECS.2013.8.2.345 25. Kang Y, Oh SH, Hong HC. The relationship between sleep quality
and stress among nursing students in Korea. Journal of Korean Biological Nursing Science. 2018;20(1):30-7. https://doi.org/10.7586/jkbns.2018.20.
1.30.
26. Strine TW, Chapman DP. Associations of frequent sleep insufficiency with health-related quality of life and health behaviors. Sleep Medicine.
2005;6(1):23-7.https://doi.org/10.1016/j.sleep.2004.06.003
27. Roenneberg T, Kuehnle T, Juda M, Kantermann T, Allebrandt K, Gordijn M, et al. Epidemiology of the human circadian clock. Sleep Medicine Review. 2007;11(6):429-38. https://doi.org/10.1016/j.smrv.2007.07.005 28. Paine SJ, Gander PH, Travier N. The epidemiology of morningness/
eveningness: Influence of age, gender, ethnicity, and socioeconomic factors in adults (30-49 years). Journal of Biological Rhythms. 2006; 21(1):68-76.
https://doi.org/10.1177/0748730405283154
29. World Health Organization. Global status report on alcohol and health 2014. Available from http://www.who.int/substance_abuse/publications/
global_alcohol_report/msb_gsr_2014_1.pdf?ua=1
30. von Bonsdorff MB, Strandberg A, von Bonsdorff M, Törmäkangas T, Pitkälä KH, Strandberg TE. Working hours and sleep duration in midlife as determinants of health-related quality of life among older businessmen.
Age and Ageing. 2016;46(1):108-12. https://doi.org/10.1093/ageing/afw178