• 검색 결과가 없습니다.

Electrocardiography Patterns and the Role of the Electrocardiography Score for Risk Stratification in Acute Pulmonary Embolism

N/A
N/A
Protected

Academic year: 2022

Share "Electrocardiography Patterns and the Role of the Electrocardiography Score for Risk Stratification in Acute Pulmonary Embolism"

Copied!
8
0
0

로드 중.... (전체 텍스트 보기)

전체 글

(1)

499

Open Access

Electrocardiography Patterns and the Role of the Electrocardiography Score for Risk Stratification in Acute Pulmonary Embolism

Hyeon Min Ryu, MD

1

, Ju Hwan Lee, MD

2

, Yong Seop Kwon, MD

3

, Sang Hyuk Lee, MD

1

, Myung Hwan Bae, MD

1

, Jang Hoon Lee, MD

1

, Dong Heon Yang, MD

1

, Hun Sik Park, MD

1

, Yongkeun Cho, MD

1

, Shung Chull Chae, MD

1

, Jae-Eun Jun, MD

1

and Wee-Hyun Park, MD

1

1

Department of Internal Medicine, Kyungpook National University Hospital, Daegu,

2

Department of Internal Medicine, CHA University, CHA Gumi Medical Center, Gumi,

3

Department of Internal Medicine, Busan St. Mary’s Medical Center, Busan, Korea

ABSTRACT

Background and Objectives: Data on the usefulness of a combination of different electrocardiography (ECG) abnormali- ties in risk stratification of patients with acute pulmonary embolism (PE) are limited. We thus investigated 12-lead ECG patterns in acute PE to evaluate the role of the ECG score in risk stratification of patients with acute PE. Subjects and Methods:

One hundred twenty-five consecutive patients (63±14 years, 56 men) with acute PE who were admitted to Kyungpook Na- tional University Hospital between November 2001 and January 2008 were included. We analyzed ECG patterns and calcu- lated the ECG score in all patients. We evaluated right ventricular systolic pressure (RVSP) (n=75) and RV hypokinesia (n=

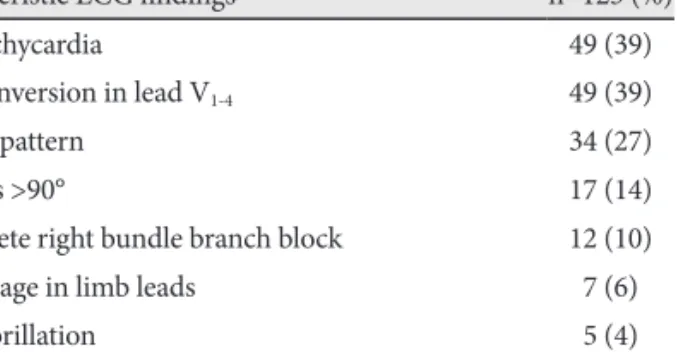
80) using echocardiography for risk stratification of acute PE patients. Results: Among several ECG findings, sinus tachy- cardia and inverted T waves in V
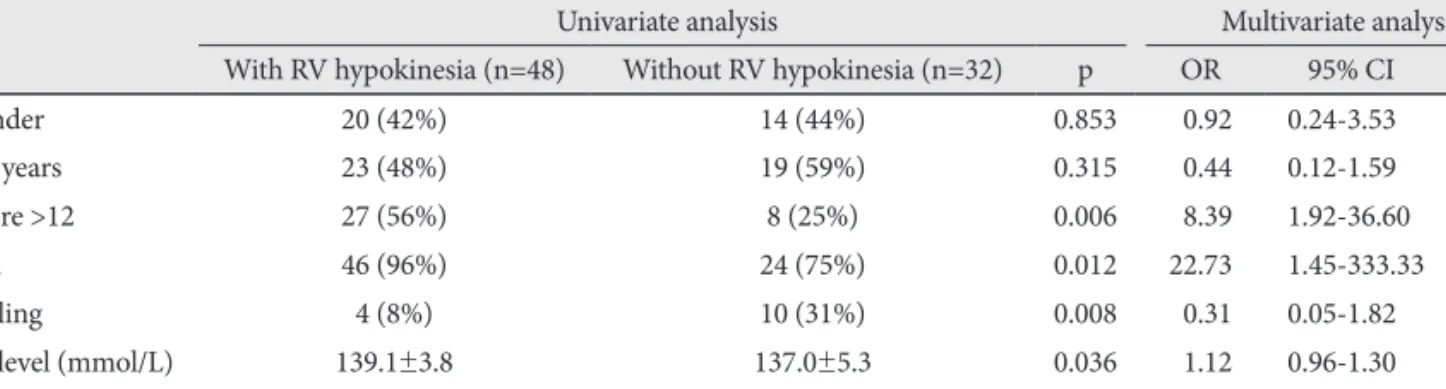
1-4

(39%) were observed most frequently. The mean ECG score and RVSP were 7.36±6.32 and 49±21 mmHg, respectively. The ECG score correlated with RVSP (r=0.277, p=0.016). The patients were divided into two groups {high ECG-score group (n=38): ECG score >12 and low ECG-score group (n=87): ECG score ≤12} based on the ECG score, with the maximum area under the curve. RV hypokinesia was observed more frequently in the high ECG-score group than in the low ECG-score group (p=0.006). Multivariate analysis revealed that a high ECG score was an independent predictor of high RVSP and RV hypokinesia. Conclusion: Sinus tachycardia and inverted T waves in V

1-4

were commonly observed in acute PE. Moreover, the ECG score is a useful tool in risk stratification of patients with acute PE. (Korean Circ J 2010;40:499-506)

KEY WORDS: Pulmonary embolism; Electrocardiography; Right ventricle; Systolic pressure.

Received: February 25, 2010 Revision Received: March 22, 2010 Accepted: April 14, 2010

Correspondence: Yongkeun Cho, MD, Department of Internal Medi- cine, Kyungpook National University Hospital, 200 Dongdeok-ro, Jung-gu, Daegu 700-721, Korea

Tel: 82-53-420-5528, Fax: 82-53-426-2046 E-mail: [email protected]

cc

This is an Open Access article distributed under the terms of the Cre- ative Commons Attribution Non-Commercial License (http://creativecom- mons.org/licenses/by-nc/3.0) which permits unrestricted non-commer- cial use, distribution, and reproduction in any medium, provided the origi- nal work is properly cited.

Introduction

Acute pulmonary embolism (PE) is a serious disease with a wide range of possible in-hospital outcomes, so early risk stratification is essential for appropriate management.

1)

PE is

diagnosed by several imaging tools, including pulmonary perfusion-ventilation scan, chest computed tomography (CT), and pulmonary angiography, which have the drawbacks of being time-consuming and requiring specialized facilities. Al- though the role of electrocardiography (ECG) in the diagno- sis of acute PE has been rendered less important by the wide- spread use of new diagnostic modalities, particularly 2-dimen- sional (2-D) echocardiography and chest CT, ECG is con- sidered as a simple and economical tool for suspecting acute PE due to its association with various ECG abnormalities. El- evation of pulmonary artery pressure caused by occlusion of the pulmonary artery with embolism increases right ventri- cle (RV) wall stress, leading to RV dilation and dysfunction.

In turn, the dilated RV compresses the interventricular sep-

tum or the right coronary artery, causing RV ischemia. Dis-

tinctive ECG patterns including sinus tachycardia, atrial fibril-

(2)

lation (AF) or flutter of new onset, the presence of a S wave in lead I and of a Q wave in lead III in association with nega- tive T waves in lead III, rightward deviation of the QRS axis, and inverted precordial T waves are caused by functional or structural RV changes attributable to pressure overload.

2)

Al- though data on each ECG abnormality affecting risk stratifi- cation of acute PE are available, data on the usefulness of a combination of different ECG abnormalities, as captured by the ECG score, in risk stratification of patients with acute PE are limited. The present study therefore was intended to in- vestigate 12-lead ECG patterns in patients with acute PE and to evaluate the role of the ECG score in PE-associated risk stratification.

Subjects and Methods

Patients

One hundred twenty-five consecutive patients with acute PE who were admitted to Kyungpook National University Hos- pital between November 2001 and January 2008 were includ- ed in the present study. Data including initial vital signs were retrospectively collected. Acute PE was confirmed by chest or deep vein thrombosis (DVT) CT scan or pulmonary perfu- sion-ventilation scan. Patients with undetermined onset of PE or without available interpretable ECGs were excluded from the present study. This study was approved by the local Insti- tutional Review Board, and informed consent was waived.

Electrocardiographic analysis

Twelve-lead ECGs were recorded on admission at a paper speed of 25 mm/second and amplification of 10 mm/mV.

All ECGs were examined by at least two cardiologists who were blinded to all other clinical findings. We measured and detected heart rate (HR), electrical axis, the presence of AF and right bundle branch block (RBBB), and voltages of P, QRS, and T waves in standard 12-lead ECGs. Inverted T waves were considered present if the depth was >0.5 mm in any lead except lead aVR or lead aVL. Sinus tachycardia was defined as HR >100 beats/minute, and right-axis deviation was de- fined as QRS electrical axis >90°. RBBB was defined as QRS duration ≥120 msec with typical RBBB morphologies, in- cluding a terminal R wave in lead V

1

and slurred S waves in leads I and V

6

, and incomplete RBBB was defined as 100 msec < QRS duration <120 msec with typical RBBB morphol- ogies. S

I

Q

III

T

III

was defined as the presence of S wave in lead I and Q wave in lead III, each having amplitudes of ≥1.5 mm, in association with negative T wave in lead III. Low voltage was defined as the greatest overall deflection of the QRS complex ≤5 mm in all limb leads.

Calculation of the ECG score, which was proposed by Dan- iel et al.

3)

was performed in all patients on the basis of ECG findings (Table 1).

Echocardiographic analysis

Two-D echocardiography was performed in available pa- tients (n=80) who had access to a commercially available ma- chine on the day of admission or during the early days of hos- pitalization. Echocardiographic findings were read by two cardiologists blinded to the clinical information of patients studied. Echocardiographic parameters, including degree of tricuspid regurgitation (TR), RV systolic pressure (RVSP), RV dimension, the presence of RV hypokinesia, the presence of D-like shape of left ventricle (LV), LV ejection fraction (LVEF), transmitral early-to-late diastolic velocity ratio (E/A), and transmitral-to-tissue Doppler imaging (TDI) early diastolic velocity ratio (E/Ea), were all assessed using 2-D echocardiog- raphy. RVSP was calculated with the following formula: “RVSP (mmHg)=4×TR flow velocity (m/second)

2

+10 (mmHg),” us- ing the TR flow velocity measured by Doppler echocardiog- raphy.

4)

RVSP and the presence of RV hypokinesia were used to evaluate PE-associated risk stratification in available pa- tients (n=75, n=80, respectively).

Hematological analysis

Hematological parameters, including white blood cell count, Table 1. ECG scoring method used in this study

3)

Characteristics Score

Tachycardia (>100 beats/minute) 2

Incomplete right bundle branch block* 2

Complete right bundle branch block

3

T wave inversion in leads V

1

-V

4

4

T wave inversion in lead V

1

(mm)

<1 0

1-2 1

>2 2

T wave inversion in lead V

2

(mm)

<1 1

1-2 2

>2 3

T wave inversion in lead V

3

(mm)

<1 1

1-2 2

>2 3

S wave in lead I

0

Q wave in lead III

§

1

Inverted T wave in lead III 1

If all of S

I

Q

III

T

III

2

Total score (maximum=21)

*QRS complex of 0.10 to 0.11 second and a S wave in lead I and ter-

minal R wave in lead V

1

>1.5 mm,

QRS >0.11 second and S wave in

lead I and terminal R wave in lead V

1

>1.5 mm,

First negative de-

flection after a R wave >1.5 mm,

§

First negative deflection after the P

wave and before any R wave >1.5 mm. ECG: electrocardiography

(3)

hemoglobin level, hematocrit, platelet count, blood urea ni- trogen, creatinine, sodium, potassium, N-terminal pro-brain natriuretic peptide (NT-proBNP), cardiac troponin I (cTnI), D-dimer concentration, PaCO

2

, and prothrombin time, were measured on the day of admission in available patients.

Statistical analysis

We analyzed data using the Statistical Package for the So- cial Sciences (SPSS) software (version 15.0; SPSS, Inc., Chica- go, IL, USA). Data are expressed as mean±standard deviation for continuous variables and number (percentage) for cate- gorical variables. Student’s t-test and Chi-square analyses were used for comparisons of either continuous variables or categorical variables, respectively, while simple Pearson’s cor- relation was used to examine the relationship between two parameters. A cut-off value of the ECG score was set on the basis of receiver operating characteristics (ROC) curve analy- sis to predict a high RVSP. Univariate predictors of high RV- SP and RV hypokinesia were included in the multivariate lo- gistic regression analyses. Kaplan-Meier survival curves were used to analyze follow-up clinical outcomes. A p less than 0.05 was considered statistically significant.

Results

Demographic and clinical characteristics

Demographic and clinical characteristics of the patients with

acute PE are listed in Table 2. The mean age of the study pop- ulation was 62.7±13.6 years. The number of male and female patients was 56 and 69, respectively. Dyspnea was the most common symptom/sign and hypertension was the most com- mon comorbid disease. A current or former smoking history was the most common predisposing factor for acute PE. DVT was found in 62 patients (50%) with acute PE. The mean sys- tolic and diastolic initial BP were 127 and 76 mmHg.

Electrocardiography characteristics

The mean QRS axis was 43±56°, and 17 patients (14%) had a QRS axis >90°. Mean HR was 96±20/minute, and 49 pa- tients (39%) had sinus tachycardia. Incomplete RBBB was observed in 12 patients (10%), AF in 5 patients (4%), and low voltage in limb leads in 7 patients (6%). Complete RBBB was detected in no case. Among several ECG findings, sinus tachycardia (39%) and inverted T waves in V

1-4

(39%) were the most frequently observed findings, followed by S

I

Q

III

T

III

(27%) (Table 3). The mean ECG score was 7.36±6.32.

Echocardiographic and hematological findings Echocardiographic and hematological findings in avail- able patients with acute PE are listed in Table 4. RV dilation, RV hypokinesia, and D-like shape of the LV were observed in 55 (69%), 48 (60%) patients, and 45 (56%) patients, respec- tively. Twenty-six (35%) patients had moderate or severe TR.

Mean RVSP was 49.0±21.0 mmHg. Patients with RVSP >50 Table 2. Demographic characteristics of patients with acute pulmonary embolism according to ECG score

  All patients (n=125) Low ECG-score group (n=87) High ECG-score group (n=38) p

Age (years) 62.7±13.6 61.8±13.3 64.8±14.2 0.257

Male sex, n (%) 056 (45) 39 (45) 17 (45) 0.993

Symptom/Sign, n (%)

Dyspnea 101 (81) 68 (78) 33 (87) 0.257

Chest pain 042 (34) 25 (29) 17 (45) 0.081

Leg swelling 032 (26) 26 (30) 06 (16) 0.097

Cough 020 (16) 16 (18) 04 (11) 0.270

Leg pain 019 (15) 17 (20) 2 (5) 0.041

Syncope 011 (9)0 6 (7) 05 (13) 0.307

Comorbid diseases, n (%)

Hypertension 035 (28) 22 (25) 13 (34) 0.307

Diabetes mellitus 023 (18) 16 (18) 07 (18) 0.997

Pulmonary tuberculosis 016 (13) 15 (17) 1 (3) 0.038

Angina/MI 009 (7)0 5 (6) 04 (11) 0.453

Deep vein thrombosis 062 (50) 42 (48) 20 (53) 0.654

Predisposing factors, n (%)

Cancer 035 (28) 29 (33) 06 (16) 0.044

Immobilization 022 (18) 14 (16) 08 (21) 0.503

Surgery 017 (14) 12 (14) 05 (13) 0.924

Data are expressed as mean±standard deviation or percentage of patients. ECG: electrocardiography, MI: myocardial infarction

(4)

mmHg were defined as having a high RVSP. Mean LVEF was 60.5±7.9%, mean E/A was 0.8±0.4, and mean E/Ea was 11.5±

3.5. Mean NT-proBNP and cTnI concentrations were 2,893±

4,664 pg/mL and 0.31±0.66 ng/mL, respectively.

Relationship between electrocardiography findings and right ventricular systolic pressure

There were inverse correlations between RVSP and the R/S ratio in lead I (r=-0.308, p=0.019), T wave amplitude in lead

II (r=-0.259, p=0.025), and T wave amplitude in lead V

4

(r=

-0.227, p=0.050) (Fig. 1A, B and C). There was a positive cor- relation, however, between RVSP and the ECG score (r=0.277, p= 0.016) (Fig. 1D).

Receiver operating characteristics curve predicting right ventricular systolic pressure

Fig. 2 shows the ROC curve predicting RVSP. The area un- der the curve was 0.68 {95% confidence interval (CI) 0.56- 0.81} at the point corresponding to an ECG score of 12, where sensitivity was 60% and specificity was 77%. Hence, study patients were divided into two groups on the basis of ECG score {high ECG-score group (n=87): ECG score >12; and low ECG-score group (n=38): ECG score ≤12}.

Demographic and clinical characteristics according to electrocardiography score

Table 2 displays comparisons of demographic characteris- tics between the high and low ECG-score groups. There was no significant difference between the groups in terms of age and gender. With the exception of decreased frequency of leg pain in the high ECG-score group, there was no signifi- Table 3. Incidence of characteristic ECG findings in patients with

acute pulmonary embolism

 Characteristic ECG findings n=125 (%)

Sinus tachycardia 49 (39)

T wave inversion in lead V

1-4

49 (39)

S

I

Q

III

T

III

pattern 34 (27)

QRS axis >90° 17 (14)

Incomplete right bundle branch block 12 (10)

Low voltage in limb leads 7 (6)

Atrial fibrillation 5 (4)

Data are expressed as percentage of patients. ECG: electrocardiog- raphy

Table 4. Echocardiographic and hematological findings of patients with acute pulmonary embolism according to ECG score

  All patients Low ECG-score group High ECG-score group p

Echocardiographic findings

RV dilation, n (%)* 55 (69) 24 (53) 31 (89) 0.001

RV hypokinesia, n (%)* 48 (60) 21 (47) 27 (77) 0.006

D-like shape of LV, n (%)* 45 (56) 18 (40) 27 (77) 0.001

Moderate or severe TR, n (%)

26 (35) 09 (22) 17 (50) 0.011

RVSP (mmHg)

049.0±21.0 42.9±20.0 056.4±20.2 0.005

LVEF (%)* 60.5±7.9 60.0±9.50 61.2±5.2 0.505

E/A

00.8±0.4 0.8±0.3 00.7±0.4 0.603

E/Ea

§

11.5±3.5 11.3±3.40 12.1±3.8 0.555

Hematological findings

WBC count (per μL) 10,529±4,769 10,914±5,2700 09,646±3,245 0.173

Hematocrit (%) 36.2±5.4 35.6±5.40 37.7±5.4 0.048

Platelet count (per μL) 242,540±97,304 250,400±105,496 224,530±73,375 0.172

BUN (mg/dL) 018.5±10.8 18.5±12.1 18.7±7.2 0.922

Creatinine (mg/dL) 00.93±0.46 0.92±0.51 00.96±0.31 0.660

Sodium (mmol/L) 0147.1±107.1 150.6±128.4 139.0±3.70 0.579

Potassium (mmol/L) 04.2±0.6 4.2±0.6 04.1±0.5 0.248

NT-proBNP (pg/mL)

02,893±4,664 1,554±3,353 05,432±5,709 0.002

cTnI (ng/mL)** 00.31±0.66 0.27±0.55 00.38±0.83 0.401

D-dimer (μg/L)

††

00.940±1,280 0,934±1,395 00,953±1,019 0.946

Data are expressed as mean±standard deviation or percentage of patients. *All patients: n=80, low ECG-score group: n=45, high ECG-score group: n=35,

All patients: n=75, low ECG-score group: n=41, high ECG-score group: n=34,

All patients: n=49, low ECG-score group: n=29, high ECG-score group: n=20,

§

All patients: n=31, low ECG-score group: n=22, high ECG-score group: n=9,

All patients: n=84, low ECG-score group:

n=55, high ECG-score group: n=29, **All patients: n=112, low ECG-score group: n=74, high ECG-score group: n=38,

††

All patients: n=104, low ECG-score group: n=70, high-ECG-score group: n=34. BUN: blood urea nitrogen, cTnI: cardiac troponin I, E/A: transmitral early-to-late diastolic velocity ratio, E/Ea: transmitral-to-tissue Doppler imaging early diastolic velocity ratio, LV: left ventricle, LVEF: LV ejection fraction, NT-proBNP:

N-terminal pro-brain natriuretic peptide, RV: right ventricle, RVSP: RV systolic pressure, TR: tricuspid regurgitation, WBC: white blood cell

(5)

cant difference in occurrence of symptoms/signs between the groups. No difference in the prevalence of comorbid dis- eases was observed between the two groups with the excep- tion of a decreased frequency of inactive pulmonary tuber- culosis in the high ECG-score group. Among all predisposing factors, cancer was observed less frequently in the high ECG- score group. There was no difference between the groups in terms of the presence of DVT. Mean systolic and diastolic initial BP were 128 and 76 mmHg in the high ECG score group and 123 and 76 mmHg in the low ECG score group, and there was no difference between the groups in terms of initial blood pressure.

Echocardiographic and hematological findings according to electrocardiography score

Comparisons of echocardiographic and hematological find- ings between the high and low ECG-score groups are shown in Table 4. RV dilation, RV hypokinesia, D-like shape of the LV, and moderate or severe TR were observed more frequent- ly in the high ECG-score group. Mean RVSP was also higher in the high ECG-score group.

However, no significant difference was observed between the two groups in other echocardiographic parameters, in- cluding LVEF, E/A, and E/Ea. Among hematological param- eters, mean hematocrit and NT-proBNP concentration were significantly higher in the high ECG-score group. There were

no significant differences in other hematological parameters between the groups.

Univariate and multivariate analysis of predictors associated with higher right ventricular systolic pressure and right ventricular hypokinesia

An univariate analysis of predictors associated with high RV- Fig. 1. Correlations between right ventricular systolic pressure (RVSP) and the following: R/S ratio in lead I (A), T wave amplitude in lead II (B), T wave amplitude in lead V

4

(C), and ECG score (D). There were inverse correlations between RVSP and the R/S ratio in lead I (A) (r=

-0.308, p=0.019), T wave amplitude in lead II (B) (r=-0.259, p=0.025), and T wave amplitude in lead V

4

(C) (r=-0.227, p=0.050). There was a positive correlation between RVSP and ECG score (D) (r=0.277, p=0.016).

100 80 60 40 20 0

100 80 60 40 20 0

100 80 60 40 20 0

100 80 60 40 20 0

r=-0.259 p=0.025

r=0.277 p=0.016 r=-0.308

p=0.019

r=-0.227 p=0.050 R/S ratio in lead I

T wave amplitude in lead V

4

(mV)

T wave amplitude in lead II (mV)

ECG score

RV SP (m m H g) RV SP (m m H g) RV SP (m m H g) RV SP (m m H g)

0 4 8 12 16

-6 -3 0 3 6 9

-4 -2 0 2 4

0 5 10 15 20

A C B D Fig. 2. Receiver operating characteristics (ROC) curve predicting right ventricular systolic pressure. The area under the curve (AUC) was 0.68 {95% confidence interval (CI)=0.56-0.81} at the point of an ECG score of 12, where sensitivity was 60% and specificity was 77%. 100 80 60 40 20 0 1-specificity (%) Se ns iti vi ty (% ) 0 20 40 60 80 100

ROC curve

ECG score=12 Sensitivity=60%

Sencificity=77%

AUC=0.68

(95% CI=0.56-0.81)

(6)

SP in study patients showed that high ECG score, respirato- ry rate, creatinine level, PaCO

2

, and prothrombin time were significantly associated with high RVSP (Table 5). In addition, a high ECG score {odds ratio (OR) 8.26, 95% CI 2.05-33.33, p=0.003} and creatinine level (OR 10.60, 95% CI 1.06-105.54, p=0.044) were independent markers predicting high RVSP after adjustment by multivariate analysis for potential con- founders that included gender, age, respiratory rate, PaCO

2

, and prothrombin time (Table 5). Moreover, a high ECG score, presence of dyspnea, absence of leg swelling, and sodium and PaCO

2

concentrations were significantly associated with RV hypokinesia in univariate analysis (Table 5). Multivariate analysis of predictors associated with RV hypokinesia revealed that a high ECG score (OR 8.39, 95% CI 1.92-36.60, p=0.005) and the presence of dyspnea (OR 22.73, 95% CI 1.45-333.33, p=0.026) were independent predictors of RV hypokinesia af- ter adjustment for potential confounders that included gen- der, age, absence of leg swelling, and sodium and PaCO

2

con- centrations (Table 6).

Clinical outcomes

Fifteen patients died during admission. Among them, 12 pa- tients died of PE, and the remaining three patients died of brain hemorrhage, pneumonia, and sepsis, respectively. During a mean follow-up period of 14±15 months, six more patients

died. Among them, four patients died of PE, and the remain- ing two patients died of lung cancer and sepsis, respectively.

There was no significant difference between patients with a high ECG score and those with a low ECG score in terms of the in-hospital mortality rate (14% vs. 8%, p=0.550).

Discussion

The results of the present study underscore frequently ob- served ECG findings in acute PE and the effectiveness of the ECG score in risk stratification of acute PE patients.

An acute PE is commonly suspected when dyspnea or chest pain of unknown cause occur in patients with risk factors that include obesity, a history of smoking or use of oral con- traceptives, pregnancy, recent surgery, or cancer, among oth- ers. The role of the ECG as a diagnostic tool when suspect- ing acute PE has been undermined by widespread use of new diagnostic methods, including 2-D echocardiography, pulmonary perfusion-ventilation scan, pulmonary angiog- raphy, and chest CT. Although ECG is considered a conve- nient bedside examination for diagnosing PE irrespective of a patient’s hemodynamic status, its low positive predictive val- ue and sensitivity limit its diagnostic usefulness for acute PE.

5)

Among the findings derived from the 12-lead ECG in the present study, sinus tachycardia and inverted T waves in V

1-4

Table 5. Univariate and multivariate analyses of predictors associated with high right ventricular systolic pressure in patients with acute pul- monary embolism

  Univariate analysis Multivariate analysis

  With high RVSP (n=40) Without high RVSP (n=35) p OR 95% CI p

Male gender 17 (43%) 14 (40%) 0.826 01.26 0.28-5.59 0.766

Age >65 years 21 (53%) 20 (57%) 0.687 00.76 0.19-3.06 0.704

ECG score >12 26 (65%) 08 (23%) <0.001 08.26 2.05-33.33 0.003

Respiratory rate (per minute) 22±60 20±50 0.039 01.17 1.00-1.37 0.057

Creatinine level (mg/dL) 1.09±0.43 0.86±0.30 0.010 10.60 1.06-105.54 0.044

PaCO

2

(mmHg) 29±60 34±11 0.010 00.94 0.85-1.05 0.286

Prothrombin time (second) 13.0±3.10 11.8±1.00 0.030 01.70 0.91-3.21 0.098

Data are expressed as mean±standard deviation or percentage of patients. high RVSP: RVSP >50 mmHg, CI: confidence interval, OR: odds ratio, RVSP: right ventricular systolic pressure

Table 6. Univariate and multivariate analyses of predictors associated with right ventricular hypokinesia in patients with acute pulmonary em- bolism

  Univariate analysis Multivariate analysis

  With RV hypokinesia (n=48) Without RV hypokinesia (n=32) p OR 95% CI p

Male gender 20 (42%) 14 (44%) 0.853 00.92 0.24-3.53 0.908

Age >65 years 23 (48%) 19 (59%) 0.315 00.44 0.12-1.59 0.211

ECG score >12 27 (56%) 8 (25%) 0.006 08.39 1.92-36.60 0.005

Dyspnea 46 (96%) 24 (75%) 0.012 22.73 1.45-333.33 0.026

Leg swelling 4 (8%) 10 (31%) 0.008 00.31 0.05-1.82 0.196

Sodium level (mmol/L) 139.1±3.8 137.0±5.3 0.036 01.12 0.96-1.30 0.162

PaCO

2

(mmHg) ..29±6 0035±11 0.006 00.92 0.82-1.02 0.098

Data are expressed as mean±standard deviation or percentage of patients. CI: confidence interval, OR: odds ratio, RV: right ventricle

(7)

were the most frequently observed patterns; they were fol- lowed in frequency by the S

I

Q

III

T

III

pattern. Although these results appear similar to those of several previous studies, the frequencies of these ECG findings actually differed among the studies. The differences in the frequency of findings may have been caused by disparities in ECG-performance time, st- udy subjects or definition of ECG findings.

2)6-9)

The ECG ch- anges in acute PE described in the present study are probably induced by rapid RV pressure overload; however, it is possi- ble that ischemia of the myocardium, ischemia of the conduc- tion system, hypoxemia, and various chemical mediators such as catecholamine and histamine are also related to these ECG changes.

10)

One study used single-photon emission computed tomography (SPECT) to demonstrate that ECG changes did not correlate with myocardial perfusion defects, and coro- nary artery flow was well preserved in patients with PE.

6)

We could not ascertain the accuracy of correlation between myo- cardial perfusion defects and ECG changes, because we did not perform SPECT analysis. However, the fact that ECG ch- anges did not correlate with myocardial ischemia could be explained by the lack of a relationship between the cTnI level and ECG score in the present study.

Although it has been determined that the S

I

Q

III

T

III

pat- tern, RBBB, and sinus tachycardia are related to PE-associat- ed risk stratification, their sensitivity and positive predictive value were low.

5)

The ECG score was therefore introduced, be- cause it was impossible to assess PE-associated risk stratifi- cation with only single ECG changes. A recent study indicat- ed that, with the cardiac compensation mechanism, the ECG score would be low if the thrombus occluding the pulmo- nary artery was small and that, without the cardiac compen- sation mechanism, the ECG score would be high if the th- rombus was large.

11)

Our study showed a mean ECG score that was higher than the result of the latter study; this suggests that the thrombus occluding the pulmonary artery may have been large in our study.

11)

To the best of our knowledge, the present study is the first to evaluate the relationship between the ECG score and 2-D echocardiography findings in risk stratification of patients with acute PE in Korea. First, there was positive correlation between the ECG score and RVSP. Among numerous ECG patterns, the R/S ratio in lead I and the T wave amplitude in leads II and V

4

were the most important elements in the re- lationship between the ECG score and RVSP. A recent study reported a correlation between T wave amplitude in lead II and RVSP, while another revealed that the number of leads with inverted T waves might be an useful and simple marker for increased risk for early complications in patients with acute PE.

1)2)

Moreover, T wave inversions in leads V

1

to V

3

had the greatest sensitivity and diagnostic accuracy for early detection of RV dysfunction, and normalization of the T wave inversions was associated with recovery of RV dysfunction in

acute PE.

12)

Yoshinaga et al.

7)

suggested that the total number of ECG abnormalities in patients with acute massive PE could be used to evaluate the severity of an acute PE as well as the pulmonary artery pressure level. The present study re- vealed that a high ECG score was an useful marker in pre- dicting high RVSP in multivariate as well as univariate anal- ysis. Furthermore, in the present study, the ECG score was sig- nificantly associated with RV hypokinesia, and a high ECG score was also an useful predictor of RV hypokinesia. Among patients with acute PE, high RVSP has been considered to be an important factor in predicting a poor prognosis.

7)

More- over, hypokinesia and dilatation of the RV have been associ- ated with more extensive pulmonary artery occlusion and have had better predictive values in patients with PE in the short term or acute phase of PE.

13)14)

Therefore, the ECG score can be used as an useful tool in risk stratification of patients with acute PE.

Although NT-proBNP is reportedly worse than ECG find- ings such as T wave inversions in leads V

1

to V

3

for the early detection of RV dysfunction,

12)

NT-proBNP is well known as a prognostic biomarker of outcomes in several cardiovas- cular diseases, and a recent study demonstrated that an ele- vated NT-proBNP concentration could help identify patients with acute PE at high risk for death and other adverse out- comes, including mortality from a cardiovascular incident, hospitalization for heart failure, and myocardial infarction or stroke.

15-18)

In the present study, the NT-proBNP concentra- tion was significantly higher in the high ECG-score group, although the NT-proBNP level was already high in the overall patient population studied. Interestingly, however, there was no significant difference between the groups in terms of sys- tolic and diastolic function, including LVEF, E/A, and E/Ea.

Therefore, the higher NT-proBNP concentration seen in the high ECG-score group was probably not induced by systolic or diastolic dysfunction of the LV. Instead, it was likely in- duced by RV dysfunction caused by acute PE.

Study limitations

The present study has some limitations that should be con-

sidered. First, this study was retrospectively performed at a

single center and included a small number of patients with

acute PE. Therefore, further prospective studies in larger

numbers of patients are required to confirm the predictive

usefulness of the ECG score for risk stratification in patients

with acute PE. Second, the concentrations of cTnI and NT-

proBNP, which were considered as useful predictors of out-

comes in patients with acute PE, could not be measured in all

subjects. Third, we could not identify whether the severity of

acute PE was affected by treatment, because we did not ana-

lyze ECGs recorded after treatment. Finally, it is suggested

that patients with poor general condition and supposed poor

prognosis were omitted because we could not perform 2-D

(8)

echocardiography in all study patients.

Conclusion

Sinus tachycardia, inverted T waves in precordial leads, and a S

I

Q

III

T

III

pattern were commonly observed in patients with acute PE. Moreover, the ECG score is an useful, simple and economical tool in risk stratification of patients with acute PE.

Acknowledgments

The authors are deeply indebted to Roberto Patarca, MD, PhD for his useful suggestions on the preparation of this manuscript.

REFERENCES

1) Kosuge M, Kimura K, Ishikawa T, et al. Prognostic significance of in- verted T waves in patients with acute pulmonary embolism. Circ J 2006;

70:750-5.

2) Yoon NS, Cho JG, Park HW, et al. Usefulness of the 12-lead electro- cardiography in the diagnosis and evaluation of severity of pulmonary thromboembolism. Korean Circ J 2005;35:389-95.

3) Daniel KR, Courtney DM, Kline JA. Assessment of cardiac stress from massive pulmonary embolism with 12-lead ECG. Chest 2001;120:

474-81.

4) McQuillan BM, Picard MH, Leavitt M, Weyman AE. Clinical corre- lates and reference intervals for pulmonary artery systolic pressure among echocardiographically normal subjects. Circulation 2001;

104:2797-802.

5) Konstantinides S, Geibel A, Heusel G, Heinrich F, Kasper W. Hepa- rin plus alteplase compared with heparin alone in patients with sub- massive pulmonary embolism. N Engl J Med 2002;347:1143-50.

6) Stein PD, Alshabkhoun S, Hawkins HF, Hyland JW, Jarrett CE.

Right coronary blood flow in acute pulmonary embolism. Am Heart J 1969;77:356-62.

7) Yoshinaga T, Ikeda S, Shikuwa M, Miyahara Y, Kohno S. Relation- ship between ECG findings and pulmonary artery pressure in patients

with acute massive pulmonary thromboembolism. Circ J 2003;67:

229-32.

8) Tayama E, Ouchida M, Teshima H, et al. Treatment of acute massive/

submassive pulmonary embolism. Circ J 2002;66:479-83.

9) Cutforth RH, Oram S. The electrocardiogram in pulmonary embolism.

Br Heart J 1958;20:41-60.

10) Sreeram N, Cheriex EC, Smeets JL, Gorgels AP, Wellens HJ. Value of the 12-lead electrocardiogram at hospital admission in the diagno- sis of pulmonary embolism. Am J Cardiol 1994;73:298-303.

11) Iles S, Le Heron CJ, Davies G, Turner JG, Beckert LE. ECG score predicts those with the greatest percentage of perfusion defects due to acute pulmonary thromboembolic disease. Chest 2004;125:1651-6.

12) Kim SE, Park DG, Choi HH, et al. The best predictor for right ventric- ular dysfunction in acute pulmonary embolism: comparison between electrocardiography and biomarkers. Korean Circ J 2009;39:378-81.

13) Chung T, Emmett L, Khoury V, et al. Atrial and ventricular echocar- diographic correlates of the extent of pulmonary embolism in the el- derly. J Am Soc Echocardiogr 2006;19:347-53.

14) Toosi MS, Merlino JD, Leeper KV. Prognostic value of the shock in- dex along with transthoracic echocardiography in risk stratification of patients with acute pulmonary embolism. Am J Cardiol 2008;101:

700-5.

15) Grewal J, McKelvie RS, Persson H, et al. Usefulness of N-terminal pro-brain natriuretic peptide and brain natriuretic peptide to predict cardiovascular outcomes in patients with heart failure and preserved left ventricular ejection fraction. Am J Cardiol 2008;102:733-7.

16) Bibbins-Domingo K, Gupta R, Na B, Wu AH, Schiller NB, Whooley MA. N-terminal fragment of the prohormone brain-type natriuretic peptide (NT-proBNP), cardiovascular events, and mortality in patients with stable coronary heart disease. JAMA 2007;297:169-76.

17) Coutance G, Le Page O, Lo T, Hamon M. Prognostic value of brain natriuretic peptide in acute pulmonary embolism. Crit Care 2008;12:

R109.

18) ten Wolde M, Tulevski II, Mulder JW, et al. Brain natriuretic peptide

as a predictor of adverse outcome in patients with pulmonary embo-

lism. Circulation 2003;107:2082-4.

수치

Fig. 2 shows the ROC curve predicting RVSP. The area un- un-der the curve was 0.68 {95% confidence interval (CI)  0.56-0.81} at the point corresponding to an ECG score of 12, where  sensitivity was 60% and specificity was 77%
Table 6. Univariate and multivariate analyses of predictors associated with right ventricular hypokinesia in patients with acute pulmonary em- em-bolism

참조

관련 문서