Low HDL cholesterol is associated with increased atherogenic lipoproteins and insulin resistance in women classified with metabolic syndrome
Maria Luz Fernandez 1§ , Jennifer J Jones 1 , Daniela Ackerman 1 , Jacqueline Barona 1 , Mariana Calle 1 ,
Michael V Comperatore 1 , Jung-Eun Kim 1 , Catherine Andersen 1 , Jose O Leite 1 , Jeff S Volek 1 , Mark McIntosh 2 , Colleen Kalynych 2 , Wadie Najm 3 and Robert H Lerman 4
1
Department of Nutritional Sciences, University of Connecticut, 3624 Horsebarn Road Ext, Storrs, CT 06269, USA
2
Department of Emergency Medicine, University of Florida, Jacksonville FL, USA
3
Department of Family Medicine, University of California, Irvine, CA, USA
4
MetaProteomics LLC, Gig Harbor, WA, USA
Abstract
Both metabolic syndrome (MetS) and elevated LDL cholesterol (LDL-C) increase the risk for cardiovascular disease (CVD). We hypothesized that low HDL cholesterol (HDL-C) would further increase CVD risk in women having both conditions. To assess this, we recruited 89 women with MetS (25-72 y) and LDL-C ≥ 2.6 mmol/L. To determine whether plasma HDL-C concentrations were associated with dietary components, circulating atherogenic particles, and other risk factors for CVD, we divided the subjects into two groups: high HDL-C (H-HDL) (≥ 1.3 mmol/L, n = 32) and low HDL-C (L-HDL) (< 1.3 mmol/L, n = 57). Plasma lipids, insulin, adiponectin, apolipoproteins, oxidized LDL, Lipoprotein(a), and lipoprotein size and subfractions were measured, and 3-d dietary records were used to assess macronutrient intake. Women with L-HDL had higher sugar intake and glycemic load (P < 0.05), higher plasma insulin (P < 0.01), lower adiponectin (P < 0.05), and higher numbers of atherogenic lipoproteins such as large VLDL (P < 0.01) and small LDL (P < 0.001) than the H-HDL group. Women with L-HDL also had larger VLDL and both smaller LDL and HDL particle diameters (P < 0.001). HDL-C was positively correlated with LDL size (r = 0.691, P < 0.0001) and HDL size (r = 0.606, P < 0.001), and inversely correlated with VLDL size (r = -0.327, P < 0.01). We concluded that L-HDL could be used as a marker for increased numbers of circulating atherogenic lipoproteins as well as increased insulin resistance in women who are already at risk for CVD.
Key Words: Metabolic syndrome, heart disease risk, low HDL cholesterol, atherogenic lipoproteins, insulin resistance
Introduction 7)
The metabolic syndrome (MetS) is a constellation of metabolic abnormalities characterized by abdominal obesity, hyperglycemia, high blood pressure, and dyslipidemias including elevated apolipoprotein B (apo-B), high plasma triglycerides (TG), increased numbers of small, dense LDL particles, and low HDL-cholesterol (HDL-C) concentrations [1]. The cluster of these characteristics poses individuals at higher risk for both cardiovascular disease (CVD) and type 2 diabetes [2].
The inverse association between low plasma concentrations of HDL-C and atherosclerosis has been clearly established [3]. The protective effects of HDL against CVD risk are not limited to the role of this lipoprotein in reverse cholesterol transport [4].
HDL has a number of pleiotropic functions, including the transport of paraoxonase 1, an important anti-oxidant in plasma [5], as well as the promotion of cholesterol removal from macrophages [6], regulation of endothelial adhesion molecule
expression [7], anti-inflammatory effects [8], and nitric oxide promoting action [9]. What is clear from previous studies [4-9]
is that elevated concentrations of HDL-C are protective against CVD and atherosclerosis through many different mechanisms.
This protective role of HDL may also be extended to subjects who present other risk factors for heart disease.
Dietary carbohydrate has been shown to modulate the risk factors associated with MetS [10]. For example, carbohydrate- restricted diets decrease plasma TG [11], elevate HDL-C [12], and reduce the number of circulating small LDL [13]. Since fat accumulation in the trunk area has been shown to be associated with increased free fatty acid release, insulin resistance, and disruption of glucose metabolism [10], reductions of fat in this area are quite beneficial to reduce the risk of CVD and type 2 diabetes [2]. The primary aim of the present study was to investigate whether low concentrations of HDL-C would result in increased numbers of atherogenic lipoproteins and insulin resistance in women already at risk for CVD. Based on this,
§
Corresponding Author: Maria Luz Fernandez, Tel. 1-860-486-5547, Fax. 1-860-486-3674, Email. [email protected] Received: July 9, 2010, Revised: September 16, 2010, Accepted: October 18, 2010
ⓒ2010 The Korean Nutrition Society and the Korean Society of Community Nutrition
This is an Open Access article distributed under the terms of the Creative Commons Attribution Non-Commercial License (http://creativecommons.org/licenses/by-nc/3.0/)
which permits unrestricted non-commercial use, distribution, and reproduction in any medium, provided the original work is properly cited.
we evaluated several risk parameters for CVD and atherosclerosis in women having high (H-HDL) (> 1.3 mmol/L) versus low (L-HDL) (< 1.3 mmol/L) plasma HDL-C concentrations. These subjects had high LDL-C (> 2.6 mmol/L) and were also classified as having MetS, two conditions that increase CVD risk. A secondary objective was to determine whether dietary components were related to low concentrations of HDL-C.
Subjects and Methods
Study design
The subjects for this study were recruited from 3 different locations: the University of Connecticut (Storrs, CT) (n = 29), University of Florida (Jacksonville, FL) (n = 47), and University of California (Irvine, CA) (n = 13). The inclusion criteria were women with MetS, having at least 2 of the following characteristics: blood pressure ≥ 130/85 mm Hg or treated hypertension, waist circumference (WC) > 88 cm, fasting glucose
≥ 5.6 mmol/L, and HDL-C < 1.3 mmol/L, in addition to high TG (≥ 1.7 mmol/L) and LDL-C ≥ 2.6 mmol/L.
The subjects were recruited by word of mouth, distribution e-mails, newspaper and radio advertisements, and flyers. The exclusion criteria were low LDL-C (< 2.6 mmol/L), TG < 1.7 mmol/L, age less than 25 or older than 75 y, pregnancy, lactation, thyroid problems, stroke, heart disease, or use of medication or supplements relevant to diabetes or CVD such as hypoglycemic or cholesterol lowering agents. A total of 89 women were recruited for the study. All protocols were approved by the Institutional Review Boards of the respective universities.
Anthropometrics and blood pressure
After obtaining a consent agreement from each participant, weight and height were measured and body mass index (BMI) was calculated (kg/m
2). WC was calculated by measuring at the superior border of the iliac crest using a flexible tape. Blood pressure (systolic and phase-V diastolic) was measured on the left arm with the subjects seated, after at least 5 minutes rest, using an automated blood pressure monitor (Omron, Healthcare Inc., Bannockburn, IL). Three separate recordings were made and the mean was used.
Diet analysis
The subjects completed a 3-d diet record including one week-end day to assess energy, carbohydrate, fat, protein, dietary fiber, and cholesterol intake as well as glycemic load, which was automatically calculated. The dietary records were analyzed using The Nutrition Data System 9.0 (Minneapolis, MN).
Laboratory measurements
After a 12-h overnight fast, 60 ml of fasting blood was collected from all participants. Plasma was separated from red blood cells by centrifugation at 2000 × g, aliquoted, and then frozen at -80℃ for further analysis. Plasma lipids, glucose, insulin, apo B, and apo A-I were measured in a certified laboratory (Northwest Lipid Research Laboratories, Seattle, WA).
Plasma glucose and lipids were assayed using a Vitros 950IRC analyzer (Ortho-Clinical Diagnostics, Rochester, NY). LDL-C was determined indirectly using the Friedewald equation [14].
Apo A-I and B were analyzed by turbidimetry using an Advia 1650
®(Bayer Diagnostics, Tarrytown, NY). Insulin was determined by a chemiluminescent, immunometric assay using a DPC Immulite 2000 (Diagnostics Products Corporation, Nutley, NJ). The homeostasis model assessment (HOMA) [15] was calculated as a measure of insulin resistance.
Lipoprotein subfractions and size
H-NMR analysis was performed (LipoScience, Inc., Raleigh, NC) using a 400 MHz NMR analyzer (Bruker BioSpin Corp, Billerica, MA) as previously described [13]. NMR simultaneously quantifies > 30 lipoprotein subclasses that are empirically grouped into 9 smaller subclasses based on the following particle diameters: large VLDL (35-60 nm), medium VLDL (27-35 nm), small VLDL (23-27 nm), large LDL (21.2-23 nm), medium LDL (19.8-21.2 nm), small LDL (18-19.8 nm), large HDL (8.8-13 nm), medium HDL (8.2-8.8 nm), and small HDL (7.3-8.2 nm).
Weighted-average lipoprotein particle sizes in diameter were calculated based on the diameter of each lipoprotein subclass multiplied by its respective relative concentration.
Apolipoproteins A-II, C-II, C-III, and E
Apolipoproteins were measured using LINCOplex: Multiplex Biomarker Immunoassay for Luminex Instrumentation/xMAP Technology (Austin, TX). This technique uses fluorescently labeled microsphere beads with antibodies specific to each individual apolipoprotein [16]. The technique is well standardized in our laboratory [11].
LDL oxidation and Lipoprotein(a)
LDL oxidation was measured by ELISA kits (ALPCO, Salem,
NH) using the monoclonal antibody 4E6, which has been utilized
in numerous clinical trials [17]. The standards and samples were
read at 450 nm in a spectrophotometer (Spectramax Multimode
Spectrophotometer, Sunnyvale, CA). Using a polynomial curve,
concentrations of oxidized LDL were calculated and expressed
as mmol/L. Plasma Lp(a) was determined in duplicate using a
sandwich ELISA (Diagnostic Automation, Inc., Calabasas, CA)
with a dynamic range of 0.04-5.89 µmol/L. Absorbance was
Fig. 1. Percent of subjects with waist circumference (WC) > 88 cm, blood pressure > 130/85 mm Hg; plasma glucose > 100 mg/dL (5.6 mmol/L); plasma triglycerides (TG) > 150 mg/dL (1.7 mmol/L) and HDL < 50 mg/dL (1.3 mmol/L) in women classified with metabolic syndrome (MetS) (n = 89)
Parameter High HDL-C (n = 32) Low HDL-C (n = 57)
Age (yr) 47.6 ± 9.8 46.6 ± 10.7
Weight (kg) 93.0 ± 17.0 90.3 ± 13.1
BMI (kg/m2) 34.2 ± 5.7 34.0 ± 5.0
WC (cm) 110.7 ± 11.9 107.6 ± 10.5
Systolic (mm Hg) 127.8 ± 13.3 126.8 ± 15.9
Diastolic (mm Hg) 81.0 ± 7.7 78.8 ± 8.9
TC (mmol/L) 5.96 ± 0.80 5.66 ± 0.85
LDL-C (mmol/L) 3.50 ± 0.85 3.56 ± 0.72
HDL-C (mmol/L) 1.48 ± 0.16 1.03 ± 0.16**
TG (mmol/L) 2.17 ± 0.38 2.37 ± 0.67
Glucose (mmol/l) 4.86 ± 0.70 4.97 ± 0.80
Insulin (µU/mL) 13.2 ± 6.2 18.8 ± 9.9*
Insulin resistance (HOMA) 3.2 ± 1.6 4.5 ± 2.8*
Adiponectin (mg/L) 16.4 ± 6.8 13.8 ± 7.4*
ICAM (mg/L) 0.094 ± 0.027 0.17 ± 0.049*
Apo B (mg/L) 1,115.3 ± 210.8 1,216.0 ± 217.4
Apo A-I (mg/L) 1711 ± 250 1415 ± 161**
Apo A-II (mg/L) 225.5 ± 83.8 168.5 ± 51.7**
Apo C-II (mg/L) 100.9 ± 34.1 87.0 ± 38.7*
Apo C-III (mg/L) 284.6 ± 99.3 252.9 ± 119.5*
Apo E (mg/L) 75.9 ± 37.2 71.5 ± 28.3
1)
Values are mean ± SD for the number of subjects indicated in parentheses.
* Significantly different at P < 0.05, ** Significantly different at P < 0.001 as determined by Mann-Whitney U non-parametric test
Table 1. Anthropometrics, blood pressure, plasma lipids, glucose, insulin and apolipoproteins (apo) of women classified with MetS having low (< 1.3 mmol/L) or high (≥ 1.3 mmol/L) HDL-C
1)Parameter High HDL-C (n = 32) Low HDL-C (n = 57) Total energy (Kjoules/d) 8,622 ± 3,349 8,921 ± 3,374
Total fat (g/d) 101.8 ± 55.0 92.6 ± 46.9
Total fat (% energy) 38.5 ± 7.4 36.5 ± 7.7
Saturated fat (% energy) 13.5 ± 3.5 12.0 ± 3.2*
Monounsaturated fat (% energy)
14.8 ± 4.5 13.6 ± 3.1
Polyunsaturated fat (% energy)
9.5 ± 8.3 7.9 ± 3.2
Trans fatty acids (g/d) 4.4 ± 2.9 5.4 ± 3.5
Omega-3 fatty acids (g/d) 1.9 ± 1.2 1.9 ± 1.1 Total carbohydrate (g/d) 211.5 ± 101.3 234.2 ± 86.4 Carbohydrate (% energy) 42.2 ± 8.1 44.7 ± 10.0
Total sugars(g/d) 76.4 ± 48.9 103.1 ± 58.9*
Added sugars (g/d) 48.5 ± 42.0 76.4 ± 56.2*
Glycemic Load 116.4 ± 60.4 133.3 ± 53.2*
Total protein (g/d) 79.7 ± 41.7 86.1 ± 29.6
Protein (% energy) 15.9 ± 4.0 17.0 ± 4.4
Dietary cholesterol (mg/d) 321.2 ± 168.9 331.0 ± 173.
Alcohol (% energy) 3.2 ± 5.2 2.4 ± 5.8*
Total fiber (g/d) 18.3 ± 10.8 16.4 ± 8.1
Soluble fiber (g/d) 5.6 ± 3.1 5.3 ± 2.5
Insoluble fiber (g/d) 12.5 ± 8.3 10.9 ± 6.4
1)
Values are mean ± SD.
* Indicates significantly different ( P < 0.05) as determined by Mann-Whitney non- parametric test
Table 2. Total Energy, fat, carbohydrate, protein, dietary cholesterol and dietary fiber intake obtained from a 3-d dietary record of women classified with MetS having low (< 1.3 mmol/L) or high (≥ 1.3 mmol/L) HDL-C
1)determined using the same spectrophotometer as previously reported [18].
Adiponectin and intercellular adhesion molecule-1 (sICAM-1) From fasting plasma, ICAM-1 and adiponectin were measured in duplicate in the same assay using Human CVD Panel 1 LINCOplex kits. Samples were diluted 1:100 and simultaneously quantified by using Antibody-Immobilized Beads and Luminex xMAP technology. All assays were carried out on the same day to decrease variability. The coefficient variation was 2-6%. The sensitivities for sICAM-1 and adiponectin were 9.0 pg/ml and 56.0 pg/ml, respectively, as previously reported [19].
Statistical analysis
Data are presented as mean ± SD for the measured parameters.
Since we had different numbers of subjects in the low and high HDL-C groups, the non-parametric Mann-Whitney U test was performed to assess differences in plasma lipids, apolipoproteins, diet, inflammatory markers, and lipoprotein size and subfractions.
P < 0.05 was considered significant. Pearson correlations were conducted between HDL-C and the different lipoprotein sizes.
Results
All 89 women recruited for the study were classified as having MetS. All women (100%) had high TG (≥ 1.7 mmol/L), as this was one of the inclusion criteria, and 99% had WC > 88 cm.
Fasting blood glucose > 5.6 mmol/L, high blood pressure (≥
130/85 mm Hg), and low HDL-C (< 1.3 mmol/L) accounted for 39, 47, and 64% of the subjects, respectively (Fig. 1).
We divided the women into two groups according to the
following concentrations of plasma HDL-C: H-HDL ≥ 1.3
mmol/L and L-HDL < 1.3 mmol/L, to evaluate whether lower
HDL-C would be associated with higher risk for atherosclerosis.
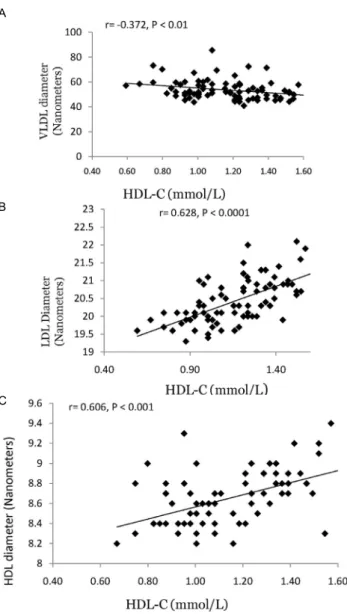
A
B
C
Fig. 2. Correlations between HDL-C and VLDL size (panel A) HDL size (panel B) and LDL size (panel C)
Parameter High HDL-C (n = 32) Low HDL-C (n = 57)
VLDL diameter (nm) 51.1 ± 7.0 54.7 ± 8.1*
Total VLDL (mmol/L) 97 ± 33 104 ± 39
Large VLDL (mmol/L) 4.8 ± 3.1 8.4 ± 7.8*
Medium VLDL (mmol/L) 35.9 ± 17.5 41.6 ± 24.6
Small VLDL (mmol/L) 56.5 ± 18.6 53.6 ± 20.7
IDL (mmol/L) 65.4 ± 53.1 87.1 ± 49.7*
LDL diameter (nm) 21.0 ± 0.6 20.2 ± 0.6*
Total LDL (mmol/L) 1490 ± 366 1734 ± 345*
Large LDL (mmol/L) 513 ± 158 288 ± 169*
Small LDL (mmol/L) 932 ± 388 1,359 ± 384*
HDL diameter (nm) 8.9 ± 0.3 8.6 ± 0.2*
Total HDL (mmol/L) 39.5 ± 6.2 33.6 ± 4.9*
Large HDL (mmol/L) 8.3 ± 3.5 4.2 ± 2.4*
Medium HDL (mmol/L) 6.9 ± 5.6 6.3 ± 4.6
Small HDL (mmol/L) 24.3 ± 6.9 23.1 ± 5.3
Oxidized LDL (µg/L) 112.1 ± 94.8 118.6 ± 98.7
Lp(a) (µmol/L) 0.92 ± 0.81 0.69 ± 0.72
1)