Risk factors of type 2 diabetes among Korean adults: The 2001 Korean national health and nutrition examination survey
Hae-Rang Chung 1,2§ and Rafael Pérez-Escamilla 3
1
Visiting scholar, Department of Nutritional Sciences. Connecticut NIH EXPORT Center for Eliminating Health Disparities among Latinos. University of Connecticut. Storrs, CT 06269-4017, USA
2
Present post; President, Nutrition for the Future, Inc. B-1504 Daewoo The’O superium, Nakseongdae- dong, Kwanak-gu, Seoul 151-848, Korea
3
Professor, Department of Nutritional Sciences. Director, Connecticut NIH EXPORT Center for Eliminating Health Disparities among Latinos. University of Connecticut. Storrs, CT 06269-4017, USA
Abstract
This study aimed to identify risk factors for type 2 diabetes (T2D) in Korea, a rapidly changing country. Data of 5,132 adults aged 20-85 were used from the 2001 Korean Health and Nutrition Examination Survey. Multiple logistic regression was carried out to identify risk factors for T2D.
Three models were specified: (i) socioeconomic and demographic factors (model 1: age, gender, education, poverty income ratio, employment), (ii) behavioral risk factors and covariates (model 2: obesity, physical activity, smoking, alcohol drinking, dietary quality, family history of T2D, co-morbidity) and (iii) socioeconomic, demographic, and behavioral factors (model 3). The prevalence of T2D was 7.4%. Less education (OR 1.41, 95% CI 1.08-1.84), age (OR 2.19, 95% CI 1.56-3.08 in 40-59 yrs, OR 4.05, 95% CI 2.76-5.95 in 60 yrs + comparing to 20-39 yrs) and abdominal obesity (OR 2.24, 95% CI 1.79-2.82) were risk factors for T2D even after controlling for other factors simultaneously. There was a significant association of T2D with ever smoking (OR 1.34, 95% CI 1.06-1.67). The relationship of age with T2D was modified by gender in model 1 and the relationship of smoking with T2D was modified by obesity in model 2. Less educated, older, obese or ever smokers were more likely to have T2D. Gender mediated the relationship of age, and obesity mediated the relationship of smoking, with T2D. Intervention programs for T2D in Korea should take the interactions among risk factors into account.
Key Words: Type 2 diabetes, risk factor, Korean adult, Korea health and nutrition examination survey 2001
Introduction 5)
South Korea, which was considered to be one of the poorest countries in the 1950s, became the world’s 10th largest economy in 2005 (International Monetary Fund, 2007). Along with a surge in economic growth, individual lifestyle behavior and socio- environmental conditions surrounding individuals have changed rapidly (Kim et al., 2004). These trends may have accelerated the incidence of chronic diseases.
Diabetes has become a major health threat to Koreans. The mortality rate due to diabetes dramatically increased from 4.3 in 1983 to 24.3 per 100,000 persons in 2004. Currently diabetes is Korea’s fifth leading cause of death (National Statistical Office, 2006). In addition, twenty four percent of the population is at risk of diabetes (Kim et al., 2006). The disease is closely related to the risk of cerebrovascular disease and coronary heart disease, the second and third causes of death in Korea respectively (Ko et al., 2006). Obesity and metabolic syndrome are significantly
associated with type 2 diabetes (T2D) in Korea.
Several factors contribute to this chronic disease epidemic including socioeconomic and demographic status, as well as lifestyle behaviors. These factors are typically correlated with each other. Moreover, these relationships have been demonstrated to behave differently among ethnic groups or even within the same ethnic groups, when the living environment differs (Centers for Disease Control and Prevention, 2004; McNeely & Byoko, 2004; Singh & Hiatt, 2006).
Several studies have examined risk factors to T2D in Korea (Cho et al., 2006; Kim et al., 2006; Sung et al., 2001). However, none considered statistical interactions among risk factors. The objectives of the study were to determine the relationships of T2D with socioeconomic and demographic factors, and potential lifestyle behavioral risk factors, while taking interactions among risk factors into account.
§
Corresponding Author: Hae-Rang Chung, Tel. 82-2-563-8663, Fax. 82-2-563-8664, Email. [email protected] Received: April 5, 2009, Revised: December 10, 2009, Accepted: December 12, 2009
ⓒ2009 The Korean Nutrition Society and the Korean Society of Community Nutrition
This is an Open Access article distributed under the terms of the Creative Commons Attribution Non-Commercial License (http://creativecommons.org/licenses/by-nc/3.0/)
which permits unrestricted non-commercial use, distribution, and reproduction in any medium, provided the original work is properly cited.
Subjects and Methods
Subjects
The analysis was conducted with the 2001 Korean National Health and Nutrition Survey data. The cross-sectional and nationally representative survey consisted of four components:
a Health Interview Survey, a Health Behavior Survey, a Health Examination Survey, and a Nutrition Survey. The subjects of the surveys were selected from the non-institutionalized civilian population following a multistage probability stratified sampling design based on the 2000 Korean National Census Registry. The number of individuals from these sampling frames included in the Health Interview Survey was 37,769. Out of the Health Interview Survey participants, a third was selected for the Health Examination, Health Behavior and Nutrition Surveys. A more detailed description of the sampling design has been published elsewhere (Ryu et al., 2001). The surveys were conducted on November, 2001 in the respondents’ homes by the field staff, and the Health Examination was done in local health centers.
For this study, adults aged 20 to 85 were selected, each of whom completed the Health Interview, the Health Examination and the Nutrition Survey. Pregnant women were excluded (n=52).
The final sample size was 5,132. An individual was considered to have T2D if he/she was taking a pill for diabetes or if they had plasma glucose levels of ≥126 mg/dl following at least 8 hours of fasting (World Health Organization, 1999). With this definition, type 1 diabetes cannot be excluded. However, in Korea as in the rest of the world, the overwhelming proportion of cases identified through this definition would have T2D.
Risk factors
Potential socioeconomic, demographic, and behavioral risk factors for T2D were studied. Age, gender, education, employment and poverty income ratio (PIR) were examined as socioeconomic and demographic factors. Cigarette smoking, alcohol drinking, physical activity, dietary quality and obesity were included as behavioral risk factors. Family history of diabetes and co-morbidity were added to the analysis as covariates.
Socioeconomic status (SES) was examined through the educa- tion, employment and PIR variables. Education was classified as low for subjects who did not complete high school, and high for those who had a high school diploma or more. Persons reported as currently not having a job or as a housewife were classified as unemployed. The PIR was the ratio of the family income to the poverty threshold, which is based on the minimum standard cost of living set by the Ministry of Health and Welfare based on and adjusted by family size (Ministry of Health and Welfare, 2006). The ratio less than 1.2 was defined as being below the poverty threshold, and the ratio of 1.2 or above as being above the poverty threshold.
Self-reported cigarette smoking, alcohol drinking and physical
activity were included as lifestyle indicators. To determine smoking status, we used two questions: “Have you smoked at least 100 cigarettes in your entire life?” and “Do you smoke cigarettes now?” Ever smoking was defined by a positive answer to the first question, and current smoking was defined by a positive answer to both questions. Those who consumed alcoholic drinks
“sometimes” or “often” were classified as drinkers. Physical activity adequacy was defined as doing vigorous exercise that causes sweating or deep breathing, at least three times for 30 minutes or four times for 20 minutes per week.
Abdominal and overall adiposity were measured by waist circumference (WC) and body mass index (BMI) respectively.
We used the WC cutoff points of ≥90 cm for men and ≥85 cm for women, as recommended by the Korean Obesity Society (Korean Society for the Study of Obesity, 2005). BMI was classified into underweight (<18.5), normal (18.5-24.9), and overweight (25.0-29.9), and obese (≥30.0) categories (World Health Organization, 2000).
Dietary quality was examined using the Mean Adequacy Ratio (MAR) based on a single 24-hr recall per participant. The overall MAR was the sum of the Nutrient Adequacy Ratio (NAR) for each of nine nutrients (protein, vitamin A, vitamin B1, vitamin B2, niacin, vitamin C, calcium, phosphorus, and iron). The NAR was the nutrient intake calculated as a percentage of the Recommended Dietary Allowance (RDA). Each NAR greater than 1 was considered as 1 to avoid high consumption levels of some nutrients compensating for low levels of others in the resulting MAR (Kant, 1996). Subjects below the median of the MAR distribution were regarded as low, and those above the median were regarded as high.
A family history of diabetes was defined as having blood relatives, alive or deceased, with T2D. Persons reported being told by a doctor or other health professional that he/she had congestive health failure, coronary heart disease, angina pectoris, heart attack, or cancer were classified as having a co-morbid condition.
Statistical analysis and statistical model building procedure All statistical procedures were performed using SPSS for Windows, version 13. Bivariate associations between socioeco- nomic, demographic and behavioral variables studied were examined by Spearman rho correlations. Individual associations of the independent variables with T2D were examined with the Chi-square test of independence. Survey weights were taken into account to calculate prevalence and standard errors.
Multiple logistic regression analyses were carried out to
estimate the factors which influence the prevalence of T2D with
two categories of independent variables: (i) socioeconomic and
demographic factors, and (ii) behavioral risk factors. In model
1, socioeconomic and demographic variables were examined
together for their associations with T2D as the dependent
variable. In a separate model, behavior risk factors and covariates
Table 1. Participant Characteristics by Diabetes Status
% population
bn
aNon-Diabetic
% Diabetic
% p
cTotal 5,132 92.6 7.4
Age
20-39 2,152 41.9 15.2 < 0.001
40-59 1,932 39.0 38.9
60+ 1,048 19.0 45.9
Gender
Male 2,195 40.9 42.3 0.631
Female 2,937 59.1 57.7
Education
High school or more 3,255 65.3 37.7 < 0.001 Less than high school 1,877 34.7 62.3
PIR
Below 1,102 20.1 31.1 < 0.001
Above 4,030 79.9 68.9
Employment
Employed 3,078 58.3 45.8 < 0.001
Unemployed 2,054 41.7 54.2
Current Smoking
No 3,685 73.4 71.6 0.508
Yes 1,447 26.6 28.4
Ever Smoking
No 3,217 64.4 59.0 0.064
Yes 1,915 35.6 41.0
Alcoholic Drinking
No 2,858 57.2 60.6 0.271
Yes 2,274 42.8 39.4
Physical Activity
Inactive 4,540 88.0 84.3 0.09
Active 592 12.0 15.7
WC
Normal 3,912 77.2 52.0 < 0.001
Obese 1,220 22.8 48.0
BMI
< 18.5 235 4.8 1.9 < 0.001
18.5 ≤ BMI < 25.0 3,353 66.5 49.7
25.0 ≤ BMI < 30.0 1,395 25.9 41.0
≥ 30.0 149 2.7 7.4
MAR
High 2,571 50.4 40.7 0.001
Low 2,561 49.6 59.3
Family History
No 4,572 89.3 85.6 < 0.001
Yes 560 10.7 14.4
Co-Morbidity
No 4,555 89.6 68.5 < 0.001
Yes 577 10.4 31.5
abbreviations: PIR, poverty income ratio; WC, waist circumference; MAR, mean adequacy ratio
a
unadjusted sample size
b
percentages were adjusted for the sample design.
c
Refers to χ
2test
were assessed (model 2). All variables in model 1 and model 2 were examined together in model 3. Because of a strong correlation between WC and BMI, we examined their relationship with T2D in separate models. WC appeared to have a greater influence on the model efficiency, thus the models presented are based on WC. We also examined the relationship of smoking with T2D in two separate models, one with current smoking and other with ever smoking. Ever smoking was included in the final models because of its greater influence on the model efficiency.
We performed multivariate logistic regressions with backward elimination procedure using SPSS for Windows. All variables having p < 0.15 on the bivariate analyses were included in the model. We chose the p level of 0.15 to avoid excluding relevant variables from the model. Gender and alcohol drinking were included in the model despite having a weak significance (p=0.631, p=0.271, respectively) with T2D. Once the main effects in each model were identified, interactions among the variables in the model were examined (Hosmer & Lemeshow, 2000). The interaction variables were added, one at a time, to the model containing all the main effects and kept in the model if they had a p value ≤ 0.05. Once all significant interaction terms were included, main effects having p ≥ 0.05 were removed if they were not included in interaction terms. Odds ratios and the corresponding 95% Confidence Interval (CI) were obtained for each variable that was used in the logistic regression model. The Hosmer-Lemeshow goodness of fit index was used to assess model fit (Hosmer & Lemeshow, 2000).
Results
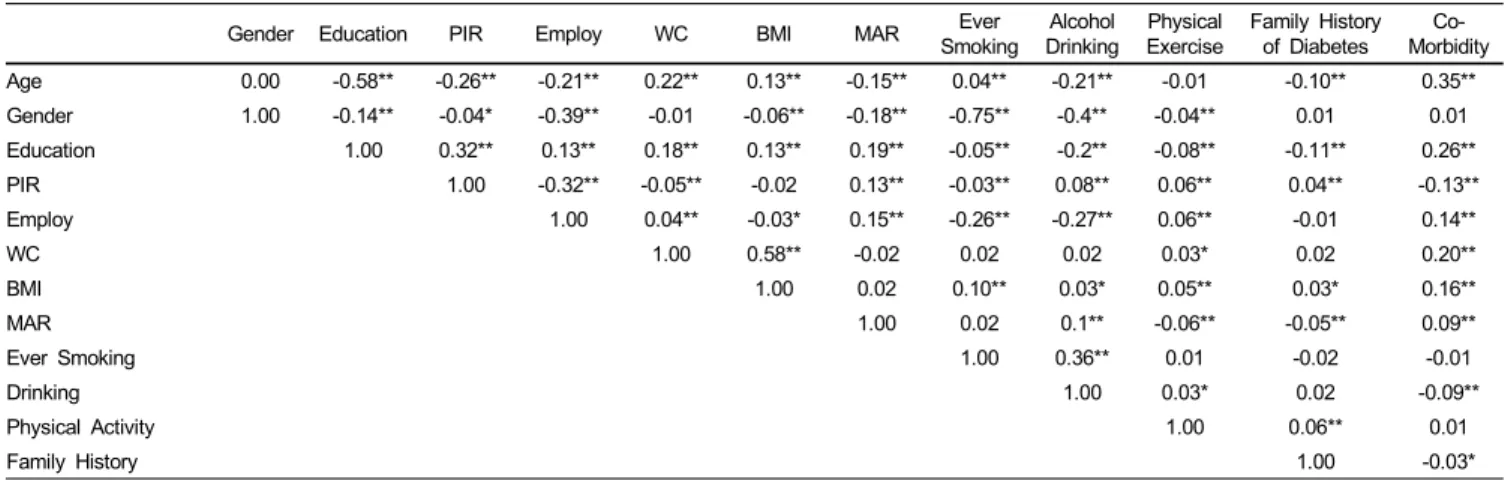
The prevalence of T2D in this population was 7.4% (Table 1). Individuals with T2D were significantly older, less educated, poorer and unemployed. WC and BMI were significantly higher in persons with T2D. Persons with T2D had lower dietary quality and were less physically active. There was no significant difference in T2D prevalence by gender, smoking, or alcohol drinking status. Correlations between all of the examined independent variables were shown in Table 2.
Multivariate logistic regression results were presented in Table 3. The results from model 1, that only included socioeconomic and demographic variables, indicated that being less educated (OR 1.45 (95% CI = 1.11-1.90)) older (OR 3.12 (95% CI=
1.95-5.00) among 40-59 years old, OR 4.67 (95% CI =2.80- 7.78) among 60 years old and over, respectively) were more likely to have T2D. However, gender modified the relationship of T2D with age. While the risk among men increased gradually with age, it showed a sharp increase in the group of women aged 60 and over. This interaction became insignificant after controlling for behavioral risk factors. The PIR and employment status had no relationship with T2D in this model.
In model 2, which included behavioral risk factors, persons with high WC were about 3.4 times (95% CI=2.57, 4.62) more
likely to have T2D after adjusting for MAR, co-morbidities and
family history of diabetes. Low dietary quality increased the
likelihood of T2D by 1.3 times (95% CI=1.05, 1.63). Persons
Table 2. Correlations among Socioeconomic, Demographic and Behavioral Risk Factors
Gender Education PIR Employ WC BMI MAR Ever
Smoking Alcohol
Drinking Physical
Exercise Family History of Diabetes Co-
Morbidity Age 0.00 -0.58** -0.26** -0.21** 0.22** 0.13** -0.15** 0.04** -0.21** -0.01 -0.10** 0.35**
Gender 1.00 -0.14** -0.04* -0.39** -0.01 -0.06** -0.18** -0.75** -0.4** -0.04** 0.01 0.01
Education 1.00 0.32** 0.13** 0.18** 0.13** 0.19** -0.05** -0.2** -0.08** -0.11** 0.26**
PIR 1.00 -0.32** -0.05** -0.02 0.13** -0.03** 0.08** 0.06** 0.04** -0.13**
Employ 1.00 0.04** -0.03* 0.15** -0.26** -0.27** 0.06** -0.01 0.14**
WC 1.00 0.58** -0.02 0.02 0.02 0.03* 0.02 0.20**
BMI 1.00 0.02 0.10** 0.03* 0.05** 0.03* 0.16**
MAR 1.00 0.02 0.1** -0.06** -0.05** 0.09**
Ever Smoking 1.00 0.36** 0.01 -0.02 -0.01
Drinking 1.00 0.03* 0.02 -0.09**
Physical Activity 1.00 0.06** 0.01
Family History 1.00 -0.03*
* indicates statistical significance at P =0.05 level, unadjusted
** indicates statistical significance at P =0.01 level, unadjustedvariables are defined as age (1 20-39 years, 2 40-59 years, 3 60 years and over), gender (1 male, 2 female), education (1 less than high school, 2 high school or more), employment (1 unemployed, 2 employed), Poverty Income Ratio (1 below, 2 above), Waist Circumference (1 normal, 2 obese), BMI (1 < 18.5, 2 18.5 ≤ BMI < 25.0, 3 25.0 ≤ BMI < 30, 4 ≥ 30.0), Mean Adequacy Ratio (1 below, 2 high), current smoking (1 no, 2 yes), ever smoking (1 no, 2 yes), alcohol drinking (1 no, 2 yes), physical activity (1 inactive, 2 active), family history of diabetes (1 no, 2 yes), comorbidity (1 no, 2 yes)
Table 3. Multivariate Logistic Regression Determinants of T2D Status
Predictor Variables Odds Ratio (95% Confidence Interval)
Model 1 Model 2 Model 3
Age 20-39 yrs 1.00 1.00
40-59 yrs 3.12 (1.95, 5.00) 2.19 (1.56, 3.08)
60 yrs + 4.67 (2.80, 7.78) 4.05 (2.76, 5.95)
Education high school or more 1.00 1.00
less than high school 1.45 (1.11, 1.90) 1.41 (1.08, 1.84)
Gender male 1.00
female 0.89 (0.52, 1.52)
WC normal 1.00 1.00
high 3.44 (2.57, 4.62) 2.24 (1.79, 2.82)
MAR low 1.00
high 1.31 (1.05, 1.63)
Ever Smoking no 1.00 1.00
yes 1.69 (1.26, 2.26) 1.34 (1.06, 1.67)
Family History of Diabetes no 1.00 1.00
yes 1.60 (1.17, 2.19) 1.99 (1.44, 2.74)
Co-Morbidity no 1.00 1.00
yes 2.85 (2.21, 3.69) 1.81 (1.38, 2.37)
Interaction of Age by Gender 20-39 yrs, male 1.00
20-39 yrs, female 0.90 (0.53, 1.54) 40-59 yrs, male 3.52 (2.22, 5.59) 40-59 yrs, female 2.28 (1.42, 3.64) 60 yrs +, male 5.85 (3.62, 9.46) 60 yrs +, female 7.62 (4.87, 11.9)
Interaction of WC by Ever Smoking no obese, no ever smoking 1.00
no obese, ever smoking 1.65 (1.19, 2.29)
obese, no ever smoking 4.08 (2.95, 5.65)
obese, ever smoking 3.47 (2.34, 5.14)
abbreviations : WC, waist circumference; MAR, mean adequacy ratio.
1)
Hosmer and Lemeshow χ
2=3.65 df=6 P =0.72; Nagelkerke R
2=9.6%. Variable excluded from the model during the stepwise procedure : gender, poverty income ratio, employment.
2)
Hosmer and Lemeshow χ
2=6.06 df=5 P =0.30; Nagelkerke R
2=9.4%. Variable excluded from the model during the stepwise procedure : physical exercise, drinking
3)
Hosmer and Lemeshow χ
2=2.66 df=7 P =0.92; Nagelkerke R
2=13.6%. Variable excluded from the model during the stepwise procedure : gender, poverty income ratio,
employment, MAR, physical exercise, drinking
who smoked at least 100 cigarettes in their entire life were 1.7 times (95% CI=1.26, 2.26) more likely to have T2D. Abdominal obesity mediated the relationship of ever smoking to T2D. Ever smokers were more likely to have T2D in non obese group and this smoking-associated risk was equally high among obese group. Two covariates, having family history of diabetes and having co-morbidities, were also significantly and positively associated with T2D.
Model 3 included socioeconomic, demographic, and behavioral factors together. Age and education remained significant in the two models. The education level regression coefficient remained almost unchanged. WC, family history and co-morbidity also remained significant even after controlling for behavioral risk factors. MAR became insignificant in model 3.
PIR, employment status and physical exercise which had shown significant differences in Table 1 were not included in any model during backward stepwise elimination procedures.
Discussion
This study found that there was a relationship between low level of education and T2D in Koreans. Less educated persons were found to have a significantly higher likelihood of having T2D even after adjusting for other confounders. This relationship is consistent with studies previously conducted in Asian countries as well as in developed countries (Dalstra et al., 2005; Fitzgerald, 2004; Kim et al., 2004; Wong et al., 2002; Zhang & Wang 2004).
The Korean population has a great variability in education level as a function of age and gender. The elder generation who experienced the Korean War in 1950 had few opportunities to get educated. Higher education opportunities were more available to younger generations exposed to the industrialization era that began in the 1970’s (Kim et al., 2005b). PIR and employment status were associated with T2D in the socioeconomic model but not in the model that controlled for behavioral factors as well. In both developed and developing countries, education has been shown to be a more powerful predictor of health outcomes than income inequality (Fitzgerald, 2004; Miller, 2002; Wong et al., 2002). Lack of high school education may be associated with the lifetime effect of adverse social conditions increasing the likelihood to T2D. These results stress the importance of addressing educational disparities as part of T2D prevention efforts.
There was a strong relationship between age and T2D.
Increased insulin resistance and gradual malfunctioning of insulin-producing cells as human age can explain this commonly found relationship. The prevalence of T2D in subjects aged 60 years and over was 16%, a lot more compared to younger age groups (2.8% in 20-39 years and 7.3% in 40-59 years old group).
We found, however, that the association between age and T2D was modified by gender. After controlling for socioeconomic factors, the prevalence of T2D in the 40-59 years old group was
higher in men comparing to women, while the pattern was reversed in the older age group.
The mechanism by which gender mediated the association of age with T2D could be explained in two ways: lifestyle behaviors and biological aspects. First, the T2D pattern as a function of gender change across generations. To support this assumption, we examined the gender-specific prevalence of unfavorable SES and lifestyle behaviors to T2D by age group (Fig. 1). Overall, the older groups had higher prevalence of risk factors for T2D except alcohol drinking and ever smoking. This pattern was more dramatic when comparing the 40-59 years old with the older group, than when comparing the 20-39 years old group with the 40-59 years old. There was an overall trend of higher prevalence of risk factors for T2D in all age groups in women compared to men, except alcohol drinking and ever smoking. The most interesting risk factor was abdominal obesity, which showed different patterns across age. The prevalence was higher in women than in men among the older group, showed no gender difference among 40-59 years old, and higher in men than in women among young generation. Lower physical activity in old women might contribute to the high prevalence of obesity in the group.
Metabolic changes caused by menopause may be another explanation. With menopause, women accumulate central fat, which increases the risk of T2D (Toth et al., 2000). Several studies have suggested a reduced incidence of T2D in postmenopausal women receiving hormonal therapies. However, the question of whether the benefit may occur through a reduction in insulin resistance is uncertain (Goodrow et al., 2006; Margolis et al., 2004). In a systematic review, Ding et al suggested that the influence of endogenous sex hormones on T2D risk is a function of gender (Ding et al., 2006). Further studies are needed to verify if and how gender modifies the relationship between age and T2D.
Smoking can affect T2D by acutely impairing insulin action, increasing hepatic lipase activity or inducing oxidative stress (Patja et al., 2005). Although many studies have shown an association between smoking and T2D (Al-Delaimy et al., 2001;
Hu et al., 2001; Kawakami, 1997; Sairenchi et al., 2004; Will, 2001), the effect size has varied considerably across studies. This is perhaps explained by the nature of the data collected on smoking status including history, intensity, duration, age at initiation, and time since cessation of smoking (Leffondre et al., 2002; Patja et al., 2005; Sairenchi et al., 2004). Therefore, we examined and compared the association of smoking status with T2D with ever smoking or with current smoking in separate models. Ever smokers were 1.7 times more likely to have T2D and this relationship remained significant even after adjusting for socioeconomic and demographic factors.
In comparison to ever smoking, current smoking was not
significantly associated with T2D. Thus, ever smoking may be
a better predictor of T2D than current smoking. This is reasonable
as many prior smokers are likely to quit when they are diagnosed
(a) Low education (b) Low poverty income ratio
(c) Unemployment (d) Ever smoking
(e) Alcohol drinking (f) Physical inactivity
(g) Abdominal obesity (h) Low diet quality
Fig. 1. Gender specifie prevalence of unfavourable SES and lifestyle behaviors to T2D by age group
Fig. 2. Proportion of smokers according to ever-and current-smoking status among non-diabetic and diabetic groups
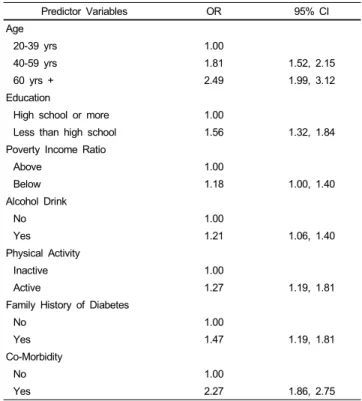
Table 4. Multivariate Logistic Regression Determinants of High Waist Circumference
Predictor Variables OR 95% CI
Age
20-39 yrs 1.00
40-59 yrs 1.81 1.52, 2.15
60 yrs + 2.49 1.99, 3.12
Education
High school or more 1.00
Less than high school 1.56 1.32, 1.84
Poverty Income Ratio
Above 1.00
Below 1.18 1.00, 1.40
Alcohol Drink
No 1.00
Yes 1.21 1.06, 1.40
Physical Activity
Inactive 1.00
Active 1.27 1.19, 1.81
Family History of Diabetes
No 1.00
Yes 1.47 1.19, 1.81
Co-Morbidity
No 1.00
Yes 2.27 1.86, 2.75
1)