• 검색 결과가 없습니다.

Absence and Resolution of Fragmented QRS Predict Reversible Myocardial Ischemia With Higher Probability of ST Segment Resolution in Patients With ST Segment Elevation Myocardial Infarction

N/A
N/A
Protected

Academic year: 2022

Share "Absence and Resolution of Fragmented QRS Predict Reversible Myocardial Ischemia With Higher Probability of ST Segment Resolution in Patients With ST Segment Elevation Myocardial Infarction"

Copied!
10
0
0

로드 중.... (전체 텍스트 보기)

전체 글

(1)

Korean Circulation Journal

Introduction

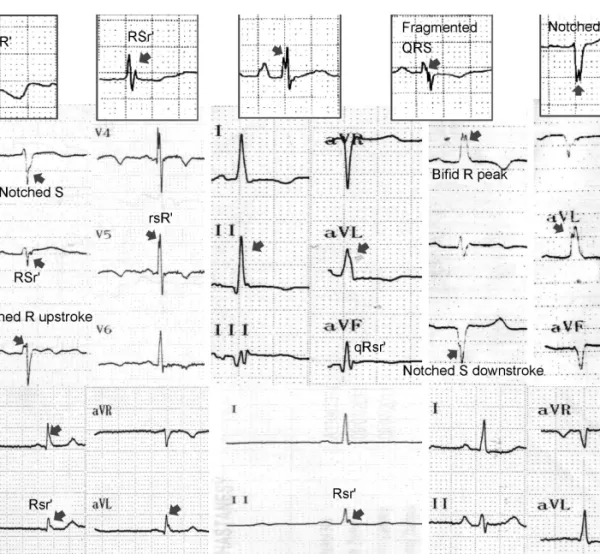
Fragmented QRS complexes (fQRS) are frequently seen on the surface electrocardiograms (ECGs) with a narrow or wide QRS com-

Print ISSN 1738-5520 • On-line ISSN 1738-5555

Absence and Resolution of Fragmented QRS Predict Reversible Myocardial Ischemia With Higher Probability of ST Segment Resolution in Patients With ST Segment Elevation

Myocardial Infarction

Mustafa Cetin, MD 1 , Sinan Altan Kocaman, MD 1 , Tuncay Kiris, MD 2 , Turan Erdogan, MD 3 , Aytun Canga, MD 1 , Murtaza Emre Durakoglugil, MD 3 , Yüksel Çiçek, MD 3 , Sitki Dogan, MD 1 , and Omer Satiroglu, MD 3

1

Department of Cardiology, Rize Education and Research Hospital, Rize,

2

Department of Cardiology, Ordu State Hospital, Ordu,

3

Department of Cardiology, Rize University, Faculty of Medicine, Rize, Turkey

Background and Objectives: Fragmented QRS complexes (fQRS) are associated with increased morbidity and mortality. The causative relationship between fQRS and cardiac fibrosis has been shown, but whether the presence and the number of fQRS on admission of elec- trocardiogram (ECG) predicts ST segment resolution in patients undergoing primary percutaneous coronary intervention (p-PCI) has not been investigated until now.

Subjects and Methods: This study included one hundred and eighty-four consecutive patients with ST elevation myocardial infarction (STEMI) who underwent p-PCI. The presence or absence of fQRS on pre and post-PCI ECG and their relation with myocardial infarction and reperfusion parameters were investigated.

Results: Patients with fQRS on admission of ECG or newly developed fQRS after p-PCI had increased inflammatory markers, higher cardiac enzyme levels, increased pain to balloon time, prolonged QRS time, more extended coronary involvement and more frequent Q waves on ECG in comparison to patients with absence or resolved fQRS. The presence and higher number of fQRS on admission or post-PCI ECGs were significantly related with low percent of ST resolution and myocardial reperfusion parameters. The area under the receiver operating characteristics curve values for the presence and number of fQRS to detect Thrombolysis in Myocardial Infarction Blush Grade 0 and 1, were 0.682 and 0.703.

Conclusion: In our study, fQRS was significantly related to infarction and myocardial reperfusion parameters before and after p-PCI.

Successful myocardial reperfusion by p-PCI caused the reduction in number of fQRS and QRS time with higher ST resolution. fQRS may be useful in identifying the patients at higher cardiac risk with increased ischemic jeopardized or infarcted myocardium, and persistent or newly developed fQRS may predict low percent of ST segment resolution in patients undergoing p-PCI. (Korean Circ J 2012;42:674-683) KEY WORDS: Fragmented QRS; Electrocardiography; Myocardial infarction; Reperfusion; Marker.

Received: February 2, 2012 / Revision Received: April 24, 2012 / Accepted: May 15, 2012

Correspondence: Sinan Altan Kocaman, MD, Department of Cardiology, Rize Education and Research Hospital, 53020, Rize, Turkey Tel: 90 (464) 217 03 64, Fax: 90 (464) 213 04 91, E-mail: [email protected]

• The authors have no financial conflicts of interest.

This is an Open Access article distributed under the terms of the Creative Commons Attribution Non-Commercial License (http://creativecommons.org/licenses/

by-nc/3.0) which permits unrestricted non-commercial use, distribution, and reproduction in any medium, provided the original work is properly cited.

plex, which includes paced rhythm, bundle branch block or ventric-

ular premature beats.

1)

These fragmentations on surface ECG were

associated with increased adverse cardiovascular events (CVEs) in

previous studies.

2-5)

fQRS may be important to determine people at

(2)

high risk for CVEs on admission and after ST elevation myocardial infarction (STEMI).

Fragmented QRS complexes on a 12-lead resting ECG are defined as various RSR’ patterns (≥1 R’ or notching of S wave or R wave) with or without Q waves lacking a typical bundle-branch block in 2 con- tiguous leads corresponding to a major coronary artery territory.

6)

Based on their duration, they are sub-classified into two subgroups as fQRS complexes with QRS duration <120 ms or ≥120 ms (frag- mented wide-QRS complexes, f-wQRS) and they can also be found on an ECG with different QRS morphologies. Sometimes, fQRS might be the only ECG marker of myocardial damage in patients with non- Q myocardial infarction and in patients with a resolved Q wave.

The reason for the documented association between fQRS and increased morbidity and mortality, sudden cardiac death, and re- current adverse cardiac events were investigated by previous stud- ies.

4)5)7-10)

In these studies, the main causative mechanism regarding fQRS was cardiac fibrosis.

11)12)

Otherwise, fQRS may represent the altered ventricular depolarization, which can be derived from differ- ent mechanisms such as the non-homogeneous activation of isch- emic ventricles in the STEMI. The causative relationship between fQRS and cardiac fibrosis has been shown, but the possible relation of fQRS on admission and after percutaneous coronary interven- tion (PCI) with myocardial infarction, reperfusion, and parameters has not been studied until now.

In this study, we investigated whether the presence of fragment- ed QRS on admission ECG predicts the ST segment resolution in pa- tients undergoing primary PCI (p-PCI) in patients with STEMI.

Subjects and Methods

Patient population and study protocol

The current study includes a prospective observational design. The study was conducted in the cardiology clinics at Rize Education and Research Hospital in Rize, Turkey and Ordu State Hospital in Ordu, Turkey. One hundred eighty four patients with STEMI and no histo- ry of coronary artery disease (CAD), who underwent primary PCI at two institutions between January 2010 and December 2010, were enrolled consecutively. An experienced cardiologist examined all patients immediately after hospitalization.

Clinical characteristics, which consisted of multiple descriptors from each patient’s history and physical examination, were col- lected by physicians from cardiology clinics for each patient and were stored in the database of a coronary angiography laboratory at each institute. We recorded the baseline characteristics, which in- clude hypertension, diabetes mellitus, smoking history, family history for CAD, and lipid parameters. Hypertension was defined as the ac- tive use of antihypertensive drugs or the documentation of blood

pressure greater than 140/90 mm Hg. Diabetes mellitus was de- fined as fasting glucose levels over 126 m/dL or glucose level over 200 mg/dL at any measurement or active use of antidiabetic drugs or insulin. Patients who were using tobacco products on admission to our hospital, and those who had quit smoking within the last year were considered as smokers. The family history for CAD was defined as a history of documentation regarding CAD or sudden death in a first-degree relative before the age of 55 for men and 65 for women.

Killip score, which is a system used in individuals with an acute myocardial infarction in order to stratify risk was used to classify pa- tients.

13)

Patients with significant organic valvular heart disease and bundle branch block (LBBB, incomplete or complete RBBB or duration QRS

>20 msn), known history of CAD, and those with permanent pace- makers were excluded from the study. Informed consent was ob- tained from all patients prior to the study. The study was perform- ed in accordance with the principles stated in the Declaration of Helsinki and approved by the Local Ethics Committee.

Presence or absence of fQRS on pre and post-PCI ECGs and their relation with myocardial infarction and perfusion parameters were investigated. In addition, logistic regression analysis was used in or- der to determine independent predictors for presence of fQRS on pre and post-PCI ECGs.

Laboratory measurements

Cardiac biomarker levels including creatine kinase (CK), creatine kinase-MB fraction (CK-MB) and Troponin-I and inflammatory mar- kers including leukocytes and other baseline parameters were mea- sured at our emergency department and used in the analyses as admission values. The lipid samples were drawn by venipuncture in order to perform routine blood chemistry after fasting for at least 8 hours. Plasma blood glucose, total cholesterol, high density lipo- protein-cholesterol, low density lipoprotein-cholesterol, and triglyc- eride levels and other parameters were recorded to our hospital da- tabase. Glucose, creatinine, and lipid profile were determined by st- andard methods. White blood cell (leukocyte) counts were obtained from an automated cell counter (Coulter Gen-S, COULTER Corp, Mi- ami, FL, USA).

Electrocardiogram

A 12-derivations surface ECG was obtained from all patients in the supine position immediately after their admission to the emer- gency care unit (ECU). The 12-lead ECG (Nihon Kohden-cardiofax S ECG-1250 K, filter range 0.5 Hz to 150 Hz, alternating current (AC) filter 60 Hz, 25 mm/s, 10 mm/mV) was analyzed by two indepen- dent clinicians who were blinded to study design and data.

The fQRS was defined as the presence of various RSR’ patterns

(3)

(QRS duration <120 ms) with or without a Q wave, which included an additional R wave (R’ prime), notching of the R wave or S wave, or the presence of more than one R prime (fragmentation) without a typical bundle branch block in two contiguous leads correspond- ing to a major lead set for major coronary artery territory (Fig. 1).

Any QRS morphology with a QRS duration >120 ms, including bun- dle branch block or intra-ventricular conduction delay were exclud- ed from the current study. Analysis of the standard 12-lead ECG was performed without using any magnification, and fragmentations were considered to be present if a visually identifiable signal was demonstrated in all complexes of a particular lead. Thus, for statis- tical analysis, fQRS was defined to be present if found in ≥2 con- tiguous anterior leads, lateral leads, or inferior leads. The QRS du- ration was determined by the longest QRS in any lead.

6)

There was a 99% concordance for ECG interpretation for the presence of fQRS, non-fQRS, and wide QRS. In case of a disagreement, the final diag- nosis was achieved by mutual agreement. We also used the concept of “number of fQRS”, which represents the number of fQRS because

“one fQRS complex” on its own was not accepted to be representa- tive of the presence of fQRS.

The diagnosis of acute STEMI was made according to an ECG ob- tained during admission to ECU in the presence of clinical symptoms and findings. Patients with chest pain that continued for longer than 30 minutes and with the presence of new or presumed new ST-seg- ment elevation at the J point in ≥2 contiguous leads of ≥0.2 mV in leads V1, V2, or V3 and ≥0.1 mV in other leads. Marked ST depres- sion, which was maximal in leads V1 through V3, without ST seg- ment elevation in other leads, was designated as posterior wall myo- cardial infarction (MI).

14)

The diagnosis of acute STEMI was also confirmed by demonstrating the responsible lesion on the coro- nary angiographies of all patients. Infarctions leading to the pres- ence of ST elevation in V 1-5 derivations, the presence of ST eleva- tions in two contiguous leads of I, aVL and V6 derivations, and the presence of ST elevation in two contiguous leads of II, III, aVF deri- vations were diagnosed as anterior MI, lateral MI and inferior MI, respectively.

15)

Fig. 1. The various types of notched and fragmented QRS complexes. Different fragmented QRS complexes patterns were shown by arrows including rSr´,

rSR´, RSr´, notched R up-stroke, notched S down-stroke, bifid R peak and bifid R nadir.

(4)

Pathologic Q wave: Any Q wave in lead V2 or V3 ≥0.02 seconds or the QS complex in leads V2 and V3 with a Q wave ≥0.03 seconds and ≥0.1 mV deep or QS complex in lead I, II, aVL, aVF, or V4 to V6 in any 2 leads of a contiguous lead grouping (I, aVL, and V6; V4 to V6;

and II, III, and aVF) was considered as pathologic. An R wave ≥0.04 seconds in lead V1 or V2 and an R/S ratio ≥1 with a concordant po- sitive T wave in the absence of a conduction defect.

14)

Jeopardized myocardium was determined by the sum of ST eleva- tions (in mm) on each ST elevated derivation on pre and post PCI ECG (Total ST elevation score). A repeat ECG was obtained at 60-min- ute after p-PCI (Fig. 2). Percent of total ST resolution was calculat- ed by the following formula: (Sum of ST elevations on Pre-PCI ECG)-(Sum of ST elevations on Post-PCI ECG)/(Sum of ST elevations on Pre-PCI ECG)×100. Delta QRS time was calculated by the fol- lowing formula: (Pre-PCI QRS duration)-(Post-PCI QRS duration).

Coronary angiography and primary percutaneous coronary intervention

All patients were administered 300 mg aspirin and 600 mg clop- idogrel loading dose prior to the procedure. At the start of the pro- cedure, 10.000 U IV heparin was administered. Coronary stenting directly, or followed by balloon angioplasty, was performed where necessary. Diameters of the vessel and stent, if performed, the dilat- ation procedure was recorded during PCI. Glycoprotein IIb-IIIa in-

hibitor (tirofiban) was administered at the consideration of the op- erator. After the operation, all patients were monitored in the inten- sive coronary unit until stabilization was achieved. All patients were treated based on the recommendations of American College of Car- diology/American Heart Association Guidelines for the Management of Patients With ST-Elevation Myocardial Infarction.

16)

Selective coronary angiography was performed urgently at the hemodynamic laboratory using the Standard Judkins technique th- rough the femoral artery. Multiple views were obtained in all pa- tients, with visualization of the left anterior descending and left cir- cumflex coronary in at least 4 views, and the right coronary artery in at least 2 views. Coronary angiograms were recorded on com- pact discs in DICOM format. Atherosclerotic coronary involvement was assessed by the number of vessels involved (vessel score) and by a severity score. Significant stenosis was determined visually and defined as a ≥50% reduction in lumen diameter in any view compared with the nearest normal segment. Vessel score ranged from 0 to 3, depending on the vessels involved (0: <50% luminal narrowing, 1, 2 and 3: number of luminal narrowed vessels of ≥50%).

Coronary atherosclerotic burden was assessed using the Gensini score.

17)

The Gensini score, which considers both the extent and the se- verity of the lesions at coronary angiography, was calculated for each patient. This scoring system grades the stenosis in the epicar-

Fig. 2. Changes in fragmented QRS complexes on surface electrocardiogram before and after primary percutaneos coronary intervention.

(5)

dial coronary arteries (1 for 1-25% stenosis, 2 for 26-50% stenosis, 4 for 51-75% stenosis, 8 for 76-90% stenosis, 16 for 91-99% ste- nosis, and 32 for total occlusion) and multiplies this number by a

constant number determined according to the anatomical position of the lesion.

The Thrombolysis in Myocardial Infarction (TIMI) Grade Flow, Table 1. Characteristics of the study population

The fragmentations on surface ECG in patients with STEMI

Parameters Absence or resolution of fQRS (n=111) Persistent or newly developed fQRS (n=73) p

Age (years) 61±13 63±12 NS

BMI (kg/m

2

) 28±4 27±4 NS

Gender (male) (%) 81 80 NS

Hypertension (%) 28 37 NS

Diabetes mellitus (%) 52 50 NS

Smoking (%) 35 40 NS

Hyperlipidemia (%) 56 56 NS

Family history of CAD (%) 13 27 0.013

Heart rate (bpm) 84±17 84±18 NS

Systolic blood pressure (mm Hg) 128±25 134±26 NS

Diastolic blood pressure (mm Hg) 81±12 82±13 NS

Plasma blood glucose (mg/dL) (Adm.) 156±63 157±68 NS

Creatinine (mg/dL) 0.96±0.3 1.1±0.4 0.048

Total cholesterol (mg/dL) 182±35 186±42 NS

LDL-C (mg/dL) 117±30 122±35 NS

HDL-C (mg/dL) 39±9 37±7 NS

Triglyceride (mg/dL) 130±84 146±75 NS

Leukocytes (10

3

/mm

3

) 12±3 14±4 0.004

Neutrophils (10

3

/mm

3

) 7.9±2.8 9.9±3.6 <0.001

Lymphocyte (10

3

/mm

3

) 2.5±1.8 2.3±1.1 NS

Monocyte (/mm

3

) 678±513 841±465 0.036

Hemoglobin (mg/dL) 13.8±2.2 14.1±2.0 NS

CK (U/L) (Adm.) 515±783 806±1029 0.044

CK-MB (U/L) (Adm.) 72±69 98±83 0.030

AST (U/L) (Adm.) 56±65 82±95 0.038

LDH (U/L) (Adm.) 447±319 461±414 NS

Troponin I (ng/mL) (Adm.) 3.6±8.7 6.8±13.6 0.097

Pain to balloon time (hours) 4.1±2.1 4.9±3.0 0.046

Killip score (3/4) (%) 7 19 0.016

Number of ST elevated derivations 3.8±1.3 4.7±1.8 <0.001

Total ST elevation on pre-PCI ECG (mm) 9.5±6.0 12.1±7.8 0.014

Total ST elevation on post-PCI ECG (mm) 3.9±3.8 6.7±6.5 0.001

Percent of total ST resolution (%) 63±28 45±48 0.002

Number of obstructed vessels ≥50% 1.9±0.8 1.7±0.8 NS

Q wave on ECG (%) 33 37 NS

QRS duration (ms) pre-PCI (Adm.) 89±14 94±13 0.024

QRS duration (ms) post-PCI 82±14 90±12 <0.001

Post-PCI TIMI score (2 and 3) 2.6±0.8 2.5±0.9 NS

Post-PCI Blush score (2 and 3) 1.7±0.5 1.5±0.5 0.028

ECG: electrocardiogram, STEMI: ST elevation myocardial infarction, fQRS: fragmented QRS complexes, NS: not significant, BMI: body mass index, CAD: coro- nary artery disease, Adm.: admission value, LDL-C: low density lipoprotein-cholesterol, HDL-C: high density lipoprotein-cholesterol, CK: creatinine kinase, CK-MB: creatinine kinase Muscle/Brain, AST: aspartate aminotransferase, LDH: lactate dehydrogenase, PCI: percutaneous coronary intervention, TIMI:

Thrombolysis in Myocardial Infarction

(6)

which is a widely adopted scoring system, grades 0-3 referring to the levels of coronary blood flow assessed during percutaneous coronary angioplasty

18)

was used to score coronary flow as previ- ously defined. The TIMI Myocardial Blush grade score

19)

was used in order to evaluate the microvascular perfusion and was scored as previously defined.

Statistical analysis

Continuous variables were given as mean±standard deviation;

categorical variables were defined as percentages. Continuous vari- ables were compared by Student t-test and the χ

2

test was used for the categorical variables between two groups. Linear regression analysis with the stepwise method were used for the multivariate analysis of independent variables, which were included if they were significantly different in the univariate analyses. All tests with re- gards to significance were two-tailed. Statistical significance was defined as p<0.05.

The Statistical Package for the Social Sciences (SPSS) statistical software (SPSS 15.0 for Windows, Inc., Chicago, IL, USA) was used for all statistical calculations.

Results

Baseline clinical characteristics were shown in Table 1. Patients with persistent or newly developed fQRS had higher leukocyte co- unts (p=0.004, especially neutrophils, p<0.001), higher CK-MB lev- els (p=0.030), increased pain to balloon time (p=0.046), higher Killip score (p=0.016), more prolonged QRS time (p=0.025), and more ex- tended coronary involvement (p<0.001) in comparison to patients with absence or resolution of fQRS. Additionally, these patients usu- ally exhibited an infarction on the anterior territory and was often related to a lesion in the proximal left anterior descending artery and the larger jeopardized myocardium (p<0.001).

In Table 2, the study parameters were presented in the groups by determined the presence or absence of fQRS on pre-PCI and post- PCI ECGs.

On the other hand, the presence and higher number of fQRS on admission or post-PCI ECGs were significantly related with the low percent of ST resolution and myocardial reperfusion parameters (Table 3). The presence of fQRS on admission of the ECG, but not on the post-PCI ECG, was significantly related to the post-PCI TIMI myo- cardial reperfusion grade. The relationships between fQRS and re- Table 2. The infarct related parameters and their relationship with fragmentations on pre and post-PCI ECG

Parameters

Fragmented QRS before and after PCI

Pre-PCI Post-PCI

nfQRS (n=94) fQRS (n=90) p nfQRS (n=97) fQRS (n=87) p

Pain to balloon time (hours) 4±2 5±3 0.004 4±2 5±2 0.046

Killip score (3/4) (%) 3 23 <0.001 7 19 0.016

IRA (%) 0.002 0.044

LAD 38 64 44 62

CX 35 20 34 20

RCA 27 16 22 18

Territory of STEMI (anterior) (%) 38 64 <0.001 44 62 0.017

Number of ST elevated derivations 3.7±1.3 4.9±1.7 <0.001 3.9±1.3 4.7±1.8 <0.001

Total ST elevation on pre-PCI ECG (mm) 8.9±5.9 12.8±7.6 <0.001 9.5±6.0 12.1±7.8 0.014

Total ST elevation on post-PCI ECG (mm) 3.8±4.3 7.0±6.2 <0.001 3.9±3.9 6.7±6.6 0.001

Percent of total ST resolution (%) 62±30 45±46 0.005 63±28 45±49 0.002

Number of obstructed vessels ≥50% 1.9±0.7 1.8±0.8 NS 1.9±0.8 1.7±0.8 NS

Total occlusion in IRA (%) 79 82 NS 83 80 NS

Q wave on ECG (%) 27 41 0.039 33 37 NS

Gensini score 52±23 67±27 <0.001 59±24 60±27 NS

QRS duration (ms) pre-PCI (Adm.) 88±13 96±14 <0.001 89±14 94±13 0.024

QRS duration (ms) post-PCI 83±14 92±13 <0.001 82±14 90±12 <0.001

Post-PCI TIMI score (2 and 3) (%) 90 87 NS 90 86 NS

Post-PCI Blush score (2 and 3) (%) 81 48 <0.001 72 58 0.055

PCI: percutaneous coronary intervention, ECG: electrocardiogram, nfQRS: non-fragmented QRS, fQRS: fragmented QRS complexes, IRA: infarct related artery,

LAD: left anterior descending artery, Cx: circumflex coronary artery, RCA: right coronary artery, STEMI: ST elevation myocardial infarction, Adm.: admission

value, TIMI: Thrombolysis in Myocardial Infarction Coronary

(7)

perfusion parameters were presented in Table 4. In the multivariate analysis, only the Gensini score (p=0.027), delta QRS time (p=0.001) and persistent or newly developed fQRS (p=0.035) predicted the percent of total ST resolution (Table 5).

The area under the receiver operating characteristics curve values for the presence and number of fQRS to detect TIMI Blush Grade 0 and 1, were 0.682 and 0.703 (Fig. 3).

Discussion

In this study, we aimed to evaluate the relationship between the presence of fQRS on admission as well as post-PCI ECGs and myo- cardial reperfusion parameters in patients with STEMI. We found that fQRS was related with inflammatory state, prolonged QRS time, the extent of infarction, and jeopardized myocardium and myocardial perfusion before and after primary PCI. Moreover, although fQRS

might be less valuable in STEMI, compared to acute coronary syn- drome whose ECG changes are more nonspecific; the absence and resolution of fragmented QRS and QRS narrowing on ECG showed the diagnostic value as a useful marker of successful myocardial re- perfusion, similar to the percent of total ST resolution.

Although fQRS is defined as unexpected deviations in the QRS morphology, the exact cause of QRS complex fractionations on sur- face ECG is not yet completely known. fQRS predicts cardiac events in different populations. Pathophysiologically, fQRS is generally due to regional myocardial fibrosis/scar and data suggests that ischemia might cause fQRS via nonhomogeneous myocardial electrical activ- ation.

20-24)

In patients with ischemic or non-ischemic left ventricular dysfunction, fQRS correlated with myocardial fibrosis.

25)

In previous studies in which Gadolinium delayed the enhancement on cardiac magnetic resonance imaging and was used to determine myocar- dial structure, fQRS has shown a relation with extensive myocardi- Table 3. The relationship of percent of total ST resolution after PCI with fQRS

Post-PCI ST resolution

Parameters <70% (n=121) ≥70% (n=63) p

Gensini score 62±25 55±26 0.088

Total ST elevation on pre-PCI ECG (mm) 11.7±7.1 9.1±6.5 0.018

Total ST elevation on post-PCI ECG (mm) 7.3±5.7 1.4±1.5 <0.001

Delta QRS time (ms) -2±12 -10±11 <0.001

Presence of fQRS (pre-PCI) (%) 54 37 0.033

Presence of fQRS (post-PCI) (%) 58 36 0.005

Number of fQRS (pre-PCI) 1.7±1.8 1.1±1.5 0.028

Number of fQRS (post-PCI) 1.8±1.7 1.1±1.6 0.012

Localization fQRS (%)

Anterior 31 10 0.002

Lateral 6 7 NS

Inferior 22 24 NS

Post-PCI ST resolution

Parameters <50% (n=64) ≥50% (n=120) p

Gensini score 65±23 56±27 0.041

Total ST elevation on pre-PCI ECG (mm) 12.8±7.7 9.8±6.4 0.010

Total ST elevation on post-PCI ECG (mm) 10.1±6.4 2.8±2.5 <0.001

Delta QRS time (ms) 0.3±8 -8±13 <0.001

Presence of fQRS (pre-PCI) (%) 62 41 0.007

Presence of fQRS (post-PCI) (%) 67 42 0.001

Number of fQRS (pre-PCI) 1.9±1.7 1.3±1.7 0.020

Number of fQRS (post-PCI) 2.1±1.7 1.3±1.7 0.001

Localization fQRS (%)

Anterior 33 18 0.023

Lateral 5 7 NS

Inferior 26 20 NS

PCI: percutaneos coronary intervention, ECG: electrocardiogram, fQRS: fragmented QRS complexes

(8)

al scar.

11)12)

fQRS was also found to be a marker of a prior MI, defined by regional perfusion abnormalities, which has a substantially higher sensitivity and negative predictive value compared with the Q wave.

6)26)

It has been shown that regional fQRS patterns denote the pres- ence of a greater corresponding focal regional myocardial scar on stress myocardial perfusion imaging.

27)

Additionally, it was known that chronic ischemia could cause myocardial patchy fibrosis with- out prior MI.

28)

Today, it is well known that myocardial ischemia could cause he- art failure and ventricular arrhythmias due to the development of scar tissue, which is related with increased mortality and morbidi- ty.

6)20)27)29)

In the setting of acute coronary syndrome, non-homog- enous depolarization of myocardium caused by ischemia and in- farction may be the main determinant for increased arrhythmic events in hospital course. In our study, the extent of infarcted myo- cardium on admission was assessed by cardiac biomarkers and, fQRS was found to be related to the extent of infarcted myocardi-

Table 4. The relationship of TIMI myocardial blush perfusion grade score after PCI with study parameters

Post-PCI Myocardial perfusion

Parameters Blush score (0 and 1) (n=64) Blush score (2 and 3) (n=120) p

Gensini score 67±25 55±25 0.005

Percent of total ST resolution 41±27 61±44 0.001

Total ST elevation on pre-PCI ECG (mm) 12.3±7.2 10.0±6.8 0.036

Total ST elevation on post-PCI ECG (mm) 7.6±5.5 4.1±5.1 <0.001

Delta QRS time (ms) -1.3±10.3 -6.7±12.6 0.002

Presence of fQRS (pre-PCI) (%) 72 35 <0.001

Presence of fQRS (post-PCI) (%) 60 45 0.055

Number of fQRS (pre-PCI) 2.4±1.9 1.0±1.5 <0.001

Number of fQRS (post-PCI) 1.9±1.9 1.4±1.6 0.028

Localization fQRS (%)

Anterior 39 16 <0.001

Lateral 8 6 NS

Inferior 36 16 0.003

TIMI Blush Grade: Thrombolysis in Myocardial Infarction coronary blush perfusion grade, PCI: percutaneos coronary intervention, ECG: electrocardiogram, fQRS: fragmented QRS complexes

Table 5. Linear regression analysis was used for prediction of myocardial reperfusion

Linear regression analysis Dependent variable:

Percent of total ST resolution

Independent variables p Beta (standardized)

Persistent or newly developed fQRS 0.035 -0.165

Gensini score 0.027 -0.173

Delta QRS time (ms) (QRS narrowing) 0.001 0.270 Total ST elevation on pre-PCI ECG (mm) -0.040 0.613 fQRS: fragmented QRS complexes, PCI: percutaneos coronary intervention, ECG: electrocardiogram

Fig. 3. The sensitivity and the specificity of study parameters to detect Th- rombolysis in Myocardial Infarction Blush Grade 0 and 1. ROC: receiver op- erating characteristics, fQRS: fragmented QRS complexes, PCI: percutaneos coronary intervention, AUC: area under the curve, SE: standard error.

1.0

0.8

0.6

0.4

0.2

0.0

Source of the curve

ROC curve

0.0 0.2 0.4 0.6 0.8 1.0 1-specificity

Se ns iti vi ty

Presence of fQRS Number of fQRS (pre-PCI) QRS time

Gensini score

Percent of total ST resolution Reference line

Predictors AUC SE p 95%CI

Presence of fQRS (pre-PCI) 0.682 0.045 0.000 0.595-0.770

Number of fQRS (pre-PCI) 0.703 0.044 0.000 0.616-0.790

QRS time 0.606 0.046 0.029 0.516-0.696

Gensini score 0.644 0.045 0.003 0.556-0.732

Percent of total ST resolution-1 0.767 0.041 0.000 0.687-0.847

(9)

um at admission. Especially, this relation was significant for CK and CK-MB, but not for Troponin I for admission values. Possibly, this may be related to the late increase in Troponin levels in the setting for STEMI. Similarly, we also found that fQRS was related with the extent and severity of CAD. This is possibly derived from the extent of jeopardized ischemic myocardium, which may also cause the non-homogenous conduction on the myocardium.

2)23)

In patients with acute coronary syndrome, prolonged QRS time was associated with increased long term mortality due to increas- ed heart failure, arrhythmia and ischemia.

30)

In our study, prolong- ed QRS time was related to fQRS even relatively in the normal range of QRS (<120 ms). This relation may have two possible explana- tions. Either fragmentation on the QRS complex is induced by the prolongation in QRS time or the fragmentation on the QRS causes an increase in the duration of the QRS complex. However, by our study design, we can only speculate which one is the cause and which one is the result or response in regards to the fragmentation.

This interaction should be examined in order to clarify the cause- result relationship in an electrophysiological based study.

Although the presence of fQRS on admission was significantly related with the post-PCI TIMI myocardial perfusion grade, the pres- ence of post-PCI fQRS was not related to myocardial perfusion grade significantly. In our opinion, myocardial stunning and hiber- nation concepts may explain this gap. At the cellular level, electri- cal homogeneity can slowly be restored in these situations despite sufficient myocardial reperfusion. In our study, this explanation may also be supported by additional findings. The patients with sufficient perfusion provided by p-PCI had fQRS at a rate of 45%

even after PCI. We can speculate that in some patients, the frag- mentations were related to the presence of stunned myocardium, which can resolve in the course and in others cannot due to the presence of myocardial scar.

Twelve-lead surface ECG, which is a cheap, non-invasive, and eas- ily apprehensible method, is presently a gold standard in differential diagnosis, determining treatment methods, and performing risk st- ratification of STEMI. ST elevation, Q wave, and several repolarization abnormalities are commonly used in diagnosis of MI. Additionally, fQRS may also be of great value in predicting the cardiac status as well as short and long term prognosis. fQRS may be useful in identi- fying patients at higher cardiac risk with ischemic jeopardized or in- farcted myocardium, and it can also provide information about the presence of enhanced heterogeneity of myocardial conduction and cardiac electrical instability in an individual patient. fQRS, which may be derived from the effects of individual risk, myocardial infarc- tion and perfusion related factors on myocardial electricity at the cellular level, can represent increased cardiac risk by different caus- ative mechanisms in patients with STEMI.

In conclusion, fragmented QRS may predict a low percent of ST segment resolution and unsuccessful reperfusion in patients under- going p-PCI. Moreover, the absence and resolution of fQRS may pre- dict reversible myocardial ischemia with a high percent of ST seg- ment resolution in patients with STEMI.

References

1. Das MK, Suradi H, Maskoun W, et al. Fragmented wide QRS on a 12- lead ECG: a sign of myocardial scar and poor prognosis. Circ Arrhythm Electrophysiol 2008;1:258-68.

2. Das MK, Michael MA, Suradi H, et al. Usefulness of fragmented QRS on a 12-lead electrocardiogram in acute coronary syndrome for predict- ing mortality. Am J Cardiol 2009;104:1631-7.

3. Korhonen P, Husa T, Konttila T, et al. Fragmented QRS in prediction of cardiac deaths and heart failure hospitalizations after myocardial in- farction. Ann Noninvasive Electrocardiol 2010;15:130-7.

4. Das MK, Saha C, El Masry H, et al. Fragmented QRS on a 12-lead ECG:

a predictor of mortality and cardiac events in patients with coronary artery disease. Heart Rhythm 2007;4:1385-92.

5. Pietrasik G, Goldenberg I, Zdzienicka J, Moss AJ, Zareba W. Prognostic significance of fragmented QRS complex for predicting the risk of re- current cardiac events in patients with Q-wave myocardial infarction.

Am J Cardiol 2007;100:583-6.

6. Das MK, Khan B, Jacob S, Kumar A, Mahenthiran J. Significance of a fragmented QRS complex versus a Q wave in patients with coronary artery disease. Circulation 2006;113:2495-501.

7. Das MK, Zipes DP. Fragmented QRS: a predictor of mortality and sud- den cardiac death. Heart Rhythm 2009;6(3 Suppl):S8-14.

8. Cheema A, Khalid A, Wimmer A, et al. Fragmented QRS and mortality risk in patients with left ventricular dysfunction. Circ Arrhythm Electro- physiol 2010;3:339-44.

9. Das MK, El Masry H. Fragmented QRS and other depolarization abnor- malities as a predictor of mortality and sudden cardiac death. Curr Opin Cardiol 2010;25:59-64.

10. Das MK, Maskoun W, Shen C, et al. Fragmented QRS on twelve-lead electrocardiogram predicts arrhythmic events in patients with ischemic and nonischemic cardiomyopathy. Heart Rhythm 2010;7:74-80.

11. Gardner PI, Ursell PC, Fenoglio JJ Jr, Wit AL. Electrophysiologic and an- atomic basis for fractionated electrograms recorded from healed myo- cardial infarcts. Circulation 1985;72:596-611.

12. Chatterjee S, Changawala N. Fragmented QRS complex: a novel marker of cardiovascular disease. Clin Cardiol 2010;33:68-71.

13. Killip T 3rd, Kimball JT. Treatment of myocardial infarction in a coronary care unit. A two year experience with 250 patients. Am J Cardiol 1967;

20:457-64.

14. Thygesen K, Alpert JS, White HD, et al. Universal definition of myocar- dial infarction. Circulation 2007;116:2634-53.

15. Alpert JS, Thygesen K, Antman E, Bassand JP. Myocardial infarction re-

defined: a consensus document of The Joint European Society of Car-

diology/American College of Cardiology Committee for the redefini-

tion of myocardial infarction. J Am Coll Cardiol 2000;36:959-69.

(10)

16. Antman EM, Hand M, Armstrong PW, et al. 2007 focused update of the ACC/AHA 2004 guidelines for the management of patients with ST- elevation myocardial infarction: a report of the American College of Cardiology/American Heart Association Task Force on Practice Guide- lines: developed in collaboration with the Canadian Cardiovascular So- ciety endorsed by the American Academy of Family Physicians: 2007 writing group to review new evidence and update the ACC/AHA 2004 guidelines for the management of patients with ST-elevation myo- cardial infarction, writing on behalf of the 2004 writing committee. Cir- culation 2008;117:296-329.

17. Gensini GG. A more meaningful scoring system for determining the severity of coronary heart disease. Am J Cardiol 1983;51:606.

18. The TIMI Study Group. The thrombolysis in myocardial infarction (TIMI) trial. N Engl J Med 1985; 31:932-6.

19. Gibson CM, Cannon CP, Murphy SA, et al. Relationship of TIMI myocar- dial perfusion grade to mortality after administration of thrombolytic drugs. Circulation 2000;101:125-30.

20. Flowers NC, Horan LG, Thomas JR, Tolleson WJ. The anatomic basis for high-frequency components in the electrocardiogram. Circulation 1969;

39:531-9.

21. Lesh MD, Spear JF, Simson MB. A computer model of the electrogram:

what causes fractionation? J Electrocardiol 1988;21 Suppl:S69-73.

22. Friedman PL, Fenoglio JJ, Wit AL. Time course for reversal of electro- physiological and ultrastructural abnormalities in subendocardial Pur- kinje fibers surviving extensive myocardial infarction in dogs. Circ Res 1975;36:127-44.

23. Wiener I, Mindich B, Pitchon R. Fragmented endocardial electrical ac-

tivity in patients with ventricular tachycardia: a new guide to surgical therapy. Am Heart J 1984;107:86-90.

24. Basaran Y, Tigen K, Karaahmet T, et al. Fragmented QRS complexes are associated with cardiac fibrosis and significant intraventricular sys- tolic dyssynchrony in nonischemic dilated cardiomyopathy patients with a narrow QRS interval. Echocardiography 2011;28:62-8.

25. Calore C, Cacciavillani L, Boffa GM, et al. Contrast-enhanced cardiovas- cular magnetic resonance in primary and ischemic dilated cardiomy- opathy. J Cardiovasc Med (Hagerstown) 2007;8:821-9.

26. Reddy CV, Cheriparambill K, Saul B, et al. Fragmented left sided QRS in absence of bundle branch block: sign of left ventricular aneurysm. Ann Noninvasive Electrocardiol 2006;11:132-8.

27. Mahenthiran J, Khan BR, Sawada SG, Das MK. Fragmented QRS com- plexes not typical of a bundle branch block: a marker of greater myo- cardial perfusion tomography abnormalities in coronary artery dis- ease. J Nucl Cardiol 2007;14:347-53.

28. Weinberg SL, Reynolds RW, Rosenman RH, Katz LN. Electrocardio- graphic changes associated with patchy myocardial fibrosis in the absence of confluent myocardial infarction; an anatomic correlative study. Am Heart J 1950;40:745-59.

29. Varriale P, Chryssos BE. The RSR’ complex not related to right bundle branch block: diagnostic value as a sign of myocardial infarction scar.

Am Heart J 1992;123:369-76.

30. Ari H, Cetinkaya S, Ari S, Koca V, Bozat T. The prognostic significance of

a fragmented QRS complex after primary percutaneous coronary in-

tervention. Heart Vessels 2012;27:20-8.

수치

Fig. 1. The various types of notched and fragmented QRS complexes. Different fragmented QRS complexes patterns were shown by arrows including rSr´,  rSR´, RSr´, notched R up-stroke, notched S down-stroke, bifid R peak and bifid R nadir.
Fig. 2. Changes in fragmented QRS complexes on surface electrocardiogram before and after primary percutaneos coronary intervention.
Table 5. Linear regression analysis was used for prediction of myocardial  reperfusion

참조

관련 문서