An Analysis for Optimization of Rubber Granule Layer in Synthetic Surfaced Track using Response Surface Methodology
Ki-Weon Kang
1and Seung-Pyo Lee
2*1School of Mechanical and Automobile Enginnering, Kunsan National University
2Department of Mechanical Engineering, Hanyang University
반응표면법을 이용한 육상트랙용 고무칩층의 최적설계에 관한 연구
강기원
1, 이승표
2*1국립군산대학교 기계자동차공학부
2한양대학교 기계공학과
Abstract This paper aims to evaluate the effect of each material ingredient on mechanical and dynamic performance and to determine an optimal mixing condition of a rubber granule layer. To minimize the required number of tests, the test matrix was established by using the design of experiments (DOE). The tensile tests were then performed to identify the mechanical properties. Also, to evaluate the dynamic performance that the IAAF has required for athletics tracks for athletes’ safety and balance, a series of impact tests were performed by using the so-called the “artificial athlete” machine. Finally, the response surface methodology was used to decide the optimal mixing conditions needed to achieve a high level of mechanical properties and dynamic performance.
요 약 본 논문은 육상트랙용 복합탄성포장재의 고무칩층의 최적 배합조건을 결정하기 위하여 기계적 및 동적 성능
에 대한 각 구성요소의 영향을 평가한 것이다. 이에 소요되는 시험 횟수의 최소화를 위하여 실험계획법을 적용하였으
며 이에 따라 기계적 및 국제육상연맹(IAAF)에서 요구하는 동적성능에 대한 시험을 수행하였다. 마지막으로 반응표면 법을 이용하여 기계적 특성 및 동적 성능을 최적화하기 위한 배합조건을 결정하였다.
Key Words : Dynamic Performance, Optimization, Response Surface Methodology, Rubber Granule Layer
*Corresponding Author : Seung-Pyo Lee([email protected])
Received November 2, 2009 Revised (1st February 4, 2010, 2nd March 4, 2010) Accepted March 18, 2010
1. Introduction
Modern synthetic surfaces are high performance systems formulated to be durable and designed to offer the best combination of dynamic performance. These have been widely used through the world for their dynamic performance, durability and all-weather capability for athletic tracks [1-3]. There are several sub-division of surface type: some are prefabricated in factories and delivered to sites as rolls of material that are bonded to the base; some (in-situ system) are fabricated on site by machine mixing and laying the raw material ingredients;
and others are composites of these two systems [1].
In Korea, the elastic compound pavement system which is a kind of in-situ system, has been most commonly used for the outdoor tracks for public use [4].
The system is formed from a base layer of resin-bound rubber granule. After curing, a polyurethane layer is applied to form the top surface. Among these layers, the granule layer is a mixture of rubber granule with a polyurethane resin in the correct proportion and plays an important role in the dynamic performance and durability of the surface. There are a considerable number of installers [4] and, unfortunately, they have used different
rubber granules and resins, even varying the mixing proportions. Moreover, the compatibility of the raw material ingredients is of vital importance and the end properties of such systems depend on the nature of the raw materials and their mixing condition.
And these surfacing systems should meet the requirements of durability and performance. Mechanical properties are most important factor for structural integrity, including durability. And since sports injuries may be associated with the dynamic performance of surfaces which is the interaction between the foot and surface [5,6], these properties are the most important factors [6]. Several researchers including the IAAF (International Amateur Athletic Federation) have revealed that the foot-surface interaction is a very complex behavior and the interaction has the extent of the variation in loading and duration of load [1,5,6]. Nevertheless, the IAAF has stipulated the dynamic performance of surfaces in terms of force reduction and vertical deformation in an attempt to assess the potential of sports surfaces to reduce the forces acting on the human body. The performance of surfacing systems, however, is affected by the nature of raw materials and their mixing condition as mentioned above. It is, therefore, necessary to decide the optimal mixing condition for the superior mechanical and dynamic performance of the rubber granule layer.
This paper examines the effect of each material ingredient on the mechanical and dynamic performance and determines an optimal mixing condition for rubber granule layers. To minimize the required number of tests, a test matrix was established by using the design of experiments (DOE). From the results of tensile and impact tests, the compatibility of the raw material ingredients was evaluated. Also, the response surface methodology was used to decide the optimal mixing condition needed to achieve a high level of mechanical and dynamic performance.
2. Experimental Procedure
2.1 Materials and specimen
The rubber granule layer is a sub-part of the elastic compound pavement system, as shown in Fig. 1. The
layer is composed of rubber granules and a one-component moisture-curing polyurethane resin [4], as illustrated in Fig. 2. The granule was made from the three types of EPDM (ethylene propylene dien polyMethylene) and one SBR (styrene-butadiene rubber). The polyurethane resins were provided by six manufacturers in Korea. Some of the manufacturers are certified by the IAAF for the athlete tracks.
Urethane layer Rubber granule layer
Base layer
Sealing layer
Primer
Urethane layer
Top Coating Urethane layer Rubber granule layer
Base layer
Sealing layer
Primer
Urethane layer
Top Coating
[Fig. 1] Elastic compound pavement system
Rubber granule
Polyurethane resin Rubber
granule
Polyurethane resin
[Fig. 2] Rubber granule
The layers were fabricated according to the manufacturers' recommended process with dimension of 500×500×15mm (L×W×T). Firstly, the granules and resin were mixed very carefully according to the prescribed weight proportions and the mixed layers were cured in the environmental chamber under a temperature of 30±1℃
and relative humidity of 60±5% for 48 hours. And, the layers were cured under the ambient condition for 168 hours. The layers were cut into specimens with dimensions of 180×30×15mm and 500×500×15mm for tensile and dynamic tests, respectively.
2.2 Mechanical and dynamic tests
The tensile tests were conducted at ambient temperature by using a servo-hydraulic testing machine (Instron 8801). The static tests were performed under a displacement control mode with a crosshead speed of 50±0.5mm/min and the elongation was monitored by using an extensometer with a gage length of 50mm, according to KS M6518 [7]. Seven tensile tests were
performed for each test set.
And the dynamic performance was measured by using the in-house designed “Artificial athlete” according to the IAAF regulation [1], as shown in Fig. 3. To measure the force reduction, the foot is fitted with a force transducer that enables the peak force during the impact event to be recorded. Simultaneously, the deformation of the test foot is measured by displacement transducer mounted on both sides of the foot. The force reduction and vertical deformation were measured five and three times for each test set, respectively.
[Fig. 3] Artificial athlete
3. Results and Discussion
3.1 Mechanical and dynamic behavior Since the synthetic surfaces require a considerable financial investment, the quality of the synthetic surfaces should be improved with respect to their durability and sports-related performance of surface. In particular, the rubber granule layer is bounded by polyurethane resin;
hence, the compatibility of the raw material ingredients is of vital importance. For this, the mechanical and dynamic tests were performed for the rubber granule layers. Here the rubber granules were supplied by three EPDM and one SBR granules manufacturers in Korea; the polyurethane resins are provided by six major manufactures. Accordingly, twenty-four layers were fabricated according to the manufacturers' recommended process, and the tensile and dynamic tests were performed for each test set.
To understand the mechanical behavior, the averaged mechanical properties are plotted against the rubber granule types in Fig. 4.
0.0 0.2 0.4 0.6 0.8 1.0 1.2 1.4 1.6
Resin A Resin B Resin C
Resin D Resin E Resin F
SBR D EPDM C EPDM B EPDM A
Rubber Granule Layer Tensile Strength
Tensile Strength, σu [MPa]
Rubber Graunle Manufacturers
(a) Tensile strength
0 20 40 60 80 100 120 140 160
Resin A Resin B Resin C
Resin D Resin E Resin F
SBR D EPDM C EPDM B EPDM A
Rubber Granule Layer Failure Strain
Failure Strain, εf [%]
Rubber Graunle Manufacturers
(b) Failure strain
[Fig. 4] Mechanical properties of rubber granule layer
As shown in Fig. 4(a), the tensile strength is greatly affected by rubber granule types and for a given granule type, the resin is also a governing factor on the tensile strength. For example, the layer with resin type B has the highest value for all the rubber granules, while the layer with resin type C has an adverse tendency. Also, the tensile strength for a given resin type shows remarkable variation according to the rubber granule type. These behaviors may result from the adhesive characteristics between the granule and resin. Also, the failure strain in Fig. 4(b) exhibits a similar tendency.
0 20 40 60 80
Resin A Resin B Resin C
Resin D Resin E Resin F
SBR D EPDM C EPDM B EPDM A
Rubber Granule Layer Force Reduction
Force Reduction, FR [%]
Rubber Graunle Manufacturers
(a) Force Reduction
Factor Factor range -1.287 -1 0 +1 +1.287
x1 Resin type Resin A Resin B Resin C Resin D Resin E
x2 Rubber proportion 16.57% 18.00% 23.00% 28.00% 29.44%
x3 Mesh distribution 53.91% 57.50% 70.00% 82.5% 86.09%
[Table 1] Design variables of rubber granule layer 0.0
0.5 1.0 1.5 2.0 2.5 3.0
Resin A Resin B Resin C
Resin D Resin E Resin F
SBR D EPDM C EPDM B EPDM A
Rubber Granule Layer Vertical Deformation
Vertical Deformation, VD [mm]
Rubber Graunle Manufacturers
(b) Vertical Deformation
[Fig. 5] Dynamic performance of rubber granule layer
The dynamic performance is one of the most important quantities for synthetic surfaces [5,6] and is most commonly quantified using the Artificial Athlete described in the IAAF regulation [1]. This test has been developed to simulate the initial impact force with a time and magnitude of force corresponding to those occurring in running. Fig. 5 represents the averaged dynamic performance namely, the force reduction and vertical deformation for each type of the granules. Compared with the mechanical properties, the force reduction in Fig. 5(a) is not particularly sensitive to the rubber granule and the resin type. Similar behavior could be found for the vertical deformation illustrated in Fig. 5(b). Since the load is the in-plane condition for the tensile tests, the adhesive characteristics between the granule and resin are dominating factor for improving the mechanical properties. The loads in the dynamic tests are, however, applied to the layers under out-of-plane conditions and the resin may play a role in holding the granules; hence, the properties of the rubber granules are the important factors in the dynamic performance of the surface.
3.2 Optimization for performance
3.2.1 Design of experiments and response surface methodology
The mechanical and dynamic performance may be
associated with the durability and occurrence of surface-related injuries. Also, they may be affected by several variables related to the rubber granule laver.
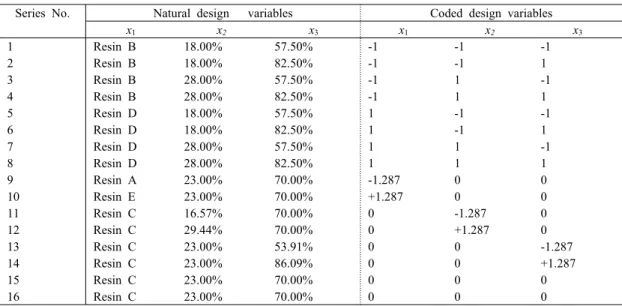
Based on the installers' recommendations for the variables, the authors are concerned with three design variables from mixing conditions. Table 1 and Table 2 show the design variables and their ranges, respectively according to the DOE (central composite design) [8, 9].
Here, the design variables x1, x2 and x3 indicate the type of polyurethane resin, the proportion of resin and the mesh distribution of the granules, respectively. Their ranges have been selected to cover the general circumstances on site in Korea. The levels of coded design variables x1 and x2 signify the polyurethane resin types (resin A-E) and the proportion of resin to the granule layer in weight. Also, the third variable x3, mesh distribution, is the size of the rubber granules. Here the rubber granule used was the EPDM A for Fig. 4 and 5.
Basically, in the response surface methodology, an experimental model of the response should first be established, and then the fitted surface models are optimized simultaneously in a region of interest. Typical second-order models for the response are given by
0 1
k k
i i ij i j
i i j
x x x
µ β β β
= <
= +
∑
+∑
(1)in which m is the estimated value of the responses (m1
: tensile strength, m2 : failure strain, m3 : force reduction and m4 : vertical deformation). Also, k and b are number of design variables and coefficients of the fitted response surface, respectively.
Based on the experimental results for mechanical and dynamic performance according to the central composite design, the response surfaces were fitted by using Eq. (1) and the non-linear regression method [8] as shown in Table 3. The ANOVA results for the response surfaces are summarized in Table 4. From the table, the response surfaces are statistically significant to 90% confidence
Series No. Natural design variables Coded design variables
x1 x2 x3 x1 x2 x3
1 Resin B 18.00% 57.50% -1 -1 -1
2 Resin B 18.00% 82.50% -1 -1 1
3 Resin B 28.00% 57.50% -1 1 -1
4 Resin B 28.00% 82.50% -1 1 1
5 Resin D 18.00% 57.50% 1 -1 -1
6 Resin D 18.00% 82.50% 1 -1 1
7 Resin D 28.00% 57.50% 1 1 -1
8 Resin D 28.00% 82.50% 1 1 1
9 Resin A 23.00% 70.00% -1.287 0 0
10 Resin E 23.00% 70.00% +1.287 0 0
11 Resin C 16.57% 70.00% 0 -1.287 0
12 Resin C 29.44% 70.00% 0 +1.287 0
13 Resin C 23.00% 53.91% 0 0 -1.287
14 Resin C 23.00% 86.09% 0 0 +1.287
15 Resin C 23.00% 70.00% 0 0 0
16 Resin C 23.00% 70.00% 0 0 0
[Table 2] Design of experiments for tensile and impact tests
Performance β0 β1 β2 β3 β4 β5 β6 β7 β8 β9
Tensile strength 46.07 -0.69 7.66 0.71 -6.36 0.64 0.22 0.10 0.57 -0.42 Failure strain 30.42 -6.39 -0.34 -0.29 -3.28 3.17 1.23 0.30 0.85 0.32 Force reduction 32.68 -1.78 -3.88 -0.72 2.84 -0.24 -0.49 0.06 -0.04 -0.09 Vertical deformation 9.94 -1.15 -2.21 -0.11 0.74 0.56 -0.30 0.57 0.15 0.31
[Table 3] Estimated coefficients in response surface Eq. (1)
Performance Sum of
square
Degree of freedom
Root mean square
Fo F(a=0.10) R2
Tensile strength SSR 902.86 9 100.32 15.336 2.96 0.958
SSE 39.25 6 6.54 - - -
SST 942.11 15 - - - -
Failure strain SSR 949.86 9 105.54 3.012 2.96 0.905
SSE 210.21 6 35.04 - - -
SST 1049.70 15 - - - -
Force reduction SSR 258.24 9 28.69 13.55 2.96 0.953
SSE 12.70 6 2.12 - - -
SST 270.94 15 - - - -
Vertical deformation SSR 79.36 9 8.82 24.64 2.96 0.974
SSE 2.15 6 0.36 - - -
SST 81.51 15 - - - -
[Table 4] ANOVA table of response function for each performance factor
level at least. Here, SSR, SSE and SST are the sum of squares in response, the sum of squares in error and the sum of squares in total, respectively.
Fig. 6 illustrates the typical approximated response surfaces for dynamic performance factor. In Fig. 6, the tensile strength is maximized at the higher resin proportion and the effect of mesh distribution could be
negligible; when the resin proportion becomes higher, more and more resin could bind the granules and lead to a higher tensile strength. However, the resin proportion has an adverse effect on the failure strain. Also, the resin and mesh distribution has a similar effect on the force reduction and vertical deformation.
Design Variables
Results for mechanical properties Results for dynamic performance Optimal
variables
Expected properties Optimal variables
Expected performance Tensile strength Failure strain Force reduction Deformation x1 Resin A
0.483 MPa 40.835 %
Resin A
44.663 % 1.393 mm
x2 29.435 16.565
x3 53.913 57.225
x1 Resin B
0.521 MPa 40.948 %
Resin B
42.286 % 1.670 mm
x2 29.435 16.565
x3 53.913 57.688
x1 Resin C
0.576 MPa 37.433 %
Resin C
37.642 % 1.394 mm
x2 29.435 16.565
x3 86.088 59.313
x1 Resin D
0.514 MPa 29.250 %
Resin D
38.645 % 1.268 mm
x2 29.435 16.565
x3 86.088 61.088
x1 Resin E
0.473 MPa 25.691 %
Resin E
43.534 % 1.490 mm
x2 29.435 16.565
x3 86.088 61.638
[Table 5] Optimized design variables and expected performance
-2 -1
0 1
2 20
25 30 35 40 45 50 55 60
-2 -1 0 1 2
Mean of Force reduction, Fr,mean
Mesh Distribution, x3 Resin P
roportion, x
2
Resin type, x
1 = -1.287
(a) Force reduction
-2 -1
0 1
2 0.0
0.5 1.0 1.5 2.0 2.5 3.0
-2 -1 0 1 2
Mean of Vertical deformation, VD,mean
Mesh Distribution, x3
Resin Proportion, x
2
Resin type, x
1 = -1.287
(b) Vertical deformation [Fig. 6] Response surfaces in Resin A
3.2.2 Optimization of performance factors The goal of this design study was to determine the optimum design variables in the mixing conditions of the
rubber granule layer, which requires the maximization of both the mechanical and dynamic performance. Here, it should be noted that when the impact events occur in the granule layers, the response mechanisms are quite different as mentioned previously. It is, therefore, reasonable to optimize the mechanical and dynamic performance in separate objective functions. Also, the installers have chosen and layered resins considering the efficiency and on-site situations; hence, it is more realistic to optimize the mixing conditions for each resin.
Consequently, the objective functions and constraints were given by
Maximize: × (2)
Subjected to: ≤ ≤ (3)
Maximize: × (4)
Subjected to: ≤ ≤ (5)
in which Eqs. (2) and (3) are the objective function and constraint for mechanical properties, respectively while Eqs. (4) and (5) are for dynamic performance.
The optimization problem was solved by MS-EXCEL solver (generalized reduced gradient approach) [9]. Table 5 shows the optimized design variables and the corresponding expected mechanical and dynamic performance for each polyurethane resin. Regardless of resin types, as the resin proportion increases, the tensile
strength tends to be maximized. The mesh distribution, however, has a somewhat different effect on the mechanical properties. Also, their maximum values are somewhat different for each resin, which may result from the different adhesive characteristics of each resin. But, the dynamic performance exhibits quite different behavior from the mechanical properties; it has almost the same optimum variables for all resin types. It is inferred that the properties of the granule are most important for the dynamic performance while the resin functions simply to hold the granule in place.
From Table 5, the optimal design variables differ with the resin type and loading condition, and the corresponding mechanical and dynamic performances differ also greatly with the resin types. For further understanding these behaviors, the maximum mechanical and dynamic performances are plotted against the resin type as shown in Fig. 7. For convenience, the mechanical and dynamic performances are normalized by their maximum value in each resin type. The tensile strength has a somewhat adverse trend with resin types compared with the failure strain, and the layer with resin C has the most outstanding properties. However, the dynamic performance exhibits different behavior from the mechanical properties; the layer with resin C has the inferior performance, and the higher dynamic performance can be found in the layer with resin B.
Actually, when the engineers settle upon the mixing condition for the rubber granule layer on-site, it is almost impossible to simultaneously maximize the mechanical and dynamic performance. Therefore, they should determine which performance factor is of more importance. And they should also acknowledge that when the optimization problem is solved for any performance, the other performance level will be reduced. For this, decreases in performance factor are calculated and plotted in Fig. 8.
Here is the approximated factor obtained using the design variables when the optimization is performed for mechanical properties. Also, is the expected factor listed in Table 5. The dynamic performance is more sensitive to the design variables, leading to higher reductions overall. In contrast, the failure strain is rather increased when it is calculated by the design variables,
which are obtained by optimizing for dynamic performance. It is, therefore, desirable to optimize the dynamic performance when the optimal mixing conditions are needed on site.
0.4 0.6 0.8 1.0 1.2 1.4
0.4 0.6 0.8 1.0 1.2 1.4
D E B C Tensile Strength Rate Expected Mechanical Properties
Tensile Strength Rate, σu/σu max [%]
Polyurethane Resin Type A
Failure Strain Rate, εf/εf max [%]
Failure Strain Rate
(a) Mechanical properties
0.4
0.6 0.8 1.0 1.2 1.4
0.4 0.6 0.8 1.0 1.2 1.4 Force Reduction
Expected Dynamic Performance
Force Reduction Rate, FR/FR max [%]
Polyurethane Resin Type D E B C
A n [%VVate, VerRatiomoref Dtical]DD max
Vertical Deformation
(b) Dynamic performance [Fig. 7] Expected performance factor
20 40 60 80 100 120 140 160
A B C D E Force Reduction
Vertical Deformation Tensile Strength Failure Strain
Reduction in Performance Factor
Polyurethane Resin
Reduction in Performance
[Fig. 8] Reductions in performance factor
4. CONCLUSIONS
1. For in-plane loading, the adhesive characteristics are the dominating factor to improve the mechanical
properties. However, under out-of-plane loading, the resin may play a role only in holding the granules, and the properties of the rubber granules are the important factors determining the dynamic performance
2. Based on the design of experiments and the three design variables, response surfaces were constructed to optimize the mixing condition for the mechanical and dynamic performance of the rubber granule layer.
3. The optimization problem was formulated and solved separately for each resin, to maximize the mechanical and dynamic performance. The mechanical properties are mainly affected by the proportion and resin type. However, the dynamic performance is more sensitive to the design variables and more important to the performance of the rubber granule layer.
References
[1] International Association of Athletics Federations, Track and Field Facilities Manual, Editions EGC, 2003.
[2] Dixon SJ, Collop AC and Batt ME. Artificial playing surfaces research: A review of medical, engineering and biomechanical aspect. Med Sci Sports Exe, 1919-1926, 2000.
[3] Dixon SJ, Batt ME and Collop AC. Surface effects on ground reaction forces and lower extremity kinematics in running. Int J Sports Med, Vol. 20, pp.209-218, 1999.
[4] Korea Elastic Compound Pavement Industry Association, Elastic Compound Pavement System, Ver. 1, 2005 (in Korean)
[5] Nigg BM. External force measurements with sports shoes and playing surfaces. Biomechanical Aspects of Sport Shoes and Playing Surfaces, Calgary, Canada,:
University of Calgary, 1983.
[6] Nigg BM. The validity and relevance of tests used for the assessment of sports surfaces. Med Sci Sports Exe, Vol. 22, pp.131-139, 1990.
[7] KS Standard M6518-06. Physical test method for vulcanized rubber. Korea Standard Association, 2006 (in Korean)
[8] Park SH Modern Design of Experiment. Seoul, Korea; MinYoung Press, 2003 (in Korean)
[9] MicroSoft, Inc., Microsoft Office EXCEL 2003, User's Manual, 2003.
Ki-Weon Kang
[Regular member]• Feb. 2001 : Ph.D, Dept. of Mechanical Design and Production Engineering, Hanyang University
• Mar. 2008 : Chief Researcher, Korea Sport Science Institute
• Apr. 2008 ~ : Professor, Kunsan National University
<Research Interests>
Structural and fatigue analysis for composite materials
Seung-Pyo Lee
[Regular member]• Feb. 1994 : Master Dept. of Mechanical Design and Production Engineering, Hanyang University
• Mar. 1999 ~ : Ph.D candidate, Dept. of Mechanical Engineering, Hanyang University
<Research Interest>
Structural analysis, Fatigue