반응표면분석법을 이용한 Trimethylamine의 Static과 Dynamic Headspace 분석 방법 최적화
홍동리1․조성래2․유정완1․김소현1․김현재1․이양봉1
1부경대학교 식품공학과
2국립수산과학원 식품위생가공과
Optimization of Static and Dynamic Headspace Analyses of Trimethylamine Using Response Surface Methodology
Dong-Lee Hong
1, Sung-Rae Cho
2, Jeong-Wan Yu
1, So-hyun Kim
1, Hyeon-Jae Kim
1, and Yang-Bong Lee
11
Department of Food Science and Technology, Pukyong National University
2
Food Safety and Processing Research Division, National Institute of Fisheries Science
ABSTRACT Trimethylamine (TMA) is an index compound of fish smell in fishery products. The objective of this study is to optimize the static and dynamic headspace analyses with 200 μL direct injection and solid phase micro- extraction using response surface methodology. A fractional 4-level-3-factor experiment design which consists of 33 experimental trials and five replicates at nine center points was adopted to see the effect of independent values such as TMA concentration (2∼14 mg/100 g), sodium hydroxide concentration (5∼25%), temperature (4∼32°C), and time (3∼11 min) on the responses of isolated TMA amounts. Data were analyzed using SAS Statistical Software to get a second-order polynomial formula and the 3-dimensional graphs were drawn with Design-Expert Software. Regression coefficients (R
2) of direct injection and solid phase microextraction were 0.9816 and 0.9802, respectively. TMA contents between static and dynamic analyses showed a similar tendency. These results will provide basic information in measur- ing TMA contents in fish products.
Key words: trimethylamine, solid phase microextraction, headspace, response surface methodology
Received 11 July 2019; Accepted 17 July 2019
Corresponding author: Yang-Bong Lee, Department of Food Sci- ence and Technology, Pukyong National University, Busan 48513, Korea
E-mail: [email protected], Phone: +82-51-629-5829
Author information: Dong-Lee Hong (Researcher), Jeong-Wan Yu (Graduate student), So-hyun Kim (Researcher), Hyeon-Jae Kim (Graduate student), Yang-Bong Lee (Professor)
서 론
Trimethylamine(TMA)은 생선 비린내 고유의 주요 성분 으로 알려져 있으며(Heising 등, 2014; Howgate, 2010;
Huss, 1993), 해양생물이나 어패류에 있는 trimethylamine oxide(TMAO)가 TMAO 환원 효소에 의해 TMA로 전환되 어 생성된다고 알려져 있다. TMAO 환원 효소는 주로 해양 미생물에 존재하고 있는 효소인데,
Aeromonas
spp.,Psychrotolerant
,Enterobacteriaceae
,Photobacterium phosphoreum
,Shewanella putrefaciens
및Vibrio
spp.와 같은 미생물들이 주로 생산한다(Seibel과 Walsh, 2002;Gram과 Dalgaard, 2002). TMA의 함량은 어류의 신선도
저하에 따라 증가하는 형태를 띠고 있어 수산물의 신선도 지 수로서 자주 사용되고 있으며(Baixas-Nogueras 등, 2003), 식품공전(Korea Food & Drug Administration, 2012)에서 TMA의 초기 선도 부패 기준은 3.0 mg/100 g으로 알려져 있다.
최근에는 냉장 조건에서 보관된 생선 필렛에서 해양 미생 물이 영향을 끼치는 TMA 형성과 변화 과정에 대해 연구된 바가 있다(Gram과 Dalgaard, 2002). 또한 많은 연구를 통 해 어류 및 어류 가공 제품의 변화에 따른 TMA의 변화는 제품의 상태를 판가름하는 데에 밀접한 연관이 있다고 알려 져 있다(Egashira 등, 1990; Dyer, 1945; Malle와 Poumey- rol, 1989). 이와 마찬가지로 어류에 존재하는 TMAO를 측 정하여 신선도를 측정하고자 하는 시도가 있었으나, TMA의 전구체인 TMAO는 신선도와 밀접한 관련이 없다는 문제로 인해 지표로는 사용하기 어렵다고 보고된 바 있다(Baixas- Nogueras 등, 2003).
최근까지 공인된 TMA 분석법 중 하나인 황산 흡수법은 저농도의 TMA만 분석이 가능하며 전처리 과정 중 시료에서 TMA를 완전히 분리하는 것이 어렵다는 단점이 있다(Erupe
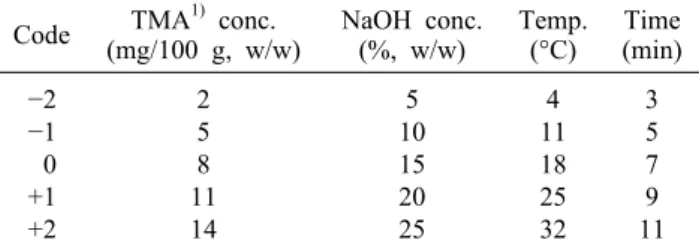
Table 1. Coded value of central composite design for response
surface analysisCode TMA1) conc.
(mg/100 g, w/w) NaOH conc.
(%, w/w) Temp.
(°C) Time (min)
−2
−1 0 +1 +2
2 5 8 11 14
5 10 15 20 25
4 11 18 25 32
3 5 7 9 11
1)Trimethylamine.
등, 2011). 또한 식품공전(Korea Food & Drug Adminis- tration, 2012)에 기술되어 있는 산성 여과지법은 현장에서 즉시 조작이 가능한 간단한 방법으로 알려져 있으나, 이 방 법은 TMA의 농도가 ppm 이상의 단위일 경우에만 사용이 가능한 방법이다. 현재 가장 많이 사용되고 있는 방법은 고 성능 액체 크로마토그래피(high performance liquid chro- matography, HPLC)와 가스 크로마토그래피(gas chroma- tography, GC)이며, 이를 이용한 연구들이 많이 나오고 있 다. TMA는 상온에서 기체로 존재하며 알칼리성 용액에서 더 쉽게 휘발되는 특징을 지니고 있으므로(Ruiz-Capillas와 Horner, 1999; Shim과 Baek, 2012) 기체 상태를 유지하는 TMA를 측정하기 위해서 본 연구에서는 GC를 이용하여 TMA를 분석하는 데 있어서의 최적 조건을 찾고자 하였다.
GC를 활용한 분리 방법 중 하나는 특정 화합물을 분리하 는 static(정적) 방법이 있으며 본 연구에서 사용할 방법은 시료 채취병의 headspace에서 가스 샘플을 직접 채취 분석 하는 direct injection법과 solid phase microextraction (SPME)을 활용한 분석법 두 가지 방법을 사용하였다. Direct injection 방법에는 기밀식 주사기를 사용하여 샘플의 손실 을 최소화하였으며, SPME의 경우 저농도 기체 시료(e.g.
sub-nmol mol-1 level)를 분석하는 데 용이한 방법으로 알 려져 있다(Pandey와 Kim, 2009). SPME의 장점으로는 일 반적으로 사용하는 유기 용매를 사용하지 않고 분석을 수행 할 수 있으며, 추출 가능한 시료가 SPME의 fiber에 따라 선택할 수 있다는 점이 있다.
한편 중심합성계획법(central composite design, CCD) 은 반응표면분석법을 위한 실험 설계 디자인 중의 하나이며 주로 독립변수가 종속변수에 미치는 영향을 보고 최적 조건 을 설정하는 데 사용되는 방법이다(Diniz와 Martin, 1996).
TMA의 분석에 영향을 주는 독립변수로는 추출용매의 종 류, 용매의 농도와 시간, 추출 온도와 시간 등이 있다. 따라서 본 연구에서는 추출용매로 sodium hydroxide를 선택하였 고 추출용매의 농도와 시간, 온도 및 TMA의 농도를 독립변 수로 선정하였다. 또한 CCD로 반응표면분석법을 설정하고 static 방법과 dynamic headspace법을 통해 TMA의 분석 을 최적화하고 어패류 제품의 비린내에 관한 향후 연구를 위하여 두 가지 분석방법을 제시하여 비교하고자 하였다.
재료 및 방법
반응표면분석법을 이용한 실험 설계
TMA와 sodium hydroxide의 농도, 추출 시간과 온도를 4개의 독립 요인으로 선정하였고 central composite의 실 험점은 중앙점(0.0, center point), ±1, ±2 level점(facto- rial point)에 따라 각 요인의 설정된 범위를 설정하였으며 Table 1에 나타냈다. 실험에 사용된 TMA 시료 용액은 30%
TMA(Junsei Chemical Co., Ltd., Tokyo, Japan) 용액을 3차 증류수로 희석하여 2~14%의 농도로 희석해 사용하였
다. TMA는 특히 알칼리 조건 하에서 쉽게 휘발되는 특성을 지니고 있어(Bir와 Tutin, 2002) 5~25% sodium hydrox- ide(Junsei Chemical Co., Ltd.)를 추출용매로 사용하였으 며 추출되는 온도와 시간을 각각 4~32°C, 3~11분으로 하 였다. 각 요인별 실험 설계는 Table 2와 같으며 총 33번의 실험을 3회 반복하여 측정하였다.
TMA 시료 준비
TMA 표준용액은 30% TMA에 3차 증류수를 이용하여 2~14 mg/100 g으로 희석하여 제조하였다. 다양한 농도의 TMA 용액을 45 mL amber vial bottle(27010-U, Supelco, Santa Clara, CA, USA)에 넣고 septa(tan PTFE/silicone, 23193-U, Supelco)로 밀봉하였다. 시료의 손실을 방지하 기 위하여 sodium hydroxide를 5 mL syringe(JS5, Jung- lim, Busan, Korea)에 넣은 후 septa를 통해 천천히 벽을 타고 주입하였다. 이후 실험 설계대로 지정된 온도와 시간을 방치하여 GC-FID(GC-6890N, Agilent Technologies, Santa Clara, CA, USA)를 통해 분석을 진행하였다.
Static headspace와 SPME
Static headspace법에서 headspace로부터 TMA를 수 집하는 데 사용된 syringe는 gas tight syringe(Sample- Lock syringe 1725SL, HamiltonⓇ, Bonaduz, Switzer- land)로 200 μL의 TMA headspace를 추출한 후 GC에 주입 하여 분석을 실시하였다. SPME를 사용한 경우에는 휘발성 아민 화합물만을 흡착하는 fiber인 polydimethylsiloxane divinylbenzene 65 μm thickness(Lee 등, 2013)를 45 mL amber vial bottle의 headspace에 넣고 15분간 흡착을 하 고 GC의 주입구에서 10분간 탈착시켜 분석을 진행하였으며 GC의 분석 조건은 Table 3에 나타냈다.
통계분석
반응표면분석법에 사용한 설계는 Sumaya-Martínez 등 (2005)에 의하여 설계된 방법을 사용하였으며, 통계분석은 SAS 9.4 for Windows(ver. 9.4, SAS Institute, Cary, NC, USA)로 실시하였다. 유의 수준을 0.05로 설정하여 유의적 인 차이를 분석하였으며, 통계분석을 통하여 얻은 독립변수 간의 관계에 대한 수식을 Design-expertⓇ software(DES,
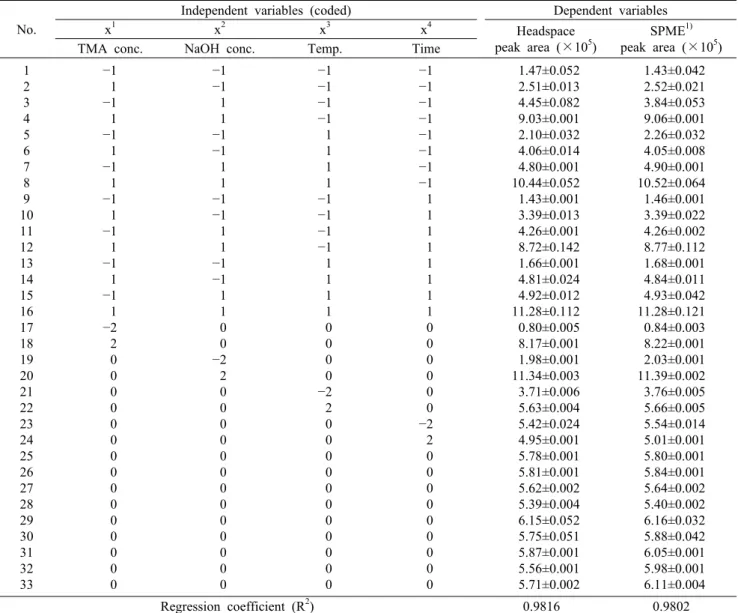
Table 2. Central composite design matrix and response of dependent variable
No.Independent variables (coded) Dependent variables
x1 x2 x3 x4 Headspace
peak area (×105)
SPME1) peak area (×105) TMA conc. NaOH conc. Temp. Time
1 2 3 4 5 6 7 8 9 10 11 12 13 14 15 16 17 18 19 20 21 22 23 24 25 26 27 28 29 30 31 32 33
−1 1
−1 1
−1 1
−1 1
−1 1
−1 1
−1 1
−1 1
−2 2 0 0 0 0 0 0 0 0 0 0 0 0 0 0 0
−1
−1 1 1
−1
−1 1 1
−1
−1 1 1
−1
−1 1 1 0 0
−2 2 0 0 0 0 0 0 0 0 0 0 0 0 0
−1
−1
−1
−1 1 1 1 1
−1
−1
−1
−1 1 1 1 1 0 0 0 0
−2 2 0 0 0 0 0 0 0 0 0 0 0
−1
−1
−1
−1
−1
−1
−1
−1 1 1 1 1 1 1 1 1 0 0 0 0 0 0
−2 2 0 0 0 0 0 0 0 0 0
1.47±0.052 2.51±0.013 4.45±0.082 9.03±0.001 2.10±0.032 4.06±0.014 4.80±0.001 10.44±0.052 1.43±0.001 3.39±0.013 4.26±0.001 8.72±0.142 1.66±0.001 4.81±0.024 4.92±0.012 11.28±0.112 0.80±0.005 8.17±0.001 1.98±0.001 11.34±0.003 3.71±0.006 5.63±0.004 5.42±0.024 4.95±0.001 5.78±0.001 5.81±0.001 5.62±0.002 5.39±0.004 6.15±0.052 5.75±0.051 5.87±0.001 5.56±0.001 5.71±0.002
1.43±0.042 2.52±0.021 3.84±0.053 9.06±0.001 2.26±0.032 4.05±0.008 4.90±0.001 10.52±0.064 1.46±0.001 3.39±0.022 4.26±0.002 8.77±0.112 1.68±0.001 4.84±0.011 4.93±0.042 11.28±0.121 0.84±0.003 8.22±0.001 2.03±0.001 11.39±0.002 3.76±0.005 5.66±0.005 5.54±0.014 5.01±0.001 5.80±0.001 5.84±0.001 5.64±0.002 5.40±0.002 6.16±0.032 5.88±0.042 6.05±0.001 5.98±0.001 6.11±0.004
Regression coefficient (R2) 0.9816 0.9802
1)Solid phase microextraction.
Table 3. Condition of gas chromatography
Equipment Direct injection & SPME
GC-FID
Oven condition Gas flow Column
Inlet & detector temp.
50°C (10 min) → 10°C/min → 150°C (10 min) N2: 6.5 mL/min, H2: 30 mL/min, Air: 300 mL/min DB-5 (30 m×0.25 mm×0.25 μm, Agilent Technologies)
250°C
ver. 11, State-Ease Inc., Minneapolis, MN, USA)를 이용 하여 3차원 그래프를 그림으로 나타냈다.
결과 및 고찰
Static headspace와 SPME를 이용한 TMA 분석
Table 2에 따르면 4개의 독립 요인이 다섯 단계로 나뉘어 33번의 실험이 시행되었으며, 9개의 중심점이 설계되었고 headspace 및 SPME peak 면적이 0.80~11.34(×105)와
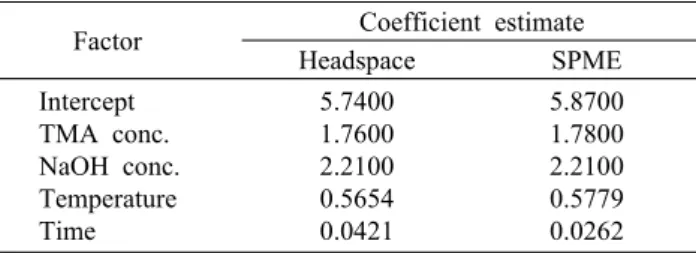
0.84~11.39(×105)로 측정되었다. 실험 결과는 headspace 와 SPME 두 가지의 종속변수로 나타냈으며, 0.9816과 0.9802의 높은 회귀 계수(R2)를 보여주었고 각각 3회 반복 실험을 실시하였다. Table 4에서 볼 수 있듯이 회귀 계수는 TMA와 NaOH 농도가 가장 뚜렷한 선형 형태를 띠었으며 영향력이 높은 변수임을 보여주었다. TMA 분석의 종속변 수는 반응표면분석법을 사용하여 Table 5에 나타냈으며, headspace법에서의 TMA 평균은 5.17×10⁵ peak 면적이 나왔으며, 최고 peak 면적은 TMA 농도가 8 mg/100 g,
Table 4. Coefficients in terms of coded factors
Factor Coefficient estimateHeadspace SPME Intercept
TMA conc.
NaOH conc.
Temperature Time
5.7400 1.7600 2.2100 0.5654 0.0421
5.8700 1.7800 2.2100 0.5779 0.0262
A B
C D
E F
Fig. 1. Three-dimensional plots on effect of headspace peak area at two other factors.
Table 5. Result of statistical analyses for dependent variables
of trimethylamineResponse surface
for variable Headspace
(peak area×105) SPME (peak area×105) Response mean
Root MSE1) R2
Coefficient of variation
5.17 0.48 0.98 9.30
5.24 0.50 0.98 9.56
1)MSE: mean square error.
NaOH의 농도는 25%, 추출 온도가 18°C, 추출 시간이 7분 이었을 때 가장 높은 peak 면적인 11.34×10⁵으로 측정되었 다. SPME법의 경우 평균 TMA peak 면적은 5.24×10⁵이며
headspace법과 동일한 추출 조건에서 11.39×10⁵으로 가 장 높은 peak 면적을 나타냈다.
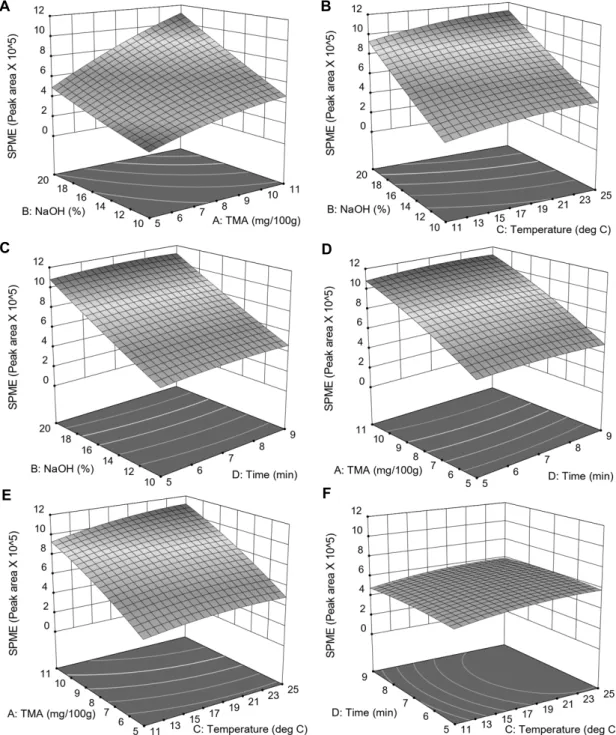
A B
C D
E F
Fig. 2. Three-dimensional plots on effect of SPME peak area at two other factors.
DES를 이용한 3차원 그래프
Fig. 1과 2는 다음의 회귀식(equation, Eq)을 사용하여 두 가지 요인의 효과에 대한 3차원 그래프를 나타냈다.
Headspace(Eq.1)=-249835+15177x1-19751x2+10176 x3+48691x4-4285.108025x1x1+4970.833333x1x2+ 632.361111x2x2+1407.738095x3x1+369.642857x3x2- 692.672902x3x3+1864.583333x4x1-218.750000x4x2 +861.607143x4x3-5266.493056x4x4. SPME(Eq.2)=-
341810+19375x1-16104x2+14048x3+56657x4- 4584.490741x1x1+5029.166667x1x2+529.583333x2x2
+1342.261905x3x1+358.928571x3x2-750.212585x3x3 +1968.750000x4x1-331.250000x4x2+727.678571x4x3
-5658.854167x4x4. 3차원 반응 표면을 통한 결과에는 두 가지 요인이 고정되었고(TMA 농도=8%, NaOH 농도=15
%, 온도=18°C, 시간=7분) 다른 두 가지 독립 요인을 대상으 로 한 결과를 나타냈으며, Eq.1과 2는 DES 프로그램을 통해 Table 2로부터 회귀식을 얻어 사용하였다. Headspace법을 이용한 3차원 그래프를 나타낸 Fig. 1에서는 NaOH와 TMA 의 농도가 큰 영향을 미치며, 특히 Fig. 1A, 1B, 1C에서 NaOH의 농도가 다른 독립변수인 온도와 시간보다 효과적
인 TMA 추출을 일으키는 것을 알 수 있다. 반면, Fig. 1F를 보면 온도와 시간은 TMA의 추출에 눈에 띄는 영향을 미치 지 않는 것으로 판단된다. 이와 마찬가지로 SPME법에 대한 3차원 그래프는 Fig. 2에 나타냈으며 headspace법과 유사 한 형태의 그래프를 보여주고 있다.
요 약
본 연구에서는 생선 비린내의 주요 성분 중 하나인 trime- thylamine 분석방법을 반응표면분석법을 사용하여 최적의 분석 조건을 설계하였다. Sodium hydroxide를 통해 head- space에서의 직접 분석과 SPME를 이용한 두 가지 방안을 제시하였으며, sodium hydroxide의 농도가 TMA를 head- space에 휘발시키는 데 중요한 요인으로서 분석에 필수 요 소인 것을 알 수 있었으며, 온도와 시간 또한 어느 정도 영향 을 주는 요인으로 판단된다. 추후 본 연구를 통해 신선도를 평가하는 TMA 분석에 신뢰도 높은 결과를 활용할 수 있을 것으로 판단된다.
감사의 글
이 논문은 2017학년도 부경대학교 연구년 교원 지원 사업에 의하여 연구되었음.
REFERENCES
Baixas-Nogueras S, Bover-Cid S, Veciana-Nogués T, Nunes ML, Vidal-Carou MC. Development of a quality index meth- od to evaluate freshness in Mediterranean hake (Merluccius
merluccius). J Food Sci. 2003. 68:1067-1071.
Bir D, Tutin K. Quantitation of trimethyl amine by headspace gas chromatography-mass spectrometry using a base- modi- fied column. J Chromatogr Sci. 2002. 40:337-342.
Diniz FM, Martin AM. Use of response surface methodology to describe the combined effects of pH, temperature and E/S ratio on the hydrolysis of dogfish (Squalus acanthias) muscle.
Int J Food Sci Technol. 1996. 31:419-426.
Dyer WJ. Amines in fish muscle: Ⅰ. Colorimetric determination of trimethylamine as the picrate salt. J Fish Res Board Can.
1945. 6:351-358.
Egashira M, Shimizu Y, Takao Y. Trimethylamine sensor based on semiconductive metal oxides for detection of fish fresh- ness. Sensor Actuat B-Chem. 1990. 1:108-112.
Erupe ME, Viggiano AA, Lee SH. The effect of trimethylamine on atmospheric nucleation involving H2SO4. Atmos Chem Phys. 2011. 11:4767-4775.
Gram L, Dalgaard P. Fish spoilage bacteria-problems and solutions. Curr Opin Biotechnol. 2002. 13:262-266.
Heising JK, van Boekel MAJS, Dekker M. Mathematical models for the trimethylamine (TMA) formation on packed cod fish fillets at different temperatures. Food Res Int. 2014. 56:272- 278.
Howgate P. A critical review of total volatile bases and trime- thylamine as indices of freshness of fish. Part 1. Determina- tion. Electron J Environ Agric Food Chem. 2010. 9:29-57.
Huss HH. Assurance of seafood quality. FAO Fisheries Techni- cal Paper. No. 334. Rome, Italy. 1993.
Korea Food & Drug Administration. Korean air pollution proc- ess test method. Seoul, Korea. 2012. p 45-158.
Lee SH, Park YS, Park YK, Choi WG, Park BS, Kim TO. Com- parative study of efficiency according to the method of sam- pling and analyzing trimethylamine in the ambient by SPME method. J Korean Soc Odor Res Eng. 2013. 12:51-57.
Malle P, Poumeyrol M. A new chemical criterion for the quality control of fish: trimethylamine/total volatile basic nitrogen (%). J Food Prot. 1989. 52:419-423.
Pandey SK, Kim KH. Comparative analysis of odorous volatile organic compounds between direct injection and solid-phase microextraction: Development and validation of a gas chro- matography-mass spectrometry-based methodology. J Chro- matogr A. 2009. 1216:5436-5444.
Ruiz-Capillas C, Horner WFA. Determination of trimethylamine nitrogen and total volatile basic nitrogen in fresh fish by flow injection analysis. J Sci Food Agric. 1999. 79:1982-1986.
Seibel BA, Walsh PJ. Trimethylamine oxide accumulation in marine animals: relationship to acylglycerol storage. J Exp Biol. 2002. 205:297-306.
Shim JE, Baek HH. Determination of trimethylamine in spinach, cabbage, and lettuce at alkaline pH by headspace solid-phase microextraction. J Food Sci. 2012. 77:C1071-C1076.
Sumaya-Martínez T, Castillo-Morales A, Favela-Torres E, Huerta- Ochoa S, Prado-Barragán LA. Fish protein hydrolysates from gold carp (Carassius auratus): Ⅰ. A study of hydrolysis pa- rameters using response surface methodology. J Sci Food Agric. 2005. 85:98-104.