Received:January 6, 2017, Revised:February 24, 2017, Accepted:April 12, 2017
Corresponding to:Young Ho Lee, Division of Rheumatology, Department of Internal Medicine, Korea University Medical Center, Korea University College of Medicine, 73, Inchon-ro, Seongbuk-gu, Seoul 02841, Korea. E-mail:[email protected]
Copyright ⓒ 2017 by The Korean College of Rheumatology. All rights reserved.
This is a Free Access article, which permits unrestricted non-commerical use, distribution, and reproduction in any medium, provided the original work is properly cited.
Meta-analysis of Circulating Adiponectin, Visfatin, and
Ghrelin Levels in Patients with Systemic Lupus Erythematosus
Young Ho Lee, Gwan Gyu Song
Division of Rheumatology, Department of Internal Medicine, Korea University Medical Center, Korea University College of Medicine, Seoul, Korea
Objective. To evaluate the association between circulating adiponectin, visfatin, and ghrelin levels and systemic lupus eryth- ematosus (SLE). Methods. We conducted a meta-analysis to compare serum/plasma adiponectin, visfatin, and ghrelin levels in patients with SLE to those of healthy controls. Results. Eleven articles (822 patients with SLE and 676 controls) were included in the meta-analysis. The meta-analysis showed that the adiponectin level was significantly higher in the SLE group than in the control group (standardized mean difference [SMD]=0.360, 95% confidence interval [CI]=0.025∼0.695, p=0.035).
Stratification according to region showed that high adiponectin levels were associated with SLE in the Western population (SMD=0.225, 95% CI=0.024∼0.426, p=0.028), but not in the South American population. A subgroup analysis that adipo- nectin level is significantly higher in the SLE group than in the control after adjustment for age, sex, body mass index, large sam- ple size (n>100); and mean age>40 years (SMD=0.492, 95% CI=0.065∼0.920, p=0.024; SMD=0.492, 95% CI=0.065∼
0.920, p=0.024; SMD=0.429, 95% CI=0.124∼0.733, p=0.006, respectively). Stratification by region showed significantly increased visfatin and ghrelin levels in the SLE group in Western and South American populations. Conclusion. Our meta-analy- sis demonstrated that circulating adiponectin, visfatin, and ghrelin levels are significantly higher in SLE. (J Rheum Dis 2017;24:
99-107)
Key Words. Adiponectin, Visfatin, Ghrelin, Systemic lupus erythematosus
INTRODUCTION
Systemic lupus erythematosus (SLE) is a prototypic au- toimmune disease characterized by B cell hyperactivity, a high level of autoantibody production, immune-complex deposition, and multiple organ damage [1]. The accumu- lation of self-antigens due to impaired clearance facili- tates autoimmune responses and subsequent inflammation with high levels of inflammatory cytokines in SLE [2].
Adipose tissues form an endocrine organ that regulates immune processes and inflammation by secreting bio- active mediators called adipokines [3]. Adipokines, in- cluding adiponectin and visfatin, have been reported to play important roles in the pathogenesis of autoimmune and inflammatory diseases [3]. Adiponectin is a 30-kDa plasma protein produced mainly by adipocytes/macro-
phages; it is structurally similar to complement compo- nent C1q and function as an anti-inflammatory and pro-in- flammatory factor [4]. Adiponectin inhibits pro-inflam- matory cytokines such as tumor necrosis factor (TNF)-α and interleukin (IL)-6, and adhesion molecules, and it is involved in the modulation of inflammatory responses.
However, adiponectin also has pro-inflammatory effects on various cells in the immune system [5]. Adiponectin can increase the production of IL-6 and metalloproteinases (MMPs) from endothelial cells and monocytic cells [6].
Adiponectin may play a role as an enhancer of the in- flammatory response in the process of immune response and inflammation [7]. Visfatin is an adipokine secreted by visceral adipose tissue as well as macrophages and neutrophils, and it was initially known as a pre-B-cell col- ony-enhancing factor that enhances the differentiation of
B-cell precursors [8]. Visfatin is a pro-inflammatory cyto- kine, which induces the production of TNF-α, IL-1, IL-6, IL-8, and MMPs [9]. Ghrelin is a growth hormone-releas- ing peptide secreted from the stomach, and it induces the release of the growth hormone [10]. Ghrelin is not a adi- pokine, but has a regulatory effect within the immune system, as it is mutually expressed with leptin. Ghrelin exerts multiple immunoregulatory effects by antagoniz- ing leptin [11].
Studies on circulating adiponectin, visfatin, and ghrelin levels in patients with SLE compared to healthy controls have shown mixed results [12-22]. The reasons for such disparity may be the small sample size, low statistical power, and/or clinical heterogeneity [23-25]. To over- come the limitations of individual studies and resolve these inconsistencies, we performed a meta-analysis. The present study aimed to compare the serum/plasma adi- ponectin, visfatin, and ghrelin levels in patients with SLE compared to those in healthy controls.
MATERIALS AND METHODS
Identification of eligible studies and data extraction
We performed a literature search for studies that exam- ined serum/plasma adiponectin, visfatin, and ghrelin lev- els in patients with SLE and healthy controls. We searched the PubMed, EMBASE, and Cochrane databases to identi- fy all available and relevant past articles (until May 2016).
The following keywords and subject terms were used in the search: “adiponectin level,” “visfatin,” “ghrelin,” “sys- temic lupus erythematosus,” and “SLE.” All references cited in the articles were reviewed to identify additional studies not found in the aforementioned electronic databases. Studies were considered eligible if (1) they were case-control studies; and (2) they provided data on adiponectin, visfatin, or ghrelin levels in healthy controls and patients diagnosed as having SLE according to the American College of Rheumatology classification criteria [26]. No language restriction was applied. Studies were excluded if (1) they contained overlapping or insufficient data or (2) they were reviews. Data on methods and re- sults were extracted from original studies by two in- dependent reviewers. Discrepancies between the re- viewers were resolved by consensus. The meta-analysis was conducted in accordance with Preferred Reporting Items for Systematic Reviews and Meta-Analyses (PRISMA) guidelines [27]. The following information was extracted
from each study article: primary author; year of pub- lication; country; study region; number of subjects; age;
patients’ disease duration; patients’ body mass index (BMI); adjustment for age, sex or BMI; and mean and standard deviation (SD) of adiponectin, visfatin, and ghrelin levels. When the data were presented as medians, interquartile ranges, or ranges, we computed the mean and SD using previously described formulae [28,29]. We scored the quality of each study included in the meta-analysis based on the Newcastle-Ottawa Scale [30].
Scores ranging from 6∼9, with 9 being the highest score possible, indicated high methodological quality.
Evaluation of statistical associations
We performed a meta-analysis to examine the associa- tion between adiponectin, visfatin, and ghrelin levels and SLE. Results are presented as standardized mean differ- ences (SMDs) and 95% confidence intervals (CIs). SMDs were calculated by dividing the mean difference between the two groups using the pooled SD, and they were used when different scales were integrated to measure the same concept. This measure compares case and control arms in terms of standardized scores. The magnitudes of the SMD were as follows: 0.2∼0.5, small effect; 0.5∼0.8, medium effect; and ≥0.8, large effect [31]. We assessed within-study and between-study variations and hetero- geneities using the Cochran Q statistic [32]. The hetero- geneity test was used to assess the null hypothesis that all studies were evaluating the same effect. When a sig- nificant Q statistic (p<0.10) indicated heterogeneity across the studies, the random effects model was used in the meta-analysis [33]. When no heterogeneity was found, the fixed effects model was used. The fixed effects model assumed that all studies estimated the same un- derlying effect, and it only considered within-study varia- tion [32]. We quantified the effect of heterogeneity using the following equation: I2=100%×(Q−df)÷Q [34], where I2 measured the degree of inconsistency between studies and Q indicated whether the percentage total var- iation across the studies was due to heterogeneity rather than chance. I2 ranged between 0% and 100%; I2 values of 25%, 50%, and 75% were considered low, moderate, and high estimates, respectively [34]. Statistical manipulations were performed using the Comprehensive Meta-Analysis program (Biostat, Englewood, NJ, USA).
Evaluation of heterogeneity and publication bias
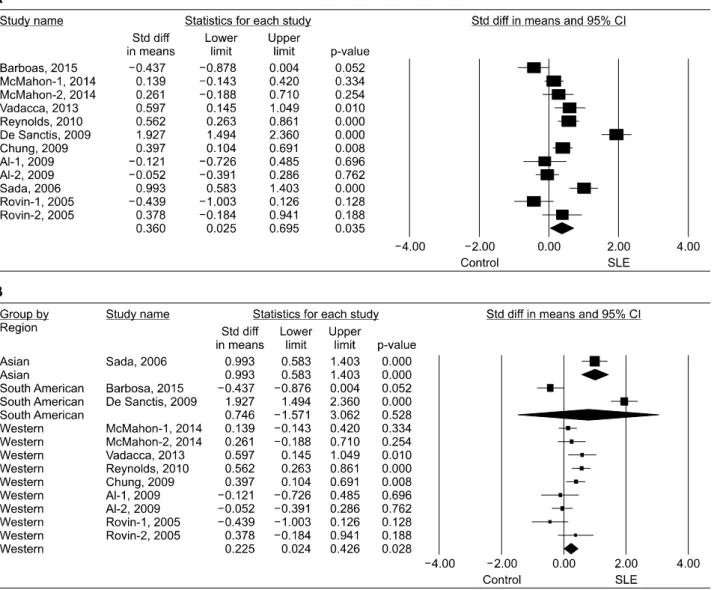
To examine potential sources of heterogeneity observedFigure 1. Meta-analysis of the relationship between adiponectin and systemic lupus erythematosus (SLE) in all study subjects (A) and each study region (B). Std diff: standardized difference, CI: confidence interval.
in the meta-analysis, meta-regression analysis was per- formed using the following variables: study region; ad- justment for age, sex, or BMI; mean age; sample size; and type of data. Funnel plots are often used to detect pub- lication bias. However, because of the limitations of fun- nel plotting, which requires studies with a range of sizes that involve subjective judgments, publication bias was evaluated using the Egger linear regression test [35], which measures funnel plot asymmetry using a natural logarithm scale of odds ratios.
RESULTS
Studies included in the meta-analysis
We identified 117 relevant studies using electronic and
manual search methods. Sixteen studies were selected for full-text review based on the title and abstract, but five of these were excluded because they were a review or had no data on the adipokine levels. Finally, 11 articles met the inclusion criteria for this meta-analysis (Figure 1) [12-22].
Three of the eligible studies included data on two differ- ent groups [13,18,20] that were treated independently.
Therefore, 14 comparison studies were considered in the meta-analysis, which included 822 patients with SLE and 676 controls (Table 1). Twelve studies examined the adi- ponectin levels, three assessed the visfatin levels, and four examined the ghrelin levels in SLE and control groups (Table 1). The quality assessment score of each study ranged between 6 and 9, and all the studies had a quality score ≥6 (Table 1). Table 1 shows the character-
Table 1. Characteristics of individual studies included in the meta-analysis StudyCountryPatientAge, yrBMI, kg/m2 Disease duration, yrAdipokinesAdjustment* Quality score SLEControlSLEControlSLEControl Barbosa, 2015 [12]Brazil523333.4±9.4 32.5±10.523.8±3.521.8±2.57.5AAge8 McMahon-1, 2014 [13]USA14272 39.6±13.5 40.5±11.825.7±5.923.7±5.111.4±8.0AAge7 McMahon-2, 2014 [13]USA6128 51.9±10.2 54.6±10.128.0±7.125.3±5.814.9±11.4AAge7 Vadacca, 2013 [14]Italy6029 42.26±40.54 45.69±11.5725.2±424±4.610±5AAge, gender, BMI9 Reynolds, 2010 [15]USA11971 42.6±41.3 41.3±11.925.9±6.324.8±5.3NAAAge, gender, BMI8 De Sanctis, 2009 [16]Venezuela606036±6 32±1224±2.722±2.0NAA, V, GNA6 Chung, 2009 [17]USA10978 40.2±11.5 40.5±12.029.2±7.527.0±6.08.2±7.3A, VAge, gender9 Al-1, 2009 [18]Canada212114.43±2.2010.04±3.4824.07±3.57NANAA, GGender7 Al-2, 2009 [18]Canada845614.32±2.6710.04±3.4823.76±5.30NANAA, GGender7 Sada, 2006 [19]Japan3780 44±1544±622.1±3.522.2±3.29.4±7.1AAge, gender, BMI8 Rovin-1, 2005 [20]USA1839 47.9±7.21 33.5±10.632.6±6.3625.9±5.09NAANA6 Rovin-2, 2005 [20]USA1839 34.6±7.64 33.5±10.629.5±10.6225.9±5.09NAANA6 Ozgen, 2011 [21]Turkey2629 34.2±11.0 38.0±10.323.2±4.425.9±4.73.8±3.9VBMI7 Kim, 2010 [22]Korea158034.6±6.727.4±6.6NANA47.41±33.66† GGender, BMI8 Values are presented as number and mean±standard deviation. SLE: systemic lupus erythematosus, BMI: body mass index, NA: not available, A: adiponectin, V: visfatin, G: ghrelin, USA: United States of America.*Matched or similar factors, or no statistical difference in variables between the SLE and control groups, † months.
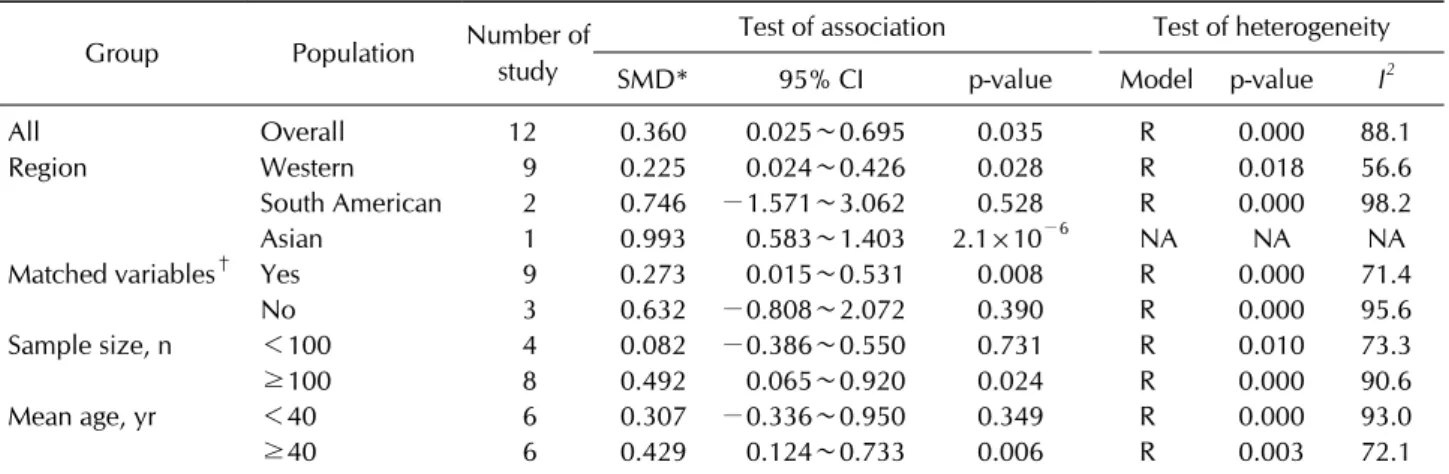
Table 2. Meta-analysis of the adiponectin levels in patients with SLE compared to healthy controls Group Population Number of
study
Test of association Test of heterogeneity
SMD* 95% CI p-value Model p-value I2
All Overall 12 0.360 0.025∼0.695 0.035 R 0.000 88.1
Region Western 9 0.225 0.024∼0.426 0.028 R 0.018 56.6
South American 2 0.746 −1.571∼3.062 0.528 R 0.000 98.2
Asian 1 0.993 0.583∼1.403 2.1×10⁻⁶ NA NA NA
Matched variables† Yes 9 0.273 0.015∼0.531 0.008 R 0.000 71.4
No 3 0.632 −0.808∼2.072 0.390 R 0.000 95.6
Sample size, n <100 4 0.082 −0.386∼0.550 0.731 R 0.010 73.3
≥100 8 0.492 0.065∼0.920 0.024 R 0.000 90.6
Mean age, yr <40 6 0.307 −0.336∼0.950 0.349 R 0.000 93.0
≥40 6 0.429 0.124∼0.733 0.006 R 0.003 72.1
SLE: systemic lupus erythematosus, SMD: standard mean difference, CI: confidence interval, R: random effects model, NA: not available. *Magnitude of the Cohen's d effect size (SMD) (0.2∼0.5, small effect; 0.5∼0.8, medium effect; and ≥0.8, large effect),
†age, sex, or body mass index.
istic features of each study, including the study pop- ulation and quality score.
Meta-analysis of circulating adiponectin levels in patients with SLE compared to healthy controls
Results of the meta-analysis showed that the adipo- nectin level was significantly higher in the SLE group than in the control group (SMD=0.360, 95% CI=0.025∼
0.695, p=0.035) (Table 2, Figure 1). Stratification accord- ing to region showed that high adiponectin levels were as- sociated with SLE in the Western population (SMD=0.225, 95% CI=0.024∼0.426, p=0.028), not in the South American population (SMD=0.746, 95% CI=−1.571∼
3.062, p=0.528) (Table 2, Figure 1). One study indicated that high adiponectin levels were associated with SLE in the Asian population (SMD=0.993, 95% CI=0.583∼
1.403, p=2.1×10⁻⁶) (Table 2, Figure 1). A meta-analysis was also performed on patients with SLE in each group based on adjustment, sample size, and mean age. Meta-ana- lysis of studies adjusted for age, sex, or BMI showed that the adiponectin level was significantly higher in the SLE group than in the control group (SMD=0.273, 95%
CI=0.015∼0.531, p=0.008) (Table 2). Results of the group analysis by sample size showed a significantly higher adiponectin level in the SLE group of studies with a large sample size (n>100) (SMD=0.492, 95%
CI=0.065∼0.920, p=0.024), not in that with a small sample size (n≤100) (SMD=0.082, 95% CI=−0.386∼
0.550, p=0.731) (Table 2). Stratification according to mean age showed a significantly higher adiponectin level in the SLE group of studies with mean age >40 years, not
in that with mean age ≤40 years (Table 2).
Meta-analysis of the circulating visfatin and ghre- lin levels in patients with SLE compared to the healthy controls
The visfatin level was marginally higher in the SLE group than in the control group (SMD=0.451, 95% CI=
−0.000∼0.903, p=0.050) (Table 3). Stratification ac- cording to region showed a significantly increased visfa- tin level in the SLE group that included the Western and South American populations (SMD=0.365, 95% CI=0.072
∼0.658, p=0.015; SMD=0.892, 95% CI=0.517∼1.267, p=3.2×10⁻⁶) (Table 3, Figure 2). One study showed no association between the visfatin level and SLE in the Middle Eastern population (Table 3). Results of the meta-analysis showed no association between the ghrelin levels and SLE (SMD=0.611, 95% CI=−0.383∼1.605, p=0.228) (Table 3). Further, stratification according to region showed that the ghrelin level was higher in the SLE group than in the control group of Western and South American populations (SMD=0.560, 95% CI=0.258∼
0.861, p=2.7×10⁻⁴; SMD=2.000, 95% CI=1.562∼
2.438, p<1.0×10⁻⁸) (Table 3, Figure 2). However, one study showed no association between the ghrelin levels and SLE in the Asian population (Table 3, Figure 2).
Systematic review of relationship between adipo- kine levels and cardiovascular disease/renal in- volvement in SLE
Circulating adiponectin was found to correlate with vas- cular strain (r=0.28, p=0.039) and negatively correlate
Figure 2. Meta-analysis of the relationship between visfatin (A) or ghrelin (B) levels and systemic lupus erythematosus (SLE) in each study region. Std diff: standardized difference, CI: confidence interval.
Table 3. Meta-analysis of visfatin and ghrelin levels in patients with SLE compared to healthy controls Group Population Number of
study
Test of association Test of heterogeneity
SMD* 95% CI p-value Model p-value I2
Visfatin Overall 3 0.451 −0.000∼0.903 0.050 R 0.018 75.2
Western 1 0.365 0.072∼0.658 0.015 NA NA NA
South American 1 0.892 0.517∼1.267 3.2×10⁻⁶ NA NA NA
Middle Eastern 1 0.025 −0.505∼0.554 0.927 NA NA NA
Ghrelin Overall 4 0.611 −0.383∼1.605 0.228 R 0.000 94.3
Western 2 0.560 0.258∼0.861 2.7×10⁻⁴ F 0.170 46.9
South American 1 2.000 1.562∼2.438 <1.0×10⁻⁸ NA NA NA
Asian 1 −0.478 −1.034∼0.077 0.091 NA NA NA
SLE: systemic lupus erythematosus, SMD: standard mean difference, CI: confidence interval, R: random effects model, F: fixed effects model, NA: not available. *Magnitude of the Cohen's d effect size (SMD) (0.2∼0.5, small effect; 0.5∼0.8, medium effect;
and ≥0.8, large effect).
with vascular stiffness (r=−0.38, p=0.039) [14]. Adipo- nectin were significantly higher in the SLE patients with plaque compared to those without plaque in multivariate analysis, indicating that adiponectin may serve as in- dependent predictor of carotid plaque [15]. Adiponectin was negatively associated with BMI, insulin resistance (IR) and C-reactive protein (ρ=−0.40, p<0.001; ρ=
−0.38, p<0.001; ρ=−0.22, p=0.02, respectively) [17,18], and ghrelin levels correlate with homocysteine
[18]. Authors suggested that adipokines may represent cardiovascular risk and are not just markers for disease activity [18]. SLE patients with IR showed significantly lower adiponectin levels than those without IR (10.9±4.6 vs. 15.4±4.4 μg/mL) and adiponectin levels were corre- lated inversely with homeostasis model assessment of in- sulin resistance in SLE patients [19]. Plasma adiponectin levels are increased in patients with renal SLE compared to healthy controls and patients with nonrenal SLE [20].
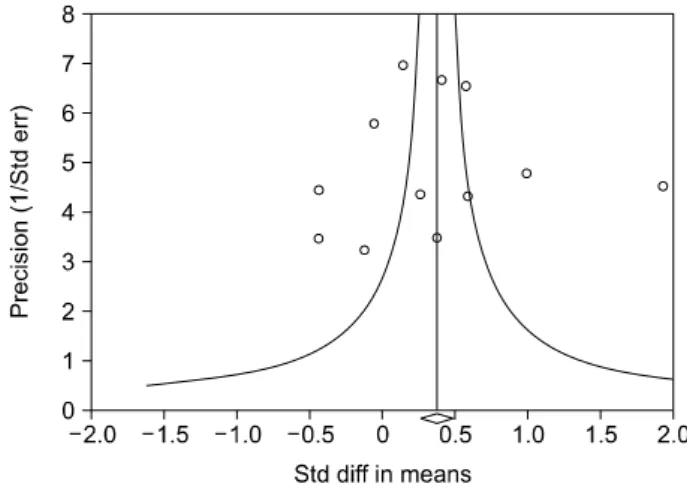
Figure 3. Funnel plot of studies that examined the relationship between adiponectin and systemic lupus erythematosus (Egger regression p-value=0.894). Std diff: standardized dif- ference, Std err: standardized error.
During renal flare, urine adiponectin levels increase significantly. Urine adiponectin may be a biomarker of re- nal SLE flare [20].
Heterogeneity and publication bias
Between-study heterogeneity was identified in the meta-analyses of adiponectin, visfatin, or ghrelin levels in patients with SLE (Table 2). Results of meta-regression analysis showed that the study region; adjustment for age, sex, or BMI; and sample size (p<0.001) had a sig- nificant effect on heterogeneity in the meta-analysis of adiponectin levels, not mean age and type of data (p>0.05).
Publication bias causes a disproportionate number of positive studies, and it poses a problem for meta-analyses.
However, we found no evidence of publication bias among all the studies (Egger regression test p-values>0.1) (Figure 3).
DISCUSSION
This analysis of 11 articles showed that circulating adi- ponectin levels were significantly higher in patients with SLE than in the healthy controls. Stratification according to region showed that high adiponectin levels are asso- ciated with SLE in the Western population, not the South American population. Results of the group analysis showed a significantly higher adiponectin level in the SLE group of studies with adjustment for age, sex, or BMI; large sam- ple size (n>100), and mean age >40 years. In addition, results of the analysis showed that circulating visfatin and ghrelin levels were significantly higher in patients with
SLE of the Western and South American populations.
Stratification by study region indicated that there was a difference in adipokine levels among different regions.
For example, meta-analysis by region showed signifi- cantly elevated adiponectin levels in the SLE group in the Western population, but not in the South American population. This indicates that region or ethnicity may correlate with adipokine levels in SLE patients. The re- gional differences may be partly explained by difference in statistical power due to study numbers. Low statistical power due to a small number of studies may explain the differences in the results between regions. The study number was large in the Western population compared to that in the South American population (9 vs. 2). There was a significantly higher adiponectin level in the SLE group of a large number of study, but not in that with a small number of study. However, other potential factors such as different clinical and environmental character- istics may also influence plasma/serum adipokine levels.
Previous meta-analysis also showed a regional difference of leptin levels, showing significantly higher leptin levels in the SLE patients from an Asian population, but not from Europe and America population [36].
This meta-analysis showed increased adiponectin levels in patients with SLE. Adiponectin may exert bidirectional effects of pro-inflammatory and anti-inflammatory activ- ities in SLE. Adiponectin plays a role in modulating the inflammatory response by inhibiting the expression of adhesion molecules, and suppressing macrophage and nuclear factor kappa B signaling [4]. Thus, the finding of this study can be partially explained by a beneficial coun- ter-regulatory function of adiponectin through counter- acting the pro-inflammatory effects of inflammatory cytokines. However, adiponectin also may play a role as an enhancer of the inflammatory response by inducing in- flammatory mediators [7]. The question whether the ef- fects of adiponectin in SLE are pro-inflammatory or an- ti-inflammatory needs to be studied further. Visfatin is produced by neutrophils and lymphocytes, bone marrow, and adipocytes, and it has pro-inflammatory and im- munomodulatory effects [8]. Visfatin acts as a chemo- tactic factor on monocytes and lymphocytes by activating T cells and enhancing the expression of co-stimulatory molecules on monocytes [37]. Visfatin levels are in- creased in inflammatory diseases [38]. Ghrelin has an in- hibitory effect on the production of pro-inflammatory cy- tokines [39], and it exerts a counter-regulatory function through counteracting the pro-inflammatory effects of
leptin [39]. It can also play a role in modulating immune responses and inflammatory processes [40]. Our meta-ana- lysis showed increased visfatin and ghrelin levels in pa- tients with SLE of the Western and South American pop- ulations, not the Middle Eastern population, suggesting that they play a possible role in the control of the immune and inflammatory process and the region or ethnicity may correlate with ghrelin levels in patients with SLE.
The present study has some limitations that should be considered. First, most of the included studies had small sample sizes; thus, many of the individual studies that constitute this meta-analysis may have been underpowered.
Second, the studies included patients with heteroge- neous demographic characteristics and clinical features.
The heterogeneity and confounding factors such as dis- ease activity and drugs used (e.g., immunosuppressive agents, hydroxychloroquine, and corticosteroids) may have affected our results, which may be compounded by the limited information provided for patients’ clinical sta- tus and disease activity. These limited data did not allow further analysis, although we performed a subgroup anal- ysis and meta-regression analysis. Nevertheless, this meta-analysis has some strengths. It is the first to com- pile evidence from multiple studies to indicate an associa- tion between adiponectin, visfatin, and ghrelin levels and SLE. Individual studies included population sizes ranging from only 15 to 822 participants, whereas our pooled analysis included 511 patients. Our study was able to in- crease the statistical power and resolution by pooling the results from many independent analyses.
CONCLUSION
Our meta-analysis demonstrated that circulating adipo- nectin levels are significantly higher in patients with SLE than in healthy controls, particularly in the Western pop- ulation and by the adjustment of age, sex, or BMI; a large sample size (n>100), and mean age >40 years. In addi- tion, circulating visfatin and ghrelin levels were sig- nificantly higher in patients with SLE of Western and South American populations. This analysis indicates that adiponectin, visfatin, and ghrelin likely play an important role in the pathogenesis of SLE. Further studies are need- ed to determine whether adiponectin, visfatin, and ghrelin directly contribute to the pathogenesis of SLE.
CONFLICT OF INTEREST
No potential conflict of interest relevant to this article was reported.
REFERENCES
1. Ruiz-Irastorza G, Khamashta MA, Castellino G, Hughes GR. Systemic lupus erythematosus. Lancet 2001;357:1027- 32.
2. Shao WH, Cohen PL. Disturbances of apoptotic cell clear- ance in systemic lupus erythematosus. Arthritis Res Ther 2011;13:202.
3. Coelho M, Oliveira T, Fernandes R. Biochemistry of adipose tissue: an endocrine organ. Arch Med Sci 2013;9:191-200.
4. Shehzad A, Iqbal W, Shehzad O, Lee YS. Adiponectin: regu- lation of its production and its role in human diseases.
Hormones (Athens) 2012;11:8-20.
5. Cheng X, Folco EJ, Shimizu K, Libby P. Adiponectin induces pro-inflammatory programs in human macrophages and CD4+ T cells. J Biol Chem 2012;287:36896-904.
6. Lee YA, Ji HI, Lee SH, Hong SJ, Yang HI, Chul Yoo M, et al.
The role of adiponectin in the production of IL-6, IL-8, VEGF and MMPs in human endothelial cells and osteo- blasts: implications for arthritic joints. Exp Mol Med 2014;
46:e72.
7. Tang CH, Chiu YC, Tan TW, Yang RS, Fu WM. Adiponectin enhances IL-6 production in human synovial fibroblast via an AdipoR1 receptor, AMPK, p38, and NF-kappa B pathway.
J Immunol 2007;179:5483-92.
8. Luk T, Malam Z, Marshall JC. Pre-B cell colony-enhancing factor (PBEF)/visfatin: a novel mediator of innate immunity.
J Leukoc Biol 2008;83:804-16.
9. Brentano F, Schorr O, Ospelt C, Stanczyk J, Gay RE, Gay S, et al. Pre-B cell colony-enhancing factor/visfatin, a new marker of inflammation in rheumatoid arthritis with proin- flammatory and matrix-degrading activities. Arthritis Rheum 2007;56:2829-39.
10. Date Y, Kojima M, Hosoda H, Sawaguchi A, Mondal MS, Suganuma T, et al. Ghrelin, a novel growth hormone-releas- ing acylated peptide, is synthesized in a distinct endocrine cell type in the gastrointestinal tracts of rats and humans.
Endocrinology 2000;141:4255-61.
11. Karmiris K, Koutroubakis IE, Kouroumalis EA. Leptin, adi- ponectin, resistin, and ghrelin--implications for inflam- matory bowel disease. Mol Nutr Food Res 2008;52:855-66.
12. Barbosa Vde S, Francescantônio PL, Silva NA. Leptin and adiponectin in patients with systemic lupus erythematosus:
clinical and laboratory correlations. Rev Bras Reumatol 2015;55:140-5.
13. McMahon M, Skaggs BJ, Grossman JM, Sahakian L, Fitzgerald J, Wong WK, et al. A panel of biomarkers is asso- ciated with increased risk of the presence and progression of atherosclerosis in women with systemic lupus erythe- matosus. Arthritis Rheumatol 2014;66:130-9.
14. Vadacca M, Zardi EM, Margiotta D, Rigon A, Cacciapaglia F, Arcarese L, et al. Leptin, adiponectin and vascular stiffness parameters in women with systemic lupus erythematosus.
Intern Emerg Med 2013;8:705-12.
15. Reynolds HR, Buyon J, Kim M, Rivera TL, Izmirly P, Tunick P, et al. Association of plasma soluble E-selectin and adipo- nectin with carotid plaque in patients with systemic lupus erythematosus. Atherosclerosis 2010;210:569-74.
16. De Sanctis JB, Zabaleta M, Bianco NE, Garmendia JV, Rivas L. Serum adipokine levels in patients with systemic lupus erythematosus. Autoimmunity 2009;42:272-4.
17. Chung CP, Long AG, Solus JF, Rho YH, Oeser A, Raggi P, et al. Adipocytokines in systemic lupus erythematosus: rela- tionship to inflammation, insulin resistance and coronary atherosclerosis. Lupus 2009;18:799-806.
18. Al M, Ng L, Tyrrell P, Bargman J, Bradley T, Silverman E.
Adipokines as novel biomarkers in paediatric systemic lu- pus erythematosus. Rheumatology (Oxford) 2009;48:497- 501.
19. Sada KE, Yamasaki Y, Maruyama M, Sugiyama H, Yamamura M, Maeshima Y, et al. Altered levels of adipocy- tokines in association with insulin resistance in patients with systemic lupus erythematosus. J Rheumatol 2006;33:
1545-52.
20. Rovin BH, Song H, Hebert LA, Nadasdy T, Nadasdy G, Birmingham DJ, et al. Plasma, urine, and renal expression of adiponectin in human systemic lupus erythematosus.
Kidney Int 2005;68:1825-33.
21. Ozgen M, Koca SS, Aksoy K, Dagli N, Ustundag B, Isik A.
Visfatin levels and intima-media thicknesses in rheumatic diseases. Clin Rheumatol 2011;30:757-63.
22. Kim HA, Choi GS, Jeon JY, Yoon JM, Sung JM, Suh CH.
Leptin and ghrelin in Korean systemic lupus erythematosus.
Lupus 2010;19:170-4.
23. Lee YH, Woo JH, Choi SJ, Ji JD, Song GG. Associations be- tween osteoprotegerin polymorphisms and bone mineral density: a meta-analysis. Mol Biol Rep 2010;37:227-34.
24. Lee YH, Rho YH, Choi SJ, Ji JD, Song GG. PADI4 poly- morphisms and rheumatoid arthritis susceptibility: a meta-analysis. Rheumatol Int 2007;27:827-33.
25. Lee YH, Woo JH, Choi SJ, Ji JD, Song GG. Induction and maintenance therapy for lupus nephritis: a systematic re- view and meta-analysis. Lupus 2010;19:703-10.
26. Hochberg MC. Updating the American College of Rheuma- tology revised criteria for the classification of systemic lupus erythematosus. Arthritis Rheum 1997;40:1725.
27. Moher D, Liberati A, Tetzlaff J, Altman DG; PRISMA Group.
Preferred reporting items for systematic reviews and
meta-analyses: the PRISMA statement. PLoS Med 2009;
6:e1000097.
28. Hozo SP, Djulbegovic B, Hozo I. Estimating the mean and variance from the median, range, and the size of a sample.
BMC Med Res Methodol 2005;5:13.
29. Ridout KK, Ridout SJ, Price LH, Sen S, Tyrka AR.
Depression and telomere length: A meta-analysis. J Affect Disord 2016;191:237-47.
30. Wells GA, Shea B, O’Connell D, Peterson J, Welch V, Losos M, et al. The Newcastle-Ottawa Scale (NOS) for assessing the quality of nonrandomised studies in meta-analyses [Internet]. Ottawa (ON): Ottawa Hospital Research Institute, 2000 [cited 2016]. Available from: http://www.ohri.- ca/programs/clinical_epidemiology/oxford.asp.
31. McGough JJ, Faraone SV. Estimating the size of treatment effects: moving beyond p values. Psychiatry (Edgmont) 2009;6:21-9.
32. Egger M, Smith GD, Phillips AN. Meta-analysis: principles and procedures. BMJ 1997;315:1533-7.
33. DerSimonian R, Laird N. Meta-analysis in clinical trials.
Control Clin Trials 1986;7:177-88.
34. Higgins JP, Thompson SG. Quantifying heterogeneity in a meta-analysis. Stat Med 2002;21:1539-58.
35. Egger M, Davey Smith G, Schneider M, Minder C. Bias in meta-analysis detected by a simple, graphical test. BMJ 1997;315:629-34.
36. Li HM, Zhang TP, Leng RX, Li XP, Li XM, Pan HF.
Plasma/serum leptin levels in patients with systemic lupus erythematosus: a meta-analysis. Arch Med Res 2015;46:
551-6.
37. Sun Z, Lei H, Zhang Z. Pre-B cell colony enhancing factor (PBEF), a cytokine with multiple physiological functions.
Cytokine Growth Factor Rev 2013;24:433-42.
38. Moschen AR, Kaser A, Enrich B, Mosheimer B, Theurl M, Niederegger H, et al. Visfatin, an adipocytokine with proin- flammatory and immunomodulating properties. J Immunol 2007;178:1748-58.
39. Dixit VD, Schaffer EM, Pyle RS, Collins GD, Sakthivel SK, Palaniappan R, et al. Ghrelin inhibits leptin- and activa- tion-induced proinflammatory cytokine expression by hu- man monocytes and T cells. J Clin Invest 2004;114:57-66.
40. Korbonits M, Goldstone AP, Gueorguiev M, Grossman AB.
Ghrelin--a hormone with multiple functions. Front Neu- roendocrinol 2004;25:27-68.
![Table 1. Characteristics of individual studies included in the meta-analysis StudyCountryPatientAge, yrBMI, kg/m2Disease duration, yrAdipokinesAdjustment* Quality score SLEControlSLEControlSLEControl Barbosa, 2015 [12]Brazil523333.4±9.4 32.5±10.523.8±3.52](https://thumb-ap.123doks.com/thumbv2/123dokinfo/5319367.166910/4.892.137.709.142.1147/characteristics-individual-included-analysis-studycountrypatientage-yradipokinesadjustment-slecontrolslecontrolslecontrol-barbosa.webp)