한국 청소년의 흡연과 자살관련행동과의 관계:
제12차(2016년) 청소년건강행태온라인조사
김혜원, 김양근, 백재용, 홍창빈, 이가영, 박태진, 김진승
인제대학교 의과대학 부산백병원 가정의학과
The Relationship between Smoking and Suicidal Behavior in Korean Adolescents: 12th Korea Youth Risk Behavior
Web-based Survey
Hye Won Kim, Yang Keun Kim, Jae Yong Paik, Chang Bin Hong , Kayoung Lee, Tae-Jin Park, Jinseung Kim
Department of Family Medicine, Busan Paik Hospital, Inje University College of Medicine, Busan, Korea Background: Suicide is the first leading cause of death among teenagers in Korea, and smoking is reported to be one of the risk factors for suicide. The purpose of this study is to investigate the relationship between smok- ing and smoking amount and suicidal behavior using data from the Korea Youth Risk Behavior Web-based Survey (KYRBS).
Methods: Using the 12th KYRBS 2016, we surveyed smoking, smoking amount, suicidal ideation, suicidal plan- ning, and suicidal attempt of adolescents. And a total of 65,528 respondents were divided into current smoker, former smokers, and non-smoker, and 4,012 smokers were classified into ≤9 cigarettes/day group, 10-19 cig- arettes/day group, and ≥20 cigarettes/day group according to the amount of smokers. We analyzed the rela- tionship between smoking and smoking amount and suicidal ideation, suicidal planning, and suicidal attempt using multivariate logistic regression analysis.
Results: As a result of adjusting for all confounding variables, the current smoker has an odds ratio of 1.143 (confidence interval 1.020-1.281) with suicidal ideation compared to non-smoker and the odds ratio of suicidal planning and suicidal attempt is also statistically significant, respectively. And the odds ratio of all suicidal be- haviors was significantly higher in ≥20 cigarettes/day group than in ≤9 cigarettes/day group, respectively.
Conclusions: We found that smoking and smoking amount was related to suicidal ideation, suicidal planning, and suicidal attempts in adolescents. Therefore, suicidal prevention strategies considering this relationship should be established.
Korean J Health Promot 2017;17(4):219-233
Keywords: Korea, Adolescent, Suicide, Behavior, Smoking
■ Received: July 3, 2017 ■ Accepted: October 17, 2017
■Corresponding author: Jinseung Kim, MD
Department of Family Medicine, Busan Paik Hospital, Inje University College of Medicine, 75 Bokji-ro, Busanjin-gu, Busan 47392, Korea Tel: +82-51-890-6683, Fax: +82-51-894-7554
E-mail: jinseungkim@inje.ac.kr
Copyright ⓒ 2017 The Korean Society of Health Promotion and Disease Prevention
This is an Open Access article distributed under the terms of the Creative Commons Attribution Non-Commercial License (http://creativecommons.org/licenses/by-nc/3.0/) which permits unrestricted noncommercial use, distribution, and reproduction in any medium, provided the original work is properly cited.
서 론
2016년도에 발표한 통계청 자료의 ‘2015년 사망원인통계’
에 따르면 자살은 10대부터 30대까지 사망원인 순위 1위이 며, 경제협력개발기구(Organization for Economic Cooper- ation and Development, OECD) 국가별 자살률을 비교해보 면 OECD 표준인구 10만 명당 자살률은 평균 12.0명에 비 해, 한국은 28.7명으로 회원국 중 가장 높은 수준을 나타내
고 있다.1) 자살은 2008년 10대 인구의 사망원인 중 1위가 된 후 그 순위를 지속적으로 유지하고 있으므로, 청소년의 자살을 예방하기 위한 대책이 필요하다.2)
청소년 시기는 신체적, 정신적 급변 과정을 거쳐 성인으 로 성장과 발달을 급격하게 하는 과도기이며, 이로 인해 외 적 스트레스가 많고 감정의 기복이 많은 격동의 시기인 동 시에 부모의 기대와 사회적 요구에 처음으로 직면하는 시 기이다. 이러한 청소년 시기는 일시적인 정서적 불균형 등 으로 인해 자살의 위험성이 높으며,3) 또한 지속적인 관심 이 필요한 시기이다.4)
청소년의 자살은 자살생각(suicidal ideation), 자살계획 (suicidal planning), 자살시도(suicidal attempt)를 포함하는 일련의 자살행동으로 이해되고 있다.5) 자살을 예방하기 위 해서는 자살을 자살생각, 자살계획, 자살시도에 이어 죽음 으로 연결되는 하나의 연속체로 가정하여 먼저 자살 위험 성이 높은 청소년들을 예측하는 것이 우선적이나 실제적으 로 자살 위험성을 예측하기는 매우 어려운 일이기 때문에 많은 경우, 자살의 위험성은 자살생각을 측정함으로써 예 측된다.6) 자살생각이 자살 행위로 바로 이어지는 것은 아 니지만, 자살생각을 가지고 있는 사람이 실제 자살로 사망 할 위험이 높으며,7,8) 지속된 자살생각은 충동적으로 자살 을 시도하게 하는 요인으로 보고 되고 있다.9) 또한, 자살을 시도한 청소년은 이전에 자살생각을 한 적이 있는 경우가 많으며,10) 자살시도는 자살생각에 비해 실제 사망할 가능 성이 보다 더 높다는 위험성을 가지고 있다.11)
자살을 하기 전 청소년들은 자살과 관련된 어떤 행동을 하게 되는데, 그 행동에 영향을 주는 요인을 파악하여 부정 적 영향을 중재함으로써 자살을 예방할 수 있을 것으로 여 겨진다.2) 청소년의 자살생각에 영향을 미치는 요인들을 분 석한 최근의 선행연구 결과를 보면 우울, 무망감, 생활스트 레스와 같은 심리적 변인, 대중매체의 자살 보도, 인터넷 중독과 같은 사회문화적 변인, 가족관계 스트레스와 같은 가정 환경적 변인, 학교생활 스트레스, 학교 폭력, 학업스 트레스, 학업 성취도와 같은 학교 환경적 변인, 경제적 수 준, 성별, 학년유형과 같은 개인 특성별 변인들이 청소년 자살생각 관련 위험변인으로 보고되고 있다.12) 청소년을 대상으로 한 또 다른 연구에서는 부모, 또래와의 부정적인 관계, 스트레스, 우울, 비행이 자살생각과 유의한 영향이 있는 것으로 나타났으며,13) 청소년의 자살생각, 자살계획, 자살시도에 영향을 미치는 요인에 대한 살펴본 한 국내 연 구 결과에서는 일반적 특성 및 음주, 흡연, 주단위 중증도 운동 등과 같은 건강행태 관련 특성 및 정서적 특성이 영향 을 미치는 요인이라고 보고하고 있다.2)
성인의 자살생각에 영향을 미치는 위험요인에 대한 연구 에서도 결혼, 교육수준과 같은 인구사회학적 변인뿐만 아
니라 흡연, 음주, 수면, 주관적 건강상태, 주관적 체형인식 등의 건강행위와 건강상태가 성인의 자살생각에 영향을 미 치는 위험요인으로 작용하고 있다고 보고하고 있다.14,15)
청소년의 자살에 영향을 미치는 여러 위험요인 중 청소 년의 흡연에 대한 연구를 살펴보면, 청소년의 흡연은 자아 통제력이 부족한 시기에 흡연을 일찍 시작할수록 흡연을 중단하기 어렵고 규칙적인 흡연자가 되기 쉬워서, 흡연이 장기간 지속되고 흡연의 양도 많아지게 된다.16) 또한 어린 나이에 흡연을 시작하면 니코틴 의존성이 높아져 정신건강 에 부정적인 영향을 미친다고 알려져 있다.17) 청소년의 자 살에 영향을 미치는 요인을 분석한 외국 연구의 결과에서 도 청소년 흡연은 단독 요인으로 청소년의 자살과 자살생 각에 유의한 영향을 미치는 중요한 인자이며, 흡연이 자살 에 영향을 미칠 뿐만 아니라 흡연의 양이 자살과 유의한 관련이 있었다.16,18)
이전의 연구들을 살펴보면, 청소년 자살 연구들은 자살 생각과의 관련 요인들을 연구한 것이 주를 이루고 있으며, 각각의 요인과 자살 관련 행동과의 연관성을 파악한 연구 는 부족한 실정이다. 흡연과 자살 관련 행동과의 관계를 살 펴본 외국 연구에 따르면 흡연과 자살 관련 행동의 교차비 는 유의미하게 나왔음을 알 수 있으며,19) 간호사를 대상으 로 흡연과 자살과의 관계를 살펴본 한 외국의 연구에서도 흡연은 자살에 영향을 미치는 요인으로 나타나 있다.20) 이 렇듯 자살에 흡연은 상당한 영향을 미치는 요인으로 알려 져 오고 있어, 본 연구는 청소년건강행태온라인조사 자료 를 이용하여 한국 청소년의 흡연 여부 및 흡연량과 자살생 각, 자살계획, 자살시도(자살 관련 행동)와의 연관성을 살 펴보고자 하였다. 또한, 이를 토대로 청소년 금연교육 및 흡연 예방 교육과 자살 예방 교육프로그램을 위한 기초자 료를 제공하고자 한다.
방 법
1. 연구 대상
본 연구는 질병관리본부에서 주관한 2016년 제12차 청소 년건강행태온라인조사 원시자료를 이용하여 한국 청소년 의 흡연 여부 및 흡연량과 자살 관련 행동과의 연관성을 알아보았다. 이 자료는 온라인조사 홈페이지에서 사용승인 을 받아 연구의 목적에 맞게 분석하였다.21)
이 조사는 2016년 4월 기준의 전국 중학교 1학년부터 고 등학교 3학년 학생을 대상으로 하고 있으며, 중학교 400개 교, 고등학교 400개교, 총 800개교의 67,983명을 대상으로 조사하였고, 798개교, 65,528명이 조사에 참여하여 96.4%
참여율을 보였다. 본 연구의 분석 대상자는 제12차 청소년
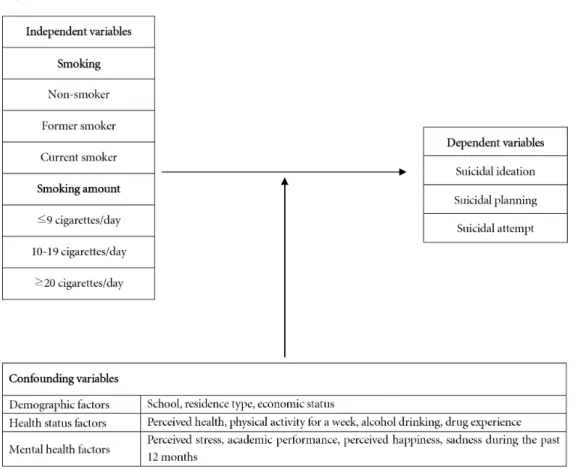
Figure 1. Framework.
건강행태온라인조사 참여자로 대상자 수는 남학생 33,803명, 여학생 31,725명, 총 65,528명이다.
2. 자료수집
제12차 청소년건강행태온라인조사는 인터넷이 가능한 학교 컴퓨터실에서 표본학급 학생들에게 1인 1대 컴퓨터를 배정하고, 무작위로 자리를 배치하여 익명성 자기기입식 온라인조사방법으로 수행하였다.
3. 변수정의(Figure 1)
1) 종속변수
본 연구에서 종속변수는 자살생각, 자살계획, 자살시도 이다. 자살생각은 “최근 12개월 동안, 심각하게 자살을 생 각한 적이 있었습니까?”라는 문항에 ‘최근 12개월 동안 없 다’, ‘ 최근 12개월 동안 있다’로 응답하도록 구성되어 있으 며, ‘없다’, ‘있다’로 재구성하였다. 자살계획은 “최근 12개 월 동안, 자살하기 위해 구체적인 계획을 세운 적이 있었습 니까?”라는 문항에 ‘없다’, ‘있다’, 자살시도는 “최근 12개 월 동안, 자살을 시도한 적이 있었습니까?”라는 문항에 ‘없
다’, ‘있다’의 응답으로 재구성하였다.
2) 독립변수
본 연구에서는 자살 관련 행동과의 연관성을 알아보기 위한 독립변수로 흡연 여부와 흡연량을 이용하였다. 흡연 관련 문항에서 “지금까지 담배를 한두 모금이라도 피워본 적이 있습니까?”라는 문항에 ‘있다’라고 응답한 경우를 ‘흡 연경험자’로 정의하였고, ‘없다’라고 응답한 경우를 ‘비흡 연자’로 정의하였다. 또한 “최근 30일 동안, 담배를 한 대 (한 개비)라도 피운 날은 며칠입니까?”라는 문항에 ‘최근 30일 동안 없다’라고 응답한 경우 ‘과거 흡연자’, ‘월 1-2일’
에서 ‘매일’까지 응답한 경우를 ‘현재 흡연자’로 정의하였 고, 두 문항의 응답을 바탕으로 분석 대상자를 ‘비흡연자’,
‘과거 흡연자’, ‘현재 흡연자’로 분류하여 분석하였다. 흡연 량은 “최근 30일 동안 담배를 하루에 평균 몇 개비 피웠습 니까?”라는 문항의 응답을 통해 ‘9개비 이하’, ‘10-19개비’,
‘20개비 이상’으로 재분류하여 분석하였다.
3) 혼란변수
본 연구에서 혼란변수는 종전의 연구에서 살펴본 자살생 각에 영향을 미치는 요인들을 바탕으로2,12-15) 크게 인구사
회학적 요인, 건강상태 요인, 정신건강 요인 부분으로 나누 어 분석하였다. 인구사회학적 요인은 성별, 학교형태, 경제 상태, 거주형태로 구성하였고, 건강상태 요인은 신체활동, 평생 음주경험, 약물경험, 주관적 건강 인지로 구성하였다.
정신건강 요인은 스트레스 인지, 학업성적, 주관적 행복, 슬픔/절망감 경험을 포함하여 구성하였다. 학교형태는 중 학교, 고등학교로 구분하였고, 경제상태는 상, 중, 하로 분 류하였다. 거주형태 ‘가족과 함께 살고 있다’와 ‘그렇지 않 다’로 분류하였고, 주관적 건강 인지는 “평상시 자신의 건 강상태가 어떻다고 생각합니까?”라는 문항의 응답에서 ‘매 우 건강한 편이다’와 ‘건강한 편이다’를 ‘건강한 편이다’로
‘보통이다’를 ‘보통이다’로 ‘건강하지 못한 편이다’와 ‘매우 건강하지 못한 편이다’를 ‘건강하지 못한 편이다’로 재분류 하였다. 신체활동에 관한 변수는 미국 스포츠의학대학 (American College of Sports Medicine)에서 청소년의 건강 을 위해 주 3일 이상, 20분의 격렬한 신체활동이나, 주 5일 이상의 30분의 중등도 신체활동 및 적어도 주 2일의 고강 도 훈련을 권장하고 있어22) 이를 바탕으로 “최근 7일 동안 심장박동이 평상시보다 증가하거나, 숨이 찬 정도의 신체 활동을 하루에 총합이 60분 이상 한 날은 며칠입니까?”라 는 문항의 응답에서 ‘주 1일 미만’, ‘주 1-4일’, ‘주 5일 이상’
으로 재분류하였다. 평생 음주경험은 “지금까지 1잔 이상 술을 마셔본 적이 있습니까?”에 ‘있다’로 응답한 경우를
‘음주 경험자’, '없다'로 응답한 경우를 ‘음주 비경험자’로 분류하였다. 약물경험에 대해서는 “지금까지 습관적으로 또는 일부러 약물을 먹거나 부탄가스, 본드 등을 마신 적이 있습니까?”라는 문항에 ‘있다’로 응답한 경우 ‘약물경험자’,
‘없다’로 응답한 경우 ‘약물 비경험자’로 분류하였다. 스트 레스 인지는 “평상시 스트레스를 얼마나 느끼고 있습니 까?”라는 문항에 ‘대단히 많이 느낀다’, ‘많이 느낀다’, ‘조 금 느낀다’로 응답한 경우를 ‘인지하고 있다’로 ‘별로 느끼 지 않는다’, ‘전혀 느끼지 않는다’로 응답한 경우를 ‘인지하 고 있지 않다’로 재분류하였다.
학업성적에 대해서는 “최근 12개월 동안, 학업 성적은 어떻습니까?”라는 문항의 응답을 통해 상, 중, 하로 분류하 였고, 주관적 행복은 ‘행복한 편이다’, ‘보통이다’, ‘불행한 편이다’로 재분류하여 분석하였다. 슬픔/절망감 경험은 “최 근 12개월 동안, 2주 내내 일상생활을 중단할 정도로 슬프거 나 절망감을 느낀 적이 있었습니까?”라는 문항에 ‘없다’, ‘있 다’ 응답으로 구분하였다.
4. 통계분석
청소년건강행태온라인조사는 복합표본설계를 이용한 자 료이므로 복합표본분석 통계방법을 이용하여 분석하였다.
대상자의 일반적 특성은 빈도분석을 통해 빈도와 백분율을 분석하였고, 일반적 특성에 따른 자살 관련 행동의 차이는 교차분석을 이용하여 분석하였다. 흡연 여부 및 흡연량과 자살 관련 행동과의 연관성을 알아보기 위해 다변량 로지 스틱회귀분석을 이용하였으며, 자살 관련 행동에 영향을 줄 수 있는 혼란변수를 통제하여 분석하였다. 분석에는 IBM SPSS Statistics version 23.0 (IBM Corp., New York, NY, USA) 프로그램을 이용하였으며, 유의수준은 P<0.05 로 하였다.
결 과
1. 연구 대상자의 일반적 특성(Table 1)
연구 대상자는 총 65,528명으로 남학생 33,803명(51.6%), 여학생 31,725명(48.4%)이었고, 학교형태는 중학교가 32,219명 (45.4%), 고등학교가 33,309명(54.6%)이었다. 거주형태는 ‘가 족과 함께 살고 있다’가 전체 62,263명(95.5%)이었고, 경제 상태는 ‘중’이 31,056명(47.3%)으로 가장 많았다. 주관적 건강은 ‘건강한 편이다’로 응답한 학생이 71.8%로 가장 많 았고, 신체활동은 ‘주 1-4일’로 응답한 학생이 전체 학생의 50.1%, 남학생은 53.1%, 여학생은 ‘주 1일 미만’, ‘주 1-4일’
이 각각 46.2%, 46.8%였다. 평생 음주경험은 남학생이 14,294명(43.5%), 여학생이 10,510명(33.6%)으로 남학생이 더 많았고, 약물경험도 남학생이 347명(1.1%), 여학생이 206명(0.7%)을 나타내었다. 스트레스 인지는 전체 학생의 80.3%가 ‘인지하고 있다’로 응답하였으나, 주관적 행복은 전체 학생의 66.6%가 ‘행복한 편이다’로 응답하였다. 흡연 에 관한 문항에서 평생 흡연경험은 전체 9,511명(14.8%)이
‘있다’에 응답하였고, 이 중 과거 흡연자가 5,499명(8.5%), 현재 흡연자가 4,012명(6.3%)으로 나타났으며, 흡연량은
‘9개비 이하’라고 응답한 학생이 3,171명(78.4%)으로 가장 많았다. 자살생각은 12.1%, 자살계획은 4.0%, 자살시도는 2.4%의 학생들이 ‘있다’로 응답하였으며, 특히 여학생은 자살생각을 한 적이 있는 학생이 14.9%, 자살계획을 세운 적이 있는 학생이 4.3%, 자살시도를 한 적이 있는 학생이 2.7%로 남학생보다 비율이 높았다.
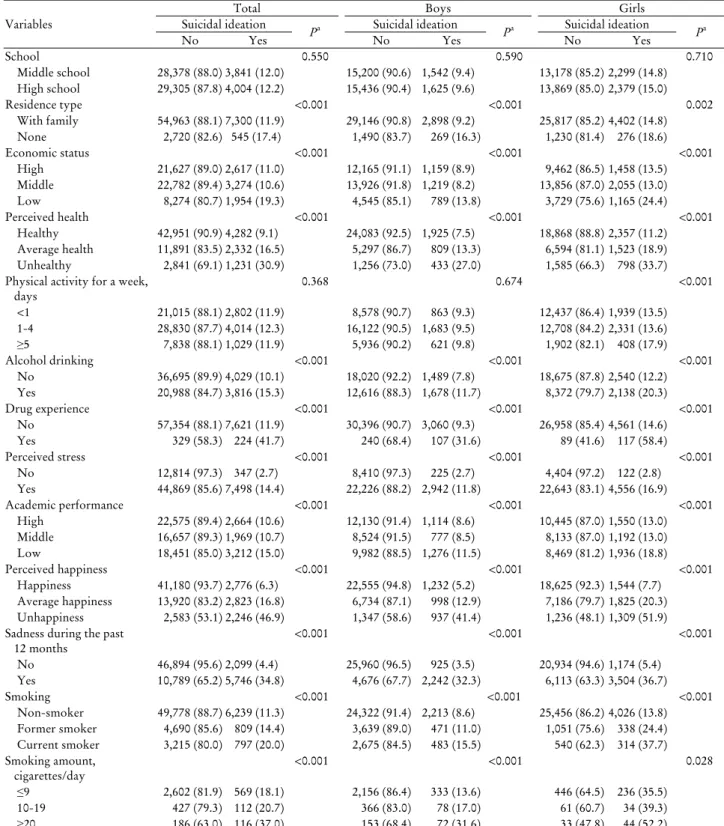
2. 일반적 특성에 따른 자살 관련 행동의 차이
1) 일반적 특성에 따른 자살생각의 차이(Table 2) 거주형태에 따른 자살생각은 가족과 함께 사는 학생 중 자살생각을 한 학생은 11.9%, 그렇지 않은 학생 중 자살생 각을 한 학생은 17.4% (P<0.001)였으며, 경제상태가 ‘상’인 학생 중 자살생각을 한 학생은 11.1%, ‘하’인 학생은 19.3%
Charateristics Total P Boys (n=33,803) P Girls (n=31,725) Pa Gender
Boys 33,803 (51.6)
Girls 31,725 (48.4)
School <0.001 <0.001 <0.001
Middle school 32,219 (45.4) 16,742 (45.4) 15,477 (45.4)
High school 33,309 (54.6) 17,061 (54.6) 16,248 (54.6)
Residence type <0.001 <0.001 <0.001
With family 62,263 (95.5) 32,044 (95.2) 30,219 (95.8)
None 3,265 (4.5) 1,506 (4.8) 1,506 (4.2)
Economic status <0.001 <0.001 <0.001
High 24,244 (37.2) 13,324 (39.5) 10,920 (34.6)
Middle 31,056 (47.3) 15,145 (44.7) 15,911 (50.1)
Low 10,228 (15.6) 5,334 (15.9) 4,894 (15.3)
Perceived health <0.001 <0.001 <0.001
Healthy 47,233 (71.8) 26,008 (76.6) 21,225 (66.5)
Average health 14,223 (21.9) 6,106 (18.3) 8,117 (25.9)
Unhealthy 4,072 (6.3) 1,689 (5.1) 2,383 (7.7)
Physical activity for a weekb, days <0.001 <0.001 <0.001
<1 23,817 (36.8) 9,441 (28.1) 14,376 (46.2)
1-4 32,844 (50.1) 17,805 (53.1) 15,039 (46.8)
≥5 8,867 (13.1) 6,557 (18.8) 2,310 (7.0)
Alcohol drinking <0.001 <0.001 <0.001
No 40,724 (61.2) 19,509 (56.5) 21,215 (66.4)
Yes 24,804 (38.8) 14,294 (43.5) 10,510 (33.6)
Drug experience <0.001 <0.001 <0.001
No 64,975 (99.1) 33,456 (98.9) 31,519 (99.3)
Yes 553 (0.9) 347 (1.1) 206 (0.7)
Perceived stress <0.001 <0.001 <0.001
No 13,161 (19.7) 8,635 (25.0) 4,526 (14.0)
Yes 52,367 (80.3) 25,168 (75.0) 27,199 (86.0)
Academic performance <0.001 <0.001 <0.001
High 25,239 (38.1) 13,244 (38.9) 11,995 (37.2)
Middle 18,626 (28.6) 9,301 (27.8) 9,325 (29.6)
Low 21,663 (33.3) 11,258 (33.4) 10,405 (33.2)
Percevied happiness <0.001 <0.001 <0.001
Happiness 43,956 (66.6) 23,787 (69.8) 20,169 (63.1)
Average happiness 16,743 (25.8) 7,732 (23.2) 9,011 (28.6)
Unhappiness 4,829 (7.6) 2,284 (6.9) 2,545 (8.3)
Sadness during the past 12 months <0.001 <0.001 <0.001
No 48,993 (74.5) 26,885 (79.1) 22,108 (69.5)
Yes 16,535 (25.5) 6,918 (20.9) 9,617 (30.5)
Smoking <0.001 <0.001 <0.001
Non-smoker 56,017 (85.2) 26,535 (78.1) 29,482 (92.9)
Former smoker 5,499 (8.5) 4,110 (12.3) 1,389 (4.4)
Current smoker 4,012 (6.3) 3,158 (9.6) 854 (2.7)
Smoking amount, cigarettes/day <0.001 <0.001 <0.001
≤9 3,171 (78.4) 2,489 (78.4) 682 (78.7)
10-19 539 (13.4) 444 (14.1) 95 (10.8)
≥20 302 (8.1) 225 (7.5) 77 (10.5)
Suicidal ideation <0.001 <0.001 <0.001
No 57,683 (87.9) 30,636 (90.5) 27,047 (85.1)
Yes 7,845 (12.1) 3,167 (9.5) 4,678 (14.9)
Suicidal planning <0.001 <0.001 <0.001
No 62,894 (96.0) 32,529 (96.2) 30,365 (95.7)
Yes 2,634 (4.0) 1,274 (3.8) 1,360 (4.3)
Suicidal attempt <0.001 <0.001 <0.001
No 63,998 (97.6) 33,137 (98.0) 30,861 (97.3)
Yes 1,530 (2.4) 666 (2.0) 864 (2.7)
Values are presented as number (%) using frequency analysis in complex sample design.
aP values are obtained by F-test.
bPhysical activity for a week is defined as a day in which a total of 60 minutes or more of a day ‘physical activity of the heartbeat is increased or breathed’ during the past 7 days.
Table 1. Characteristics of study population
Variables
Total Boys Girls
Suicidal ideation Pa Suicidal ideation Pa Suicidal ideation Pa
No Yes No Yes No Yes
School 0.550 0.590 0.710
Middle school 28,378 (88.0) 3,841 (12.0) 15,200 (90.6) 1,542 (9.4) 13,178 (85.2) 2,299 (14.8) High school 29,305 (87.8) 4,004 (12.2) 15,436 (90.4) 1,625 (9.6) 13,869 (85.0) 2,379 (15.0)
Residence type <0.001 <0.001 0.002
With family 54,963 (88.1) 7,300 (11.9) 29,146 (90.8) 2,898 (9.2) 25,817 (85.2) 4,402 (14.8) None 2,720 (82.6) 545 (17.4) 1,490 (83.7) 269 (16.3) 1,230 (81.4) 276 (18.6)
Economic status <0.001 <0.001 <0.001
High 21,627 (89.0) 2,617 (11.0) 12,165 (91.1) 1,159 (8.9) 9,462 (86.5) 1,458 (13.5) Middle 22,782 (89.4) 3,274 (10.6) 13,926 (91.8) 1,219 (8.2) 13,856 (87.0) 2,055 (13.0) Low 8,274 (80.7) 1,954 (19.3) 4,545 (85.1) 789 (13.8) 3,729 (75.6) 1,165 (24.4)
Perceived health <0.001 <0.001 <0.001
Healthy 42,951 (90.9) 4,282 (9.1) 24,083 (92.5) 1,925 (7.5) 18,868 (88.8) 2,357 (11.2) Average health 11,891 (83.5) 2,332 (16.5) 5,297 (86.7) 809 (13.3) 6,594 (81.1) 1,523 (18.9) Unhealthy 2,841 (69.1) 1,231 (30.9) 1,256 (73.0) 433 (27.0) 1,585 (66.3) 798 (33.7) Physical activity for a week,
days 0.368 0.674 <0.001
<1 21,015 (88.1) 2,802 (11.9) 8,578 (90.7) 863 (9.3) 12,437 (86.4) 1,939 (13.5)
1-4 28,830 (87.7) 4,014 (12.3) 16,122 (90.5) 1,683 (9.5) 12,708 (84.2) 2,331 (13.6)
≥5 7,838 (88.1) 1,029 (11.9) 5,936 (90.2) 621 (9.8) 1,902 (82.1) 408 (17.9)
Alcohol drinking <0.001 <0.001 <0.001
No 36,695 (89.9) 4,029 (10.1) 18,020 (92.2) 1,489 (7.8) 18,675 (87.8) 2,540 (12.2)
Yes 20,988 (84.7) 3,816 (15.3) 12,616 (88.3) 1,678 (11.7) 8,372 (79.7) 2,138 (20.3)
Drug experience <0.001 <0.001 <0.001
No 57,354 (88.1) 7,621 (11.9) 30,396 (90.7) 3,060 (9.3) 26,958 (85.4) 4,561 (14.6)
Yes 329 (58.3) 224 (41.7) 240 (68.4) 107 (31.6) 89 (41.6) 117 (58.4)
Perceived stress <0.001 <0.001 <0.001
No 12,814 (97.3) 347 (2.7) 8,410 (97.3) 225 (2.7) 4,404 (97.2) 122 (2.8) Yes 44,869 (85.6) 7,498 (14.4) 22,226 (88.2) 2,942 (11.8) 22,643 (83.1) 4,556 (16.9)
Academic performance <0.001 <0.001 <0.001
High 22,575 (89.4) 2,664 (10.6) 12,130 (91.4) 1,114 (8.6) 10,445 (87.0) 1,550 (13.0) Middle 16,657 (89.3) 1,969 (10.7) 8,524 (91.5) 777 (8.5) 8,133 (87.0) 1,192 (13.0) Low 18,451 (85.0) 3,212 (15.0) 9,982 (88.5) 1,276 (11.5) 8,469 (81.2) 1,936 (18.8)
Perceived happiness <0.001 <0.001 <0.001
Happiness 41,180 (93.7) 2,776 (6.3) 22,555 (94.8) 1,232 (5.2) 18,625 (92.3) 1,544 (7.7) Average happiness 13,920 (83.2) 2,823 (16.8) 6,734 (87.1) 998 (12.9) 7,186 (79.7) 1,825 (20.3) Unhappiness 2,583 (53.1) 2,246 (46.9) 1,347 (58.6) 937 (41.4) 1,236 (48.1) 1,309 (51.9) Sadness during the past
12 months <0.001 <0.001 <0.001
No 46,894 (95.6) 2,099 (4.4) 25,960 (96.5) 925 (3.5) 20,934 (94.6) 1,174 (5.4)
Yes 10,789 (65.2) 5,746 (34.8) 4,676 (67.7) 2,242 (32.3) 6,113 (63.3) 3,504 (36.7)
Smoking <0.001 <0.001 <0.001
Non-smoker 49,778 (88.7) 6,239 (11.3) 24,322 (91.4) 2,213 (8.6) 25,456 (86.2) 4,026 (13.8) Former smoker 4,690 (85.6) 809 (14.4) 3,639 (89.0) 471 (11.0) 1,051 (75.6) 338 (24.4) Current smoker 3,215 (80.0) 797 (20.0) 2,675 (84.5) 483 (15.5) 540 (62.3) 314 (37.7) Smoking amount,
cigarettes/day <0.001 <0.001 0.028
≤9 2,602 (81.9) 569 (18.1) 2,156 (86.4) 333 (13.6) 446 (64.5) 236 (35.5) 10-19 427 (79.3) 112 (20.7) 366 (83.0) 78 (17.0) 61 (60.7) 34 (39.3) ≥20 186 (63.0) 116 (37.0) 153 (68.4) 72 (31.6) 33 (47.8) 44 (52.2) Values are presented as number (%) using cross tabulation analysis in complex sampling design.
aCalculated by Rao-Scott chi-square test.
Table 2. Differences in suicidal ideation according to general characteristics
로 각각 통계적으로 유의한 차이를 보였다(P<0.001). 스트 레스와 슬픔/절망감 경험에 따른 자살생각도 통계적으로 유의한 차이를 보였는데, 스트레스를 인지하는 학생(14.4%)
이 인지하고 있지 않는 학생(2.7%)보다 자살생각 비율이 높 았고, 슬픔/절망감을 경험한 적이 있는 학생(34.8%)이 없는 학생(4.4%)보다 높은 자살생각을 보였다. 현재 흡연자 중
Variables
Total Boys Girls
Suicidal planningNo Yes Pa Suicidal planningNo Yes Pa Suicidal planningNo Yes Pa
School 0.019 0.613 <0.001
Middle school 30,835 (95.7) 1,384 (4.3) 16,115 (96.2) 627 (3.8) 14,720 (95.2) 757 (4.8) High school 32,059 (96.2) 1,250 (3.8) 16,414 (96.1) 647 (3.9) 15,645 (96.2) 603 (3.8)
Residence type <0.001 <0.001 <0.001
With family 59,883 (96.2) 2,380 (3.8) 30,924 (96.5) 1,120 (3.5) 28,959 (95.9) 1,260 (4.1) None 3,011 (91.2) 254 (8.8) 1,605 (90.0) 154 (10.0) 1,406 (92.8) 100 (7.2)
Economic status <0.001 <0.001 <0.001
High 23,274 (96.0) 970 (4.0) 12,798 (96.0) 526 (4.0) 10,476 (96.0) 444 (4.0) Middle 30,065 (96.8) 991 (3.2) 14,697 (97.0) 448 (3.0) 15,368 (96.5) 543 (3.5) Low 9,555 (93.4) 673 (6.6) 5,034 (94.2) 300 (5.8) 4,521 (92.6) 373 (7.4)
Perceived health <0.001 <0.001 <0.001
Healthy 45,796 (97.0) 1,437 (3.0) 25,189 (96.9) 819 (3.1) 20,607 (97.2) 618 (2.8) Average health 13,521 (95.0) 702 (5.0) 5,832 (95.5) 274 (4.5) 7,689 (94.6) 428 (5.4) Unhealthy 3,577 (87.5) 495 (12.5) 1,508 (88.3) 181 (11.7) 2,069 (86.8) 314 (13.2) Physical activity for a week,
days <0.001 0.030 <0.001
<1 22,937 (96.3) 880 (3.7) 9,092 (96.3) 349 (3.7) 13,845 (96.4) 531 (3.6)
1-4 31,506 (95.9) 1,338 (4.1) 17,158 (96.3) 647 (3.7) 14,348 (95.3) 691 (4.7)
≥5 8,451 (95.1) 416 (4.9) 6,279 (95.5) 278 (4.5) 2,172 (94.0) 138 (6.0)
Alcohol drinking <0.001 <0.001 <0.001
No 39,428 (96.8) 1,296 (3.2) 18,934 (97.0) 575 (3.0) 20,494 (96.6) 721 (3.4)
Yes 23,466 (94.7) 1,388 (5.3) 13,595 (95.1) 699 (4.9) 9,871 (94.0) 639 (6.0)
Drug experience <0.001 <0.001 <0.001
No 62,501 (96.2) 2,474 (3.8) 32,266 (96.4) 1,190 (3.6) 30,235 (96.0) 1,284 (4.0)
Yes 393 (69.7) 160 (30.3) 263 (74.2) 84 (25.8) 130 (62.3) 76 (37.7)
Perceived stress <0.001 <0.001 <0.001
No 12,936 (98.2) 225 (1.8) 8,468 (98.0) 167 (2.0) 4,468 (98.7) 58 (1.3)
Yes 49,958 (95.4) 2,409 (4.6) 24,061 (95.6) 1,107 (4.4) 25,897 (95.3) 1,302 (4.7)
Academic performance <0.001 <0.001 <0.001
High 24,337 (96.4) 902 (3.6) 12,792 (96.5) 452 (3.5) 11,545 (96.3) 450 (3.7) Middle 17,985 (96.6) 641 (3.4) 8,993 (96.7) 308 (3.3) 8,992 (96.5) 333 (3.5) Low 20,572 (94.9) 1,091 (5.1) 10,744 (95.3) 514 (4.7) 9,828 (94.4) 577 (5.6)
Perceived happiness <0.001 <0.001 <0.001
Happiness 42,959 (97.7) 997 (2.3) 23,206 (97.5) 581 (2.5) 19,753 (97.9) 416 (2.1) Average happiness 15,947 (95.4) 796 (4.6) 7,390 (95.6) 342 (4.4) 8,557 (95.2) 454 (4.8) Unhappiness 3,988 (82.5) 841 (17.5) 1,933 (84.4) 351 (15.6) 2,055 (80.7) 490 (19.3) Sadness during the past
12 months <0.001 <0.001 <0.001
No 48,304 (98.6) 689 (1.4) 26,502 (98.6) 383 (1.4) 21,802 (98.6) 306 (1.4)
Yes 14,590 (88.3) 1,945 (11.8) 6,027 (87.0) 891 (13.0) 8,563 (89.1) 1,054 (10.9)
Smoking <0.001 <0.001 <0.001
Non-smoker 54,046 (96.5) 1,971 (3.5) 25,678 (96.7) 857 (3.3) 28,368 (96.2) 1,114 (3.8) Former smoker 5,217 (95.1) 282 (4.9) 3,936 (96.0) 174 (4.0) 1,281 (92.5) 108 (7.5) Current smoker 3,631 (90.3) 381 (9.7) 2,915 (92.0) 243 (8.0) 716 (83.7) 138 (16.3)
Smoking amount <0.001 <0.001 <0.001
≤9 2,930 (92.4) 241 (7.6) 2,340 (93.9) 149 (6.1) 590 (86.5) 92 (13.5) 10-19 481 (88.9) 58 (11.1) 405 (90.9) 39 (9.1) 76 (78.8) 19 (21.2) ≥20 220 (72.4) 82 (27.6) 170 (74.1) 55 (25.9) 50 (67.7) 27 (32.3) Values are presented as number (%) using cross tabulation analysis in complex sampling design.
aCalculated by Rao-Scott chi-square test.
Table 3. Differences in suicidal planning according to general characteristics
20.0%가 자살생각을 한 적이 있었으며, 이는 비흡연자 11.3%, 과거 흡연자 14.4%와 유의한 차이를 보였다(P<0.001). 흡연량 은 20개비 이상 핀 학생 중 37.0%가 자살생각을 한 적이 있으 며, 9개비 이하, 10-19개비를 피운 학생 중 자살생각을 한 적 이 있다고 응답한 학생보다 각각 18.9%p, 16.3%p 더 높게 나
타났다(P<0.001).
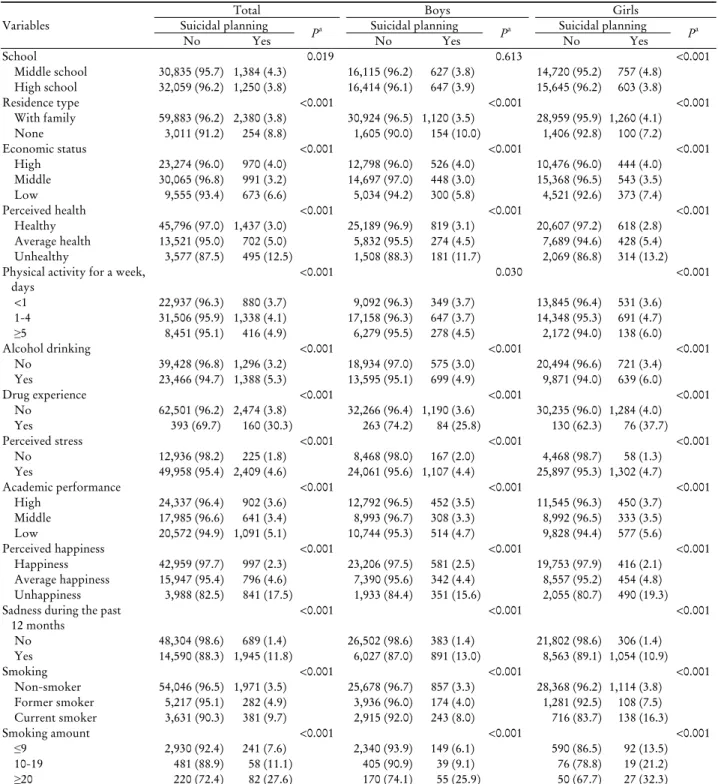
2) 일반적 특성에 따른 자살계획 및 자살시도의 차이 (Tables 3, 4)
거주형태, 경제상태, 주관적 건강 인지, 신체활동, 평생
Variables
Total Boys Girls
Suicidal attemptNo Yes Pa Suicidal attemptNo Yes Pa Suicidal attemptNo Yes Pa
School 0.001 0.145 <0.001
Middle school 31,399 (97.4) 820 (2.6) 16,432 (98.1) 310 (1.9) 14,967 (96.6) 510 (3.4) High school 32,599 (97.8) 710 (2.2) 16,705 (97.8) 356 (2.2) 15,894 (97.8) 354 (2.2)
Residence type <0.001 <0.001 0.002
With family 60,901 (97.8) 1,362 (2.2) 31,482 (98.2) 562 (1.8) 29,419 (97.4) 800 (2.6) None 3,097 (94.0) 168 (6.0) 1,655 (92.9) 104 (7.1) 1,442 (95.4) 64 (4.6)
Economic status <0.001 <0.001 <0.001
High 23,686 (97.7) 558 (2.3) 13,033 (97.8) 291 (2.2) 10,653 (97.5) 267 (2.5)
Middle 30,501 (98.2) 555 (1.8) 14,936 (98.5) 209 (1.5) 15,565 (97.8) 346 (2.2)
Low 9,811 (95.9) 417 (4.1) 5,168 (96.7) 166 (3.3) 4,643 (94.9) 251 (5.1)
Perceived health <0.001 <0.001 <0.001
Healthy 46,469 (98.4) 764 (1.6) 25,620 (98.5) 388 (1.5) 20,849 (98.3) 376 (1.7)
Average health 13,758 (96.7) 465 (3.3) 5,950 (97.3) 156 (2.7) 7,808 (96.2) 309 (3.8) Unhealthy 3,771 (92.2) 301 (7.8) 1,567 (91.8) 122 (8.2) 2,204 (92.5) 179 (7.5)
Physical activity for a week, days 0.003 0.088 <0.001
<1 23,307 (97.8) 510 (2.2) 9,256 (98.0) 185 (2.0) 14,051 (97.7) 325 (2.3)
1-4 32,072 (97.6) 772 (2.4) 17,470 (98.1) 335 (1.9) 14,602 (97.0) 437 (3.0)
≥5 8,619 (97.1) 248 (2.9) 6,411 (97.6) 146 (2.4) 2,208 (95.8) 102 (4.2)
Alcohol drinking <0.001 <0.001 <0.001
No 40,008 (98.2) 716 (1.8) 19,209 (98.4) 300 (1.6) 20,799 (98.0) 416 (2.0)
Yes 23,990 (96.7) 814 (3.3) 13,928 (97.3) 366 (2.7) 10,062 (95.8) 448 (4.2)
Drug experience <0.001 <0.001 <0.001
No 63,563 (97.8) 1,412 (2.2) 32,847 (98.1) 609 (1.9) 30,716 (97.5) 803 (2.5)
Yes 435 (77.8) 118 (22.2) 290 (83.2) 57 (16.8) 145 (68.9) 61 (31.1)
Perceived stress <0.001 <0.001 <0.001
No 13,031 (99.0) 130 (1.0) 8,544 (98.9) 941 (1.1) 4,487 (99.0) 39 (1.0)
Yes 50,967 (97.3) 1,400 (2.7) 24,593 (97.6) 575 (2.4) 26,374 (97.0) 825 (3.0)
Academic performance <0.001 <0.001 <0.001
High 24,731 (98.0) 508 (2.0) 12,992 (98.0) 252 (2.0) 11,739 (97.9) 256 (2.1)
Middle 18,275 (98.2) 351 (1.8) 9,156 (98.4) 145 (1.6) 9,119 (97.9) 206 (2.1)
Low 20,992 (96.8) 671 (3.2) 10,999 (97.5) 269 (2.5) 10,003 (96.0) 402 (4.0)
Perceived happiness <0.001 <0.001 <0.001
Happiness 43,440 (98.9) 516 (1.2) 23,526 (98.9) 261 (1.1) 19,914 (98.8) 255 (1.2) Average happiness 16,254 (97.1) 489 (2.9) 7,539 (97.6) 193 (2.4) 8,715 (96.8) 296 (3.2) Unhappiness 4,304 (88.9) 525 (11.1) 2,072 (90.2) 212 (9.8) 2,232 (87.7) 313 (12.3) Sadness during the past 12
months <0.001 <0.001 <0.001
No 48,690 (99.4) 303 (0.6) 26,751 (99.5) 134 (0.5) 21,939 (99.3) 169 (0.7)
Yes 15,308 (92.4) 1,227 (7.6) 6,386 (92.0) 532 (8.0) 8,922 (92.7) 695 (7.3)
Smoking <0.001 <0.001 <0.001
Non-smoker 54,932 (98.1) 1,085 (1.9) 26,114 (98.4) 421 (1.6) 28,818 (97.8) 664 (2.2) Former smoker 5,329 (96.9) 170 (3.1) 4,023 (97.8) 87 (2.2) 1,306 (94.2) 83 (5.8) Current smoker 3,737 (92.7) 275 (7.3) 3,000 (94.6) 158 (5.4) 737 (85.1) 117 (14.9)
Smoking amount cigarettes/day <0.001 <0.001 <0.001
≤9 3,017 (94.8) 154 (5.2) 2,407 (96.4) 82 (3.6) 610 (88.7) 72 (11.3) 10-19 488 (90.4) 51 (9.6) 410 (92.6) 34 (7.4) 78 (79.0) 17 (21.0) ≥20 232 (76.0) 70 (24.0) 183 (80.2) 42 (19.8) 49 (64.3) 28 (35.7) Values are presented as number (%) using cross tabulation analysis in complex sampling design.
aCalculated by Rao-Scott chi-square test.
Table 4. Differences in suicidal attempt according to general characteristics
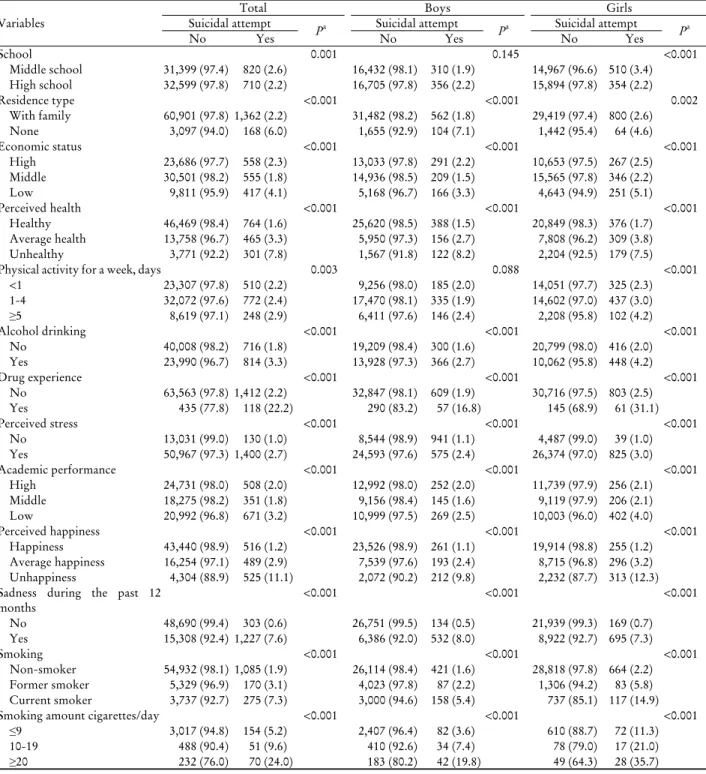
음주경험, 약물경험, 스트레스, 학업성적, 주관적 행복, 슬 픔/절망감 경험에 따른 자살계획 여부는 모두 유의한 차이 를 보였다(Table 3). 학교형태와 남학생의 신체활동에 따 른 자살시도의 차이를 제외하고는 자살시도에서도 모두 통계적으로 유의한 차이를 보였다(Table 4). 흡연량과의 관계에서는 20개비 이상 피우는 여학생 중 32.3%가 자살
계획을 세운 적이 있으며, 이는 9개비 이하(13.5%), 10-19개 비(21.2%)를 피우는 여학생과 통계적으로 유의한 차이를 보였다(P<0.001). 약물경험이 있는 학생 중 자살시도를 한 적이 있는 학생은 22.2%로 약물경험이 없는 학생 중 자살 시도를 한 적이 있는 학생(2.2%)보다 20.0%p 더 높게 나타 났으며, 유의한 차이를 보였다(P<0.001). ‘행복한 편이다’라
Variables Model 1a Model 2b Model 3c Model 4d Smoking
Total
Non-smoker 1 1 1 1
Former smoker 1.316 (1.207-1.435) 1.282 (1.174-1.401) 1.093 (0.996-1.199) 0.974 (1.873-1.086) Current smoker 1.958 (1.789-2.143) 1.841 (1.676-2.022) 1.402 (1.266-1.553) 1.143 (1.020-1.281)
Pe <0.001 <0.001 <0.001 0.046
Boys
Non-smoker 1 1 1 1
Former smoker 2.013 (1.724-2.352) 1.330 (1.192-1.484) 1.169 (1.042-1.312) 0.986 (0.859-1.132) Current smoker 3.767 (3.210-4.419) 1.898 (1.672-2.154) 1.507 (1.310-1.735) 1.125 (0.960-1.317)
P <0.001 <0.001 <0.001 0.303
Girls
Non-smoker 1 1 1 1
Former smoker 2.013 (1.724-2.352) 1.908 (1.629-2.235) 1.421 (1.204-1.678) 1.153 (0.959-1.386) Current smoker 3.767 (3.210-4.419) 3.384 (2.875-3.984) 2.166 (1.821-2.576) 1.634 (1.360-1.962)
P <0.001 0.000 <0.001 <0.001
Smoking amount, cigarettes/day Smoker
≤9 1 1 1 1
10-19 1.178 (0.911-1.524) 1.139 (0.880-1.475) 1.032 (0.799-1.333) 0.996 (0.739-1.344)
≥20 2.664 (2.032-3.493) 2.017 (1.503-2.708) 1.605 (1.164-2.212) 1.612 (1.123-2.314)
P <0.001 <0.001 0.014 0.030
Boys
≤9 1 1 1 1
10-19 1.298 (0.948-1.778) 1.252 (0.918-1.708) 1.148 (0.843-1.564) 1.117 (0.779-1.601)
≥20 2.934 (2.142-4.017) 2.221 (1.573-3.137) 1.764 (1.212-2.566) 1.849 (0.779 -1.601)
P <0.001 <0.001 0.012 0.021
Girls
≤9 1 1 1 1
10-19 1.177 (0.744-1.863) 1.202 (0.746-1.937) 1.095 (0.688-1.744) 0.947 (0.562-1.596)
≥20 1.985 (1.152-3.419) 1.693 (0.938-3.054) 1.378 (0.712-2.665) 1.143 (0.605-2.156)
P 0.047 0.215 0.633 0.873
Values are presented as adjusted odds ratio (95% confidence interval). Calculated by multivariate logistic regression analysis using complex sampling design.
aLogistic regression for suicidal ideation with smoking and smoking amount without adjustment.
bLogistic regression for suicidal ideation with smoking and smoking amount after adjustment for school, residence type, and economic status.
cLogistic regression for suicidal ideation with smoking and smoking amount after adjustment for school, residence type, economic status, per- ceived health, physical activity for a week, alcohol drinking, and drug experience.
dLogistic regression for suicidal ideation with smoking and smoking amount after adjustment for school, residence type, economic status, per- ceived health, physical activity for a week, alcohol drinking, drug experience, perceived stress, academic performance, perceived happiness, and sadness during the past 12 months.
eP values are obtained by F-test.
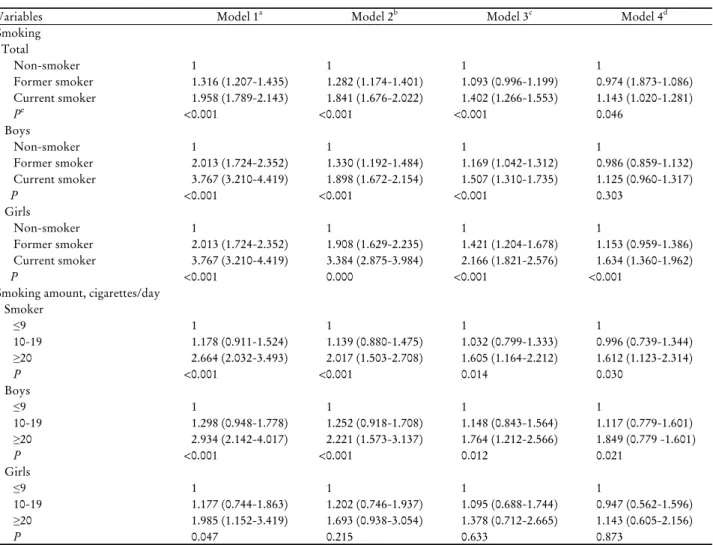
Table 5. Odds ratio for suicidal ideation according to smoking and daily smoking amount by logistic regression
고 응답한 여학생 중 자살시도를 한 적이 있는 여학생은 12.3%였고 ‘보통이다’, ‘불행한 편이다’라고 응답한 여학생 중 자살시도를 한 적이 있는 여학생이 각각 1.2%, 3.2%로 주관적 행복에 따른 자살시도의 차이는 통계적으로 유의하 였다(P<0.001). 20개비 이상 담배를 피운 전체 학생군에서 는 24.0%, 9개비 이하를 피운 군에서는 5.2%가 자살시도를 한 적이 있다고 응답하였고, 특히 여학생에서 20개비 이상 담배를 피운 학생(25.7%)이 9개비 이하를 피운 학생(11.3%) 보다 24.4%p 더 높게 자살시도를 한 적이 있다고 응답했으 며 이는 통계적으로 유의한 차이를 보였다(P<0.001).
3. 흡연 여부 및 흡연량과 자살 관련 행동과의 연관성
대상자의 흡연 여부 및 흡연량과 자살 관련 행동과의 연 관성을 알아보기 위하여 인구사회학적 요인, 건강상태 요 인, 정신건강 요인으로 나누어 혼란변수들을 통제하고 다 변량로지스틱회귀분석을 한 결과는 표 5-7과 같다. 단계적 으로 요인을 추가하여 분석하였으며, 모형 1은 통제 없이 분석하고, 모형 2는 인구사회학적 요인을 통제하고 분석하 였다. 모형 3은 인구사회학적 요인과 건강상태 요인을 통 제하고 분석하였으며, 모형 4는 인구사회학적 요인, 건강상 태 요인, 정신건강 요인을 통제하고 흡연 여부 및 흡연량과
Variables Model 1a Model 2b Model 3c Model 4d Smoking
Total
Non-smoker 1 1 1 1
Former smoker 1.403 (1.220-1.612) 1.434 (1.244-1.653) 1.180 (1.017-1.369) 1.061 (0.908-1.239) Current smoker 2.941 (2.614-3.310) 2.856 (2.529-3.225) 1.977 (1.710-2.286) 1.646 (1.421-1.907)
Pe <0.001 <0.001 <0.001 <0.001
Boys
Non-smoker 1 1 1 1
Former smoker 1.230 (1.035-1.462) 1.261 (1.056-1.507) 1.089 (0.903-1.312) 0.929 (0.765-1.129) Current smoker 2.574 (2.204-3.006) 2.496 (2.122-2.936) 1.840 (1.525-2.220) 1.405 (1.168-1.691)
P <0.001 <0.001 <0.001 <0.001
Girls
Non-smoker 1 1 1 1
Former smoker 2.083 (1.637-2.651) 2.103 (1.644-2.691) 1.485 (1.155-1.909) 1.223 (0.944-1.586) Current smoker 4.989 (4.061-6.129) 4.609 (3.734-5.690) 2.591 (2.003-3.351) 1.977 (1.510-2.587)
P <0.001 <0.001 <0.001 <0.001
Smoking amount, cigarettes/day Smoker
≤9 1 1 1 1
10-19 1.507 (1.086-2.092) 1.436 (1.036-1.989) 1.265 (0.907-1.763) 1.229 (0.871-1.735)
≥20 4.605 (3.420-6.202) 3.080 (2.214-4.285) 2.238 (1.501-3.337) 2.185 (1.460-3.268)
P <0.001 <0.001 <0.001 0.001
Boys
≤9 1 1 1 1
10-19 1.534 (1.031-2.285) 1.458 (0.984-2.162) 1.259 (0.838-1.892) 1.205 (0.789-1.842)
≥20 5.356 (3.787-7.574) 3.703 (2.505-5.474) 2.632 (1.628-4.257) 2.669 (1.642-4.341)
P <0.001 <0.001 <0.001 <0.001
Girls
≤9 1 1 1 1
10-19 1.719 (0.949-3.113) 1.712 (0.924-3.172) 1.468 (0.794-2.714) 1.433 (0.754-2.723)
≥20 3.047 (1.684-5.512) 2.061 (1.127-3.766) 1.557 (0.763-3.179) 1.525 (0.764-3.044)
P 0.001 0.026 0.297 0.334
Values are presented as adjusted odds ratio (95% confidence interval). Calculated by multivariate logistic regression analysis using complex sampling design.
aLogistic regression for suicidal planning with smoking and smoking amount without adjustment.
bLogistic regression for suicidal planning with smoking and smoking amount after adjustment for school, residence type, and economic status.
cLogistic regression for suicidal planning with smoking and smoking amount after adjustment for school, residence type, economic status, per- ceived health, physical activity for a week, alcohol drinking, and drug experience.
dLogistic regression for suicidal planning with smoking and smoking amount after adjustment for school, residence type, economic status, per- ceived health, physical activity for a week, alcohol drinking, drug experience, perceived stress, academic performance, perceived happiness, and sadness during the past 12 months.
eP values are obtained by F-test.
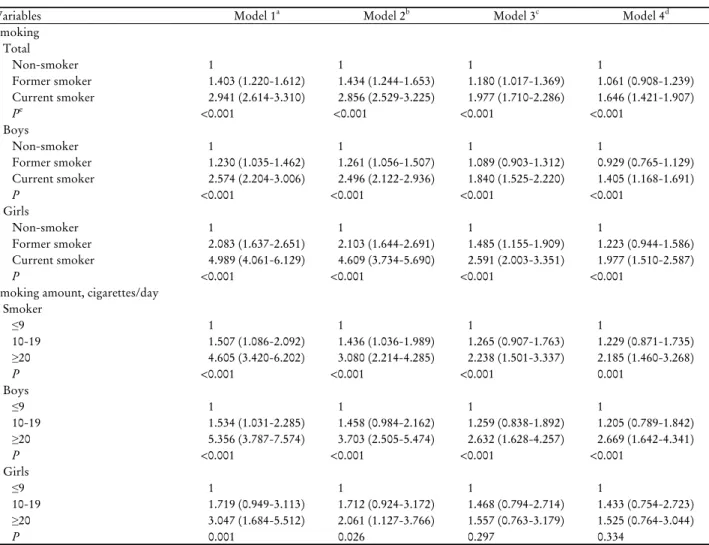
Table 6. Odds ratio for suicidal planning according to smoking and daily smoking amount by logistic regression
자살생각, 자살계획, 자살시도와의 연관성을 분석하였다.
또한 전체 학생과 남학생, 여학생을 나누어 분석하였다.
1) 흡연 여부 및 흡연량과 자살생각과의 연관성(Table 5) 흡연 여부와 자살생각과의 연관성을 알아보기 위해 요인 별 통제 없이 분석한 결과 비흡연자에 비해 과거 흡연자의 교차비는 1.316배(95% confidence interval [CI] 1.207-1.435), 현재 흡연자의 교차비는 1.958배(95% CI 1.789-2.143) 높은 것으로 나타났다. 여학생군에서 모든 요인을 통제하고 분 석한 결과 과거 흡연자의 교차비는 비흡연자에 비해 1.153배
(95% CI 0.959-1.386), 현재 흡연자의 교차비는 1.634배 (95% CI 1.360-1.962) 높았다. 흡연량과의 연관성은 모든 요인을 통제하고 분석한 결과, 9개비 이하에 비해 20개비 이상 피우는 학생의 교차비가 1.612배(95% CI 1.123-2.314) 높게 나타났으며, 특히 남학생군에서 9개비 이하에 비해 20개 비 이상 피우는 남학생이 1.849배(95% CI 1.200-2.850) 높 게 자살생각을 하는 것으로 나타났다. 여학생은 요인별 통 제 후 분석한 결과 흡연량이 자살생각에 통계적으로 유의 한 영향을 미치지 않는 것으로 나타났다.
Variables Model 1a Model 2b Model 3c Model 4d Smoking
Total
Non-smoker 1 1 1 1
Former smoker 1.598 (1.331-1.919) 1.683 (1.395-2.030) 1.359 (1.119-1.649) 1.211 (0.993-1.476) Current smoker 3.997 (3.454-4.625) 4.003 (3.454-4.640) 2.696 (2.262-3.212) 2.215 (1.853-2.646)
Pe <0.001 <0.001 <0.001 <0.001
Boys
Non-smoker 1 1 1 1
Former smoker 1.347 (1.045-1.736) 1.380 (1.057-1.802) 1.227 (0.936-1.609) 1.037 (0.788-1.364) Current smoker 3.472 (2.839-4.247) 3.268 (2.649-4.031) 2.500 (1.972-3.169) 1.882 (1.480-2.394)
P <0.001 <0.001 <0.001 <0.001
Girls
Non-smoker 1 1 1 1
Former smoker 2.684 (2.040-3.532) 2.868 (2.160-3.807) 1.865 (1.381-2.520) 1.540 (1.138-2.084) Current smoker 7.647 (6.112-9.568) 7.669 (6.109-9.627) 4.057 (3.053-5.391) 3.070 (2.287-4.121)
P <0.001 <0.001 <0.001 <0.001
Smoking amount, cigarettes/day Smoker
≤9 1 1 1 1
10-19 1.935 (1.348-2.779) 1.796 (1.254-2.573) 1.619 (1.140-2.300) 1.549 (1.069-2.244)
≥20 5.752 (4.022-8.228) 3.601 (2.417-5.364) 2.769 (1.741-4.402) 2.590 (1.658-4.047)
P <0.001 <0.001 <0.001 <0.001
Boys
≤9 1 1 1 1
10-19 2.102 (1.338-3.303) 1.968 (1.261-3.072) 1.744 (1.112-2.734) 1.702 (1.048-2.762)
≥20 6.535 (4.169-10.244) 4.074 (2.454-6.765) 2.975 (1.627-5.443) 2-758 (1.518-5.009)
P <0.001 <0.001 0.001 0.001
Girls
≤9 1 1 1 1
10-19 2.094 (1.137-3.856) 2.023 (1.064-3.845) 1.964 (1.063-3.631) 1.852 (0.985-3.481)
≥20 4.367 (2.370-8.045) 3.125 (1.620-6.025) 2.671 (1.252-5.696) 2.467 (1.223-4.978)
P <0.001 0.001 0.009 0.012
Values are presented as adjusted odds ratio (95% confidence interval). Calculated by multivariate logistic regression analysis using complex sampling design.
aLogistic regression for suicidal attempt with smoking and smoking amount without adjustment.
bLogistic regression for suicidal attempt with smoking and smoking amount after adjustment for school, residence type, and economic status.
cLogistic regression for suicidal attempt with smoking and smoking amount after adjustment for school, residence type, economic status, per- ceived health, physical activity for a week, alcohol drinking, and drug experience.
dLogistic regression for suicidal attempt with smoking and smoking amount after adjustment for school, residence type, economic status, per- ceived health, physical activity for a week, alcohol drinking, drug experience, perceived stress, academic performance, perceived happiness, and sadness during the past 12 months.
eP values are obtained by F-test.
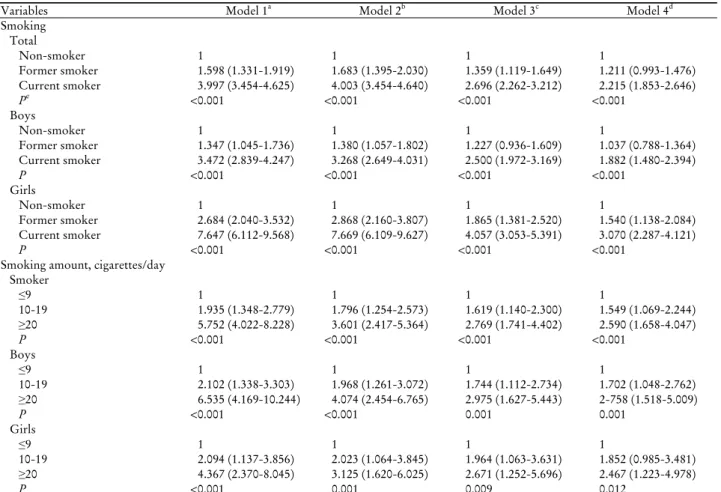
Table 7. Odds ratio for suicidal attempt according to smoking and daily smoking amount by logistic regression
2) 흡연 여부 및 흡연량과 자살계획과의 연관성(Table 6) 흡연 여부 및 흡연량과 자살계획과의 연관성을 알아보기 위해 로지스틱회귀분석을 한 결과는 표 6과 같다. 요인별 통제 없이 분석한 결과 비흡연자에 비해 과거 흡연자의 교 차비는 1.403배(95% CI 1.220-1.612), 현재 흡연자의 교차 비는 2.941배(95% CI 2.614-3.310) 높게 자살계획을 세운 적이 있는 것으로 나타났으며, 특히 여학생군에서는 비흡 연자에 비해 과거 흡연자가 2.083배(95% CI 1.637-2.651), 현재 흡연자가 4.989배(95% CI 4.061-6.129) 높게 자살계획 을 세운 적이 있는 것으로 나타났다. 모든 요인을 통제한 후 분석한 결과, 전체 학생군에서 자살생각에 대한 교차비 가 과거 흡연자는 1.061 (95% CI 0.908-1.239), 현재 흡연자 는 1.646 (95% CI 1.421-1.907)으로 나타났다. 흡연량과 자
살계획과의 연관성은 9개비 이하에 비해 10-19개비를 피우 는 학생군의 교차비가 1.229 (95% CI 0.871-1.735), 20개비 이상 피우는 학생군에서의 교차비가 2.185 (95% CI 1.460-3.268) 였고, 특히 남학생군에서 9개비 이하를 피우는 남학생에 비 해 10-19개비를 피우는 남학생이 1.205배(95% CI 0.789-1.842), 20개비 이상 피우는 남학생이 2.669배(95% CI 1.642-4.341) 높 게 자살계획을 세운 적이 있는 것으로 나타났다. 여학생군 에서는 모든 요인을 통제한 후 분석한 결과 흡연량과 자살 계획이 통계적으로 유의한 연관을 나타내지 않았다.
3) 흡연 여부 및 흡연량과 자살시도와의 연관성(Table 7) 모든 요인을 통제하고 흡연 여부와 자살시도와의 연관성 을 분석한 결과 비흡연자에 비해 과거 흡연자가 1.211배