INTRODUCTION
The ultrasound (US) appearance of testicular microli
thiasis (TM) was first described by Doherty et al. [1] in 1987. These microcalcifications can be identified on US as punctate, nonshadowing, echogenic foci [2]. The prevalence of TM has been reported to be between 2.4%–5.6% [35]. The prevalence of TM in symptomatic Korean men was found to be 6.0% with significant cooccurrence of TM, testicular
Changes of calcific density in pediatric patients with testicular microlithiasis
Bumjin Lim, Sang Hoon Song, Geehyun Song1, Kun Suk Kim
Department of Urology, Asan Medical Center, University of Ulsan College of Medicine, Seoul, 1Department of Urology, Kangwon National University Hospital, Chuncheon, Korea
Purpose: Testicular microlithiasis (TM) is a relatively rare clinical entity of controversial significance characterized by the existence of hydroxyapatite microliths located in the seminiferous tubules. The aim of this study was to observe the natural course of chang- es in the calcific density of pediatric TM.
Materials and Methods: We included a total of 23 TM patients undergoing scrotal ultrasound (US) on at least two occasions from July 1997 to August 2014. We retrospectively analyzed the patient characteristics, clinical manifestations, specific pathological fea- tures, and clinical outcomes. We measured the calcified area and compared the calcific density between the initial and final USs.
Results: The mean age at diagnosis was 11.3±4.6 years, and the follow-up period was 79.1±38.8 months (range, 25.4–152.9 months). During the follow-up period, no patients developed testicular cancer. Calcific density on US was increased in the last versus the initial US, but not to a statistically significant degree (3.74%±6.0% vs. 3.06%±4.38%, respectively, p=0.147). When we defined groups with increased and decreased calcification, we found that diffuse TM was categorized into the increased group to a greater degree than focal TM (10/20 vs. 4/23, respectively, p=0.049). In addition, five of eight cases of cryptorchidism (including two cases of bilateral cryptorchidism) were categorized in the increased calcification group.
Conclusions: Diffuse TM and cryptorchidism tend to increase calcific density. Close observation is therefore recommended for cases of TM combined with cryptorchidism and cases of diffuse TM.
Keywords: Cryptorchidism; Gonadoblastoma; Testicular microlithiasis
This is an Open Access article distributed under the terms of the Creative Commons Attribution Non-Commercial License (http://creativecommons.org/licenses/by-nc/3.0) which permits unrestricted non-commercial use, distribution, and reproduction in any medium, provided the original work is properly cited.
Received: 2 February, 2015 • Accepted: 25 February, 2015 Corresponding Author: Kun Suk Kim
Department of Urology, Asan Medical Center, University of Ulsan College of Medicine, 88 Olympic-ro 43-gil, Songpa-gu, Seoul 138-736, Korea TEL: +82-2-3010-3736, FAX: +82-2-477-8928, E-mail: [email protected]
ⓒ The Korean Urological Association, 2015
cancer, and infertility by Yee et al. [6]
Although the causeandeffect relationships are unclear, TM has been seen in patients with cryptorchi dism, varicoce
les, infertility, testicular torsion, Klinefelter syndrome, pul
mo nary alveolar microlithiasis, neurofibroma to sis, acqui red immunodeficiency syndrome, intratubular germ cell neo
plasia, and most importantly, primary testi cular neo plasms [7]. Several authors have also reported the association of TM with testicular cancer. Ikinger et al. [8] reported that
www.kjurology.org
Korean J Urol 2015;56:318-323.
http://dx.doi.org/10.4111/kju.2015.56.4.318 pISSN 2005-6737 • eISSN 2005-6745
74% of testes with tumors had associated ipsilateral TM on radiological inspection; whereas, only 8% of testicular spe ci mens with benign conditions had microcalcifications.
Although Chen et al. [9] reported that there was a significant difference in the rate of malignancy in males with TM com pared with those without TM, the question remains whether TM independently increases the risk of testicular malignancy in Taiwanese Men. Ikinger et al. [8], after reporting an association between TM and testicular tumor specimens, suggested in 1982 that radiographic studies be incorporated into diagnosing TM because of the perceived risk for testicular cancer in testicles with microlithiasis.
However, Ganem et al. [10] performed US followup in 9 of 22 patients with TM for a mean of 32 months without any newly developing tumors being diagnosed. Bennett et al.
[11] and Skyrme et al. [12] reported similar results; therefore, a regular scrotal US is controversial in asymptomatic TM patients. The current recommendations, including those of the European Association of Urology, are that the presence of microlithiasis alone is not an indication for a regular scrotal US in the absence of other risk factors (size<12 mL or atrophy, inhomogeneous parenchyma). TM is not an indication for biopsy or further US screening [1315].
However, there have been no reports describing the changes in calcification over time in pediatric patients with TM. We here report calcific density changes in pediatric TM and their natural course.
MATERIALS AND METHODS
The study protocol was approved by the Institutional Review Board of the Asan Medical Center. The medical
records from July 1997 to August 2014 of the Asan Medical Center, a tertiary referral center, were retrospectively screened for patients diagnosed with TM by scrotal US.
Twentythree TM patients were included who had under
gone scrotal US at least twice. We analyzed the patient characteristics, clinical manifestations, specific pathological features, and clinical outcomes. We measured the calcified
A
B
C
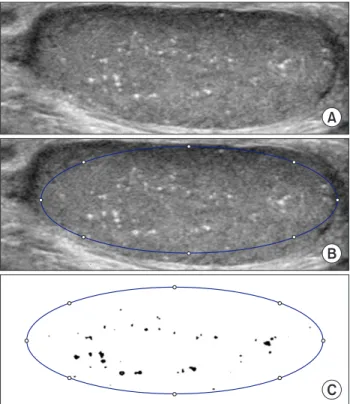
Fig. 1. Measuring method of calcified area. First choose maximum cross-sectional area in ultrasound (A), and define testis area (B) and calcified area by distinct color (C). Finally, calculate testis area and calcified area by image J (National Institutes of Health, Bethesda, MD, USA). Calcific density=calcified area/testis area.
Fig. 2. Focal type (A) and diffuse type (B) of testicular microlithiasis. At diagnosis, testis in maximal cross-sectional area was divided in to 9 sites. Pa- tients that showed microlithiasis in 3 or more sites were defined as diffuse and patients with microlithiasis in less than 3 sites were defined as focal.
Focal type
A B
Diffuse type
area in maximum crosssectional area, and we compared the calcific density in the initial diagnostic US and the final followup US. We defined the testis and the calcified area in terms of their maximal crosssectional area and calculated those areas using Image J software (National Institutes of Health, Bethesda, MD, USA) (Fig. 1). At diagnosis the maximal crosssectional area of the testis was divided into nine sections. Patients that showed microlithiasis in three or more sections were defined as diffuse type, and patients with microlithiasis in less than three sections were defined as focal type (Fig. 2). We classified the patients into three groups according to the change of microlithiasis: an increased group, ≥20% increase in microlithiasis; a decreased group, ≥20% decrease in microlithiasis; and a no change group, <20% increase or decrease.
Statistical analyses were performed using the PASW Statistics ver. 18.0 (SPSS Inc., Chicago, IL, USA). Differences were analyzed by a paired ttest, and crosstabs were used to assess dependent samples. In this study pvalues <0.05 were considered statistically significant.
RESULTS
The clinical characteristics of the patients are listed in Table 1. The mean age at presentation was 11.3±4.6 years, and the followup period (interval of fist US and last US) was 79.1±38.8 months (range, 25.4–152.9 months). The mean age at last followup was 17.8±5.8 years (range, 6.4–26.9 months).
Followup occurred for 19 of 23 patients over puberty (defined as >13 years old). Of the 23 patients 20 had bilateral TM, 2 patients had unilateral TM, and 1 patient had an atrophic testis. Scrotal US was performed an average of 3.5±1.5 times.
We included a total of 43 testes with TM in this study. The
most common comorbid condition was cryptorchidism (6 patients, 26.1%). Less frequent comorbid conditions included testicular torsion (3 patients, 13.0%), epididymitis (3 patients, 13.0%), varicocele (2 patients, 8.7%), hydrocele (2 patients, 8.7%), and epididymal cyst (2 patients, 8.7%).
Calcific density was increased at the last followup US compared with the initial US; however, this finding was not statistically different (3.74%±6.0% vs. 3.06%±4.38%, respec
tively, p=0.147). We divided the subjects into two groups (focal vs. diffuse) based on the distribution of TM. We classified 23 testes as having focal TM and 20 testes as having diffuse TM. In focal TM calcific density decreased but not significantly (0.72%±0.55% vs. 0.66%±1.03%, p=0.813). On the other hand, the calcific density of diffuse TM show a trend toward increase (5.8%±5.2% vs. 7.3%±7.4%, p=0.457) (Table 2) (Fig. 3).
To clarify the tendency of TM calcification toward increase vs. decrease we divided the subjects into three
Table 1. Clinical characteristics of the patients
Characteristic Value
Age (y) 17.8±5.8 (6.4–26.9)
Follow-up duration (mo) 79.1±38.8 (25.4–152.9) Bilateral/unilateral/atrophy 20/2/1 Comorbid condition (n=23)
Cryptorchidism 6 (26.1)
Testicular torsion 3 (13.0)
Epididymitis 3 (13.0)
Hydrocele 2 (8.7)
Varicocele 2 (8.7)
Epididymal cyst 2 (8.7)
Values are presented as mean±standard deviation (range) or number (%).
Table 2. Change of calcific density
First US Last US p-value
All (%) 3.06±4.38 3.74±6.0 0.147
Focal TM (%) 0.72±0.55 0.66±1.03 0.813
Diffuse TM (%) 5.8±5.2 7.3±7.4 0.457
Values are presented as mean±standard deviation.
US, ultrasound; TM, testicular microlithiasis.
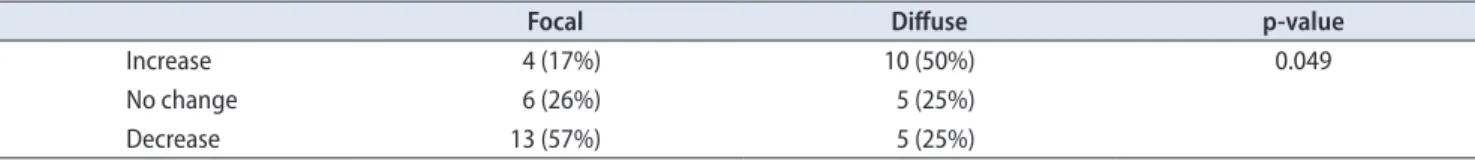
Table 3. Change of calcific density and distribution of testicular microlithiasis
Focal Diffuse p-value
Increase 4 (17%) 10 (50%) 0.049
No change 6 (26%) 5 (25%)
Decrease 13 (57%) 5 (25%)
The changes in the TM were defined as follows: increase, ≥20% increase in TM; decrease, ≥20% decrease in TM; no change, a increase or decrease
<20%.
groups based on the calcific density change of TM (increase:
increased >20%; decrease: decreased >20%; no change: <20%
increase or decrease). We categorized 14 testes as increased, 18 testes as decreased, and 11 testes as no change. Half of the patients with diffuse TM were assigned to the increased group, a proportion significantly higher than focal TM (10/20 [50%] in diffuse TM, 4/23 [17.4%] in focal TM, p=0.049) (Table 3). In addition, 5 of 8 testes with cryptorchidism (including
2 with bilateral cryptorchidism) were categorized into the increased group. However, there were no patients who developed testicular cancer or new abnormal symptoms.
DISCUSSION
Previous TM studies have focused only on the relation
ship between TM and testicular cancer, and not on the natu
Fig. 3. Change of calcific density demonstrated by the ultrasound image ([A] increase in diffuse type group and [B] decrease in focal type group) and by the bar graph (focal type [C] and diffuse type [D]).
A
B
C D
6 5 4 3 2 1
0
First Last
35 30 25 20 15 10 5 0
First Last
ral course of this disease progression. In our current study, we report the natural course of calcific density changes in pediatric TM during pubertal development. We found that diffuse TM and cryptorchidism are associated with increased calcific density. The mean age at presentation was 11.3 years and the mean followup period of approximately 5 years allowed followup of 23 patients over pubertal de
ve lopment. Despite a followup interval that allowed poten
tial pubertal changes to the testis, none of our patients de veloped testicular cancer or new abnormal symptoms. By contrast, there are some reported cases of patients with a known TM on US exam that eventually developed a pri
mary testicular cancer. McEniff et al. [16] reported a yolk sac tumor developing in a 17yearold boy being followed for bilateral TM that was originally detected because of an initial sonographic evaluation of unequal sized testes.
Winter et al. [17] reported the case of a man with TM seen on a sonograph performed due to bilateral testicular pain who presented three years later with a metastatic germ cell tumor of the left testicle. Although, an association between TM and subsequent testicular tumors appears likely, whether there is a true causeandeffect relationship remains unknown. However three other studies—Ganem et al. [10] (9 patients, 32 months), Skyrme et al. [12] (5 patients, 29 months), and Bennett et al. [11] (7 patients, 45 months)—
used US to follow patients with TM and, similarly to our present results, did not detect the appearance of new testi
cular tumors. Compared with these prior studies, our current study incorporates more patients and a longerterm follow
up extending through puberty.
An additional strength of our study over previous stu
dies is in our investigation of changes in calcified density of the TM. One earlier study has reported nonquantitative changes in the prominence of TM on yearly US follow
up. The TM was less prominent in one patient, unchanged in four, and two patients were lost to followup [18]. To our knowledge, our present study is the first report to provide a quantitative analysis of calcific density in TM. Calcific density on US showed a nonstatistically significant trend toward increase over time in our study subjects. Bennett et al. [11] reported a relationship between the number of microliths and testicular cancer after subgrouping subjects into four ranges based on the number of microliths. In our present study, we divided TM into two nearly equal groups based on the distribution pattern of calcification (focal type [23 testes] vs. diffuse type [20 testes]) that appear to differ in terms of calcification trends. Calcific density shows a trend toward a decrease in focal TM but toward an increase in 50% of the testes with diffuse TM. Notably, the majority of
testes (5/8) in our study series with cryptorchidism, including those with bilateral cryptorchidism, were categorized as being in the increased calcification group.
CONCLUSIONS
During the followup through puberty of the microlithia
sis in the 23 boys in our present study, we observed no sig
ni ficant changes in the density of their microliths and no development of testicular cancer; however, we found that diffuse TM and cryptorchidism tend to increase cal ci fic den
sity. Hence, close observation is recommended in cases of TM combined with cryptorchidism and diffuse micro lithia sis.
CONFLICTS OF INTEREST
The authors have nothing to disclose.
REFERENCES
1. Doherty FJ, Mullins TL, Sant GR, Drinkwater MA, Ucci AA Jr.
Testicular microlithiasis. A unique sonographic appearance. J Ultrasound Med 1987;6:389-92.
2. Hobarth K, Szabo N, Klingler HC, Kratzik C. Sonographic ap- pearance of testicular microlithiasis. Eur Urol 1993;24:251-5.
3. Goede J, Hack WW, van der Voort-Doedens LM, Sijstermans K, Pierik FH. Prevalence of testicular microlithiasis in asymptom- atic males 0 to 19 years old. J Urol 2009;182:1516-20.
4. Serter S, Gumus B, Unlu M, Tuncyurek O, Tarhan S, Ayyildiz V, et al. Prevalence of testicular microlithiasis in an asymptomatic population. Scand J Urol Nephrol 2006;40:212-4.
5. Hobarth K, Susani M, Szabo N, Kratzik C. Incidence of testicu- lar microlithiasis. Urology 1992;40:464-7.
6. Yee WS, Kim YS, Kim SJ, Choi JB, Kim SI, Ahn HS. Testicular microlithiasis: prevalence and clinical significance in a popula- tion referred for scrotal ultrasonography. Korean J Urol 2011;
52:172-7.
7. Rashid HH, Cos LR, Weinberg E, Messing EM. Testicular mi- crolithiasis: a review and its association with testicular cancer.
Urol Oncol 2004;22:285-9.
8. Ikinger U, Wurster K, Terwey B, Mohring K. Microcalcifica- tions in testicular malignancy: diagnostic tool in occult tumor?
Urology 1982;19:525-8.
9. Chen JL, Chou YH, Tiu CM, Chiou HJ, Wang HK, Chiou SY, et al. Testicular microlithiasis: analysis of prevalence and as- sociated testicular cancer in Taiwanese men. J Clin Ultrasound 2010;38:309-13.
10. Ganem JP, Workman KR, Shaban SF. Testicular microlithiasis is associated with testicular pathology. Urology 1999;53:209-
13.
11. Bennett HF, Middleton WD, Bullock AD, Teefey SA. Testicular microlithiasis: US follow-up. Radiology 2001;218:359-63.
12. Skyrme RJ, Fenn NJ, Jones AR, Bowsher WG. Testicular mi- crolithiasis in a UK population: its incidence, associations and follow-up. BJU Int 2000;86:482-5.
13. Jungwirth A, Giwercman A, Tournaye H, Diemer T, Kopa Z, Dohle G, et al. European Association of Urology guidelines on Male Infertility: the 2012 update. Eur Urol 2012;62:324-32.
14. Montgomery JS, Bloom DA. The diagnosis and management of scrotal masses. Med Clin North Am 2011;95:235-44.
15. Elzinga-Tinke JE, Sirre ME, Looijenga LH, van Casteren N,
Wildhagen MF, Dohle GR. The predictive value of testicular ultrasound abnormalities for carcinoma in situ of the testis in men at risk for testicular cancer. Int J Androl 2010;33:597-603.
16. McEniff N, Doherty F, Katz J, Schrager CA, Klauber G. Yolk sac tumor of the testis discovered on a routine annual sonogram in a boy with testicular microlithiasis. AJR Am J Roentgenol 1995;164:971-2.
17. Winter TC 3rd, Zunkel DE, Mack LA. Testicular carcinoma in a patient with previously demonstrated testicular microlithia- sis. J Urol 1996;155:648.
18. Dagash H, Mackinnon EA. Testicular microlithiasis: what does it mean clinically? BJU Int 2007;99:157-60.
![Fig. 3. Change of calcific density demonstrated by the ultrasound image ([A] increase in diffuse type group and [B] decrease in focal type group) and by the bar graph (focal type [C] and diffuse type [D]).](https://thumb-ap.123doks.com/thumbv2/123dokinfo/5241005.130558/4.918.86.833.96.889/change-calcific-demonstrated-ultrasound-increase-diffuse-decrease-diffuse.webp)
