Association between Obesity and Bone Mineral Density by Gender and Menopausal Status
Mohammad Reza Salamat1, Amir Hossein Salamat2, Mohsen Janghorbani3
1Department of Medical Physics and Medical Engineering, Isfahan University of Medical Sciences; 2Isfahan Osteoporosis Diagnosis and Body Composition Center; 3Isfahan Endocrine and Metabolism Research Center, Isfahan University of Medical Sciences, Isfahan, Iran
Background: We investigated whether there were gender differences in the effect of obesity on bone mineral density (BMD) based on menopausal status.
Methods: We assessed 5,892 consecutive patients 20 to 91 years old who were referred for dual-energy X-ray absorptiometry (DXA) scans. All subjects underwent a standard BMD scan of the hip (total hip and femoral neck) and lumbar spine (L1 to L4) using a DXA scan and body size assessment. Body mass index was used to categorize the subjects as normal weight, overweight, and obese.
Results: BMD was higher in obese and overweight versus normal weight men, premenopausal women, and postmenopausal wom- en. Compared to men ≥50 years and postmenopausal women with normal weight, the age-adjusted odds ratio of osteopenia was 0.19 (95% confidence interval [CI], 0.07 to 0.56) and 0.38 (95% CI, 0.29 to 0.51) for obese men ≥50 years and postmenopausal women. Corresponding summaries for osteoporosis were 0.26 (95% CI, 0.11 to 0.64) and 0.15 (95% CI, 0.11 to 0.20), respectively.
Compared to men <50 years and premenopausal women with normal weight, the age-adjusted odds ratio of low bone mass was 0.22 (95% CI, 0.11 to 0.45) and 0.16 (95% CI, 0.10 to 0.26) for obese men <50 years and premenopausal women, respectively.
Conclusion: Obesity is associated with BMD of the hip and lumbar spine and overweight and obese individuals have similar de- grees of osteoporosis. This result was not significantly different based on gender and menopausal status, which could be an impor- tant issue for further investigation.
Keywords: Body mass index; Bone density; Obesity paradox; Gender identity; Menopause
INTRODUCTION
With the increase in obesity and osteoporosis worldwide [1-3], an important discussion has developed and focused on whether being overweight and obese can have a detrimental or protec- tive effect on skeletal health. Both fat and bone cells originate
from the same bone marrow stem cells [4] and physical inactiv- ity and aging induces both obesity and osteoporosis [5]. In addi- tion, these two disorders synergistically induce functional im- pairments and physical disabilities [6] which suggest a complex effect of obesity on bone health.
Overweight and obesity can strengthen the bone, which may
Received: 24 March 2016, Revised: 13 August 2016, Accepted: 17 August 2016 Corresponding author: Mohsen Janghorbani
Isfahan Endocrine and Metabolism Research Center, Isfahan University of Medical Sciences, Khorram Avenue, Sedigheh Tahereh Research Complex, Isfahan 8187698191, Iran
Tel: +98-31-3233-4893, Fax: +98-31-3668-2509, E-mail: [email protected]
Copyright © 2016 Korean Endocrine Society
This is an Open Access article distributed under the terms of the Creative Com- mons Attribution Non-Commercial License (http://creativecommons.org/
licenses/by-nc/4.0/) which permits unrestricted non-commercial use, distribu- tion, and reproduction in any medium, provided the original work is properly cited.
decrease osteoporotic fracture risk by increasing bone mineral density (BMD), a well-known indicator for osteoporosis [3,7,8].
This protective effect of obesity is called the “obesity paradox”
or “reverse epidemiology” and has been controversial [9].
While some studies have shown that obesity is positively as- sociated with high bone mass [10-12] as a result of the obesity- related increased levels of leptin, insulin, and estrogen that stimulate bone growth and inhibit bone remodeling, several studies have reported that obesity was negatively associated with bone mass [13-17]. These studies, however, have been fo- cused on a specific gender, age, or site of measurement and few studies have compared the obesity paradox in men and pre- and postmenopausal women, even though patterns and occurrence of obesity, fat distribution, and osteoporosis are different be- tween men and women and between pre- and postmenopausal women [18,19]. Therefore, different associations may be ex- pected in men and pre- and postmenopausal women who have different lifestyles. Our study adds to this discussion by assess- ing the relationship between obesity and BMD among men, premenopausal women, and postmenopausal women who were referred for dual-energy X-ray absorptiometry (DXA) scans in Isfahan, Iran. We hypothesized that obesity would influence BMD and vary by gender and menopause status.
METHODS
Subjects
This was a cross-sectional study that consisted of 5,892 consec- utive non-institutionalized men and women (183 men <50 years, 409 men ≥50 years, 1,832 premenopausal women, 3,468 postmenopausal women) who were referred to the Isfahan Os- teoporosis Diagnosis and Body Composition Center for a DXA scan from 5 April 2014 to 30 November 2015, with a mean±
standard deviation (SD) age of 54.9±11.6 years (range, 20 to 91).
All individuals were in good health consistent with clinical med- ical evaluations. Some participants were excluded from this study due to lack of height or weight records. Participants who had cancer, severe hepatic, renal, thyroid, and parathyroid dis- ease or who used osteoporosis medication, oral contraceptives, or hormone replacement therapy were excluded. Pregnant and breast-feeding women were also excluded from the study. Meno- pause was defined as amenorrhea resulting in permanent cessa- tion of ovarian function for at least a year.
Ethics statement
This study was approved by the Isfahan University of Medical
Sciences’ Ethical Committee. This was a retrospective study based on a routine medical procedure, and additional written consent was not required. The data was processed and analyzed by authorized medical personnel only, the patients remained anonymous, and the information was de-identified prior to anal- ysis.
Anthropometric measurement
Height and weight were measured using a standard apparatus while bone densitometry measurements were performed.
Weight and height were measured to the nearest 0.1 kg and 0.5 cm, respectively, when the subjects wore light clothes and no shoes. Body mass index (BMI) was calculated as the ratio of weight (kg) to height squared (m2). Participants were catego- rized in three BMI groups according to World Health Organiza- tion criteria [20]: normal weight, BMI <25.0 kg/m2; over- weight, BMI 25 to 29.9 kg/m2; and obese, BMI ≥30 kg/m2. There were few participants with BMI <18.5 kg/m2 (n=52) and
≥40 kg/m2 (n=75) available for this study, and thus they were not analyzed separately.
Bone density and body composition
Measurements of BMD (g/cm2), bone mineral content (g) and body composition were made using a DXA (Norland XR-46 system, Coopersurgical, Fort Atchinson, WI, USA). The BMDs, and fat and lean masses of the lumbar spine (L1 to L4) and the hip region (total hip and femoral neck) were measured accord- ing to standard protocols. The BMD lumbar spine values were calculated as the means of values from L1 to L4. The scanner was calibrated daily against the standard calibration block sup- plied by the manufacturer to control for possible baseline drift.
T- and Z-scores were also obtained. T- and Z-scores were calcu- lated based on normal reference values of the age- and gender- matched Iranian group provided by the DXA system manufac- turer. A diagnosis of osteopenia for postmenopausal women and men ≥50 years was based on bone density between 1 and 2.5 SD below the mean value, and for osteoporosis was based on bone density 2.5 SD below the mean value for young adult white women aged 20 to 29 years at the lumbar spine (L1 to L4) and hip (total hip and femoral neck) based on T-scores [21]. We used the Z-scores (Z-score ≤–2.0) to diagnose low bone mass for premenopausal women and men <50 years. All the data were collected in consistency with the recommendations of the International Society for Clinical Densitometry [22]. Body composition was also measured with DXA, affording informa- tion on anatomical fat and lean mass. The body composition
measurements provided absolute values for each lean and fat mass (g).
Statistical analyses
Continuous and categorical variables are expressed as means with standard error (SE) or 95% confidence intervals (CIs) and percentages, respectively, unless otherwise specified. Pearson correlation, chi-square test, one-way analysis of variance, and binary logistic regression were used for analysis. Partial correla- tion analyses adjusting for age and BMI were performed to de- termine the linear relationship between the bone parameters and body composition separately by gender and menopause status.
Multivariate binary logistic regression was used to assess pre- dictors of osteoporosis/osteopenia in men ≥50 years and post- menopausal women and low bone mass in men <50 years and premenopausal women. Variable age was entered in the models as a continuous variable while BMI and gender were categori- cal. Age-adjusted means were also calculated and compared us- ing general linear models. All anthropometric or DXA measures were not included simultaneously in regression analysis to avoid any colinearity of these independent variables. All tests for statistical significance were two-tailed, and a P<0.05 was considered statistically significant for all tests. Statistical analy- sis was performed using IBM SPSS version 19.0 (IBM Co., Ar- monk, NY, USA).
RESULTS
Characteristics
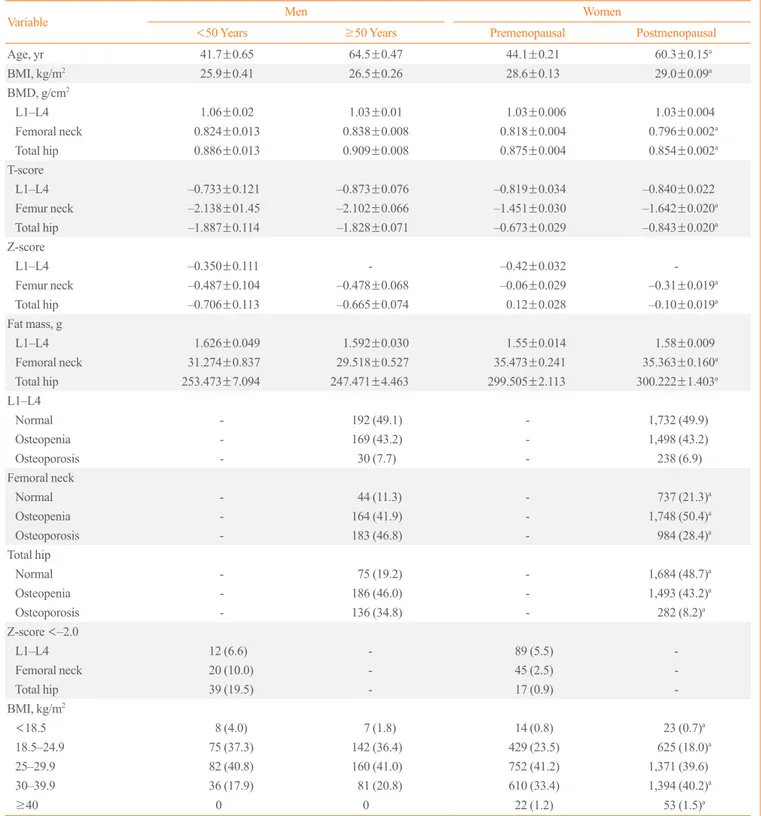
Differences in distribution of several anthropometric and densi- tometric measures among 183 men <50 years, 409 men ≥50 years, 1,832 premenopausal women, and 3,468 postmenopausal women are shown in Table 1. Men had higher age-adjusted total hip and femoral neck BMD, were less likely to be obese and had less fat mass than pre- and postmenopausal women. Men had lower age-adjusted total hip and femoral neck T- and Z- scores than pre- and postmenopausal women and had higher percentages of osteoporosis. The mean±SD age was 41.7±8.3 years for men <50 years, 64.5±9.7 for men ≥50 years, 44.1±
7.9 years for premenopausal women, and 60.3±8.3 years for postmenopausal women. The mean±SD BMI was 25.9±4.2 kg/m2 for men <50 years, 26.5±4.2 kg/m2 for men ≥50 years, 28.6±4.6 for premenopausal women, and 29.0±4.6 for post- menopausal women. A total of 82 (40.8%) of the men <50 years, 160 (41.0%) of men ≥50 years, 752 (41.2%) of the pre- menopausal women, and 1,371 (39.6%) of the postmenopausal
women were overweight and 36 (17.9%) of men <50 years, 81 (20.8%) of the men ≥50 years, 632 (34.8%) of the premeno- pausal women, and 1,447 (41.7%) of the postmenopausal wom- en were obese.
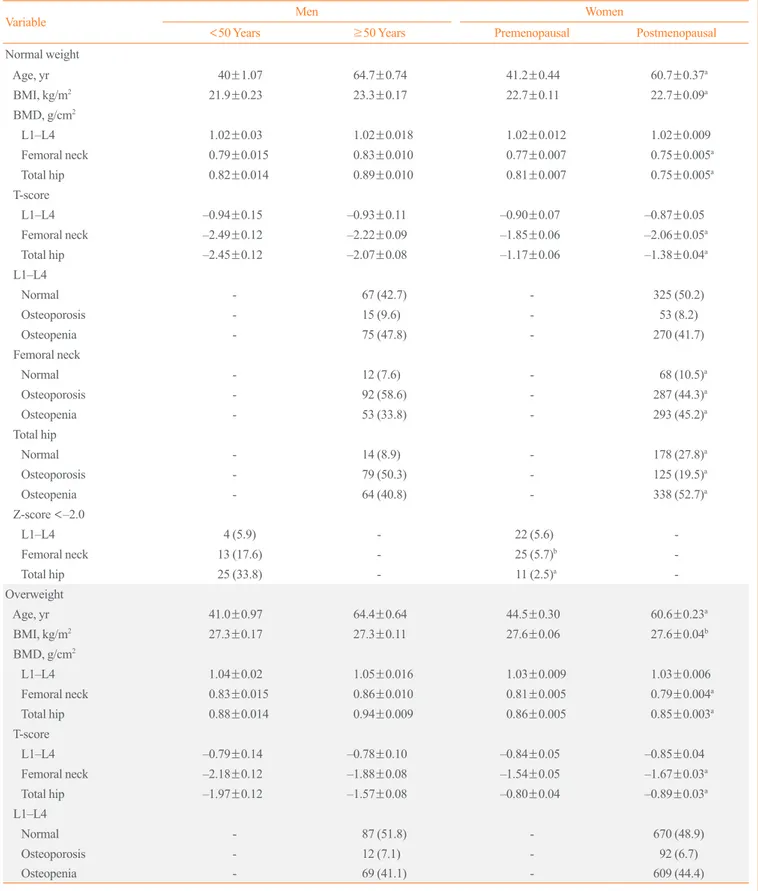
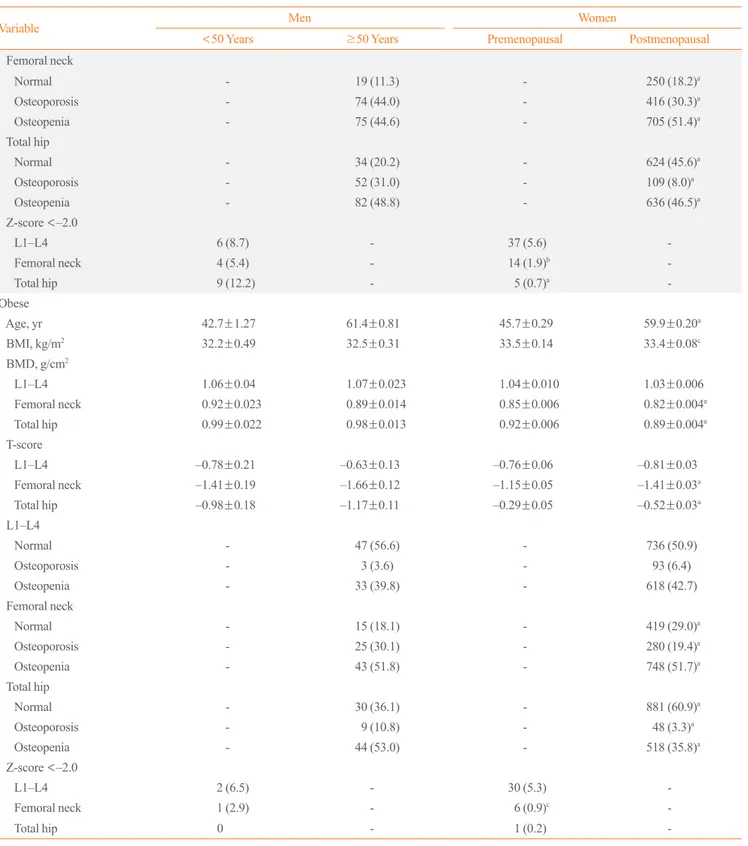
Characteristics of the 1,323 (22.5%) normal weight, 2,365 (40.2%) overweight and 2,196 (37.3%) obese participants are shown in Table 2. The age-adjusted mean BMI, weight, and to- tal hip and femoral neck BMDs were more likely to increase, and the proportion of osteoporosis was more likely to decrease across all three subject groups, regardless of gender and meno- pause status.
Low bone density prevalence
The DXA scan results indicated that 101 men (17.0%), 884 pre- menopausal women (48.3%), and 737 postmenopausal women (21.3%) had normal DXA scans. Of the 232 men, 443 premeno- pausal women, and 648 postmenopausal women who had a BMI
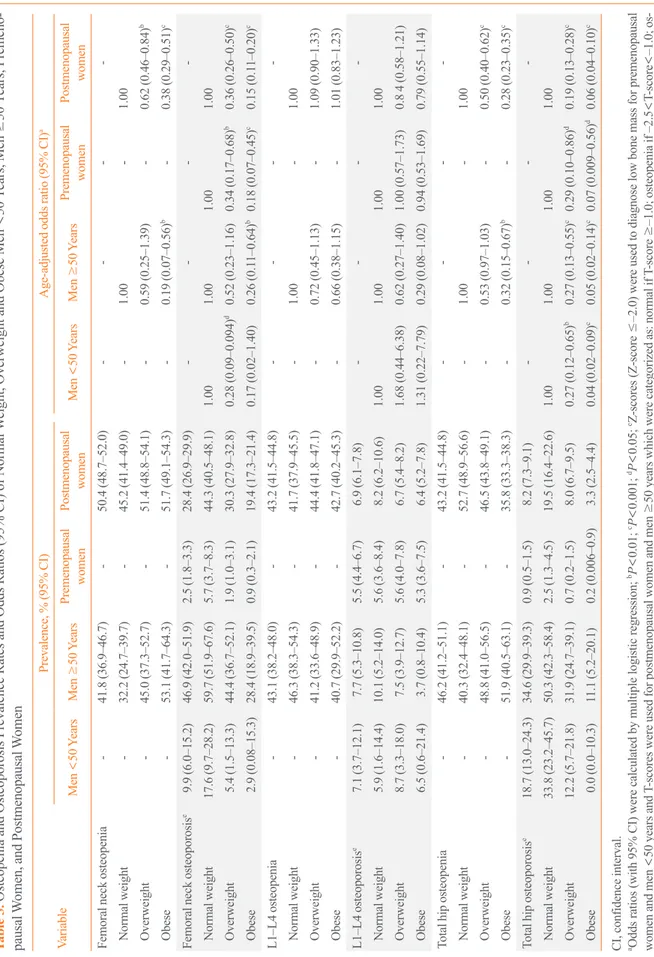
<25 kg/m2, 27 men (11.6%), 152 premenopausal women (34.3%), and 68 postmenopausal women (10.5%) had normal BMD values; this was lower than the percentage that was ob- served for men, premenopausal women, and postmenopausal women with a BMI ≥30 kg/m2, which were 27.4%, 59.3%, and 29.0%, respectively. The overall prevalence of femoral neck os- teopenia was 41.8% for men ≥50 years and 50.4% for post- menopausal women. Of the men ≥50 years and postmenopausal women who had a BMI <25 kg/m2, the prevalence of osteopenia was 32.2% and 45.2%, respectively. This was lower than the prevalence rates that were observed for men (53.1%) and post- menopausal women (51.7%) who had a BMI ≥30. The overall prevalence of osteoporosis was 46.9% for men ≥50 years and 28.4% for postmenopausal women. The prevalence of osteopo- rosis in men ≥50 years and postmenopausal women who had a BMI <25 kg/m2, was 59.7% and 44.3%, respectively. This was higher than the prevalence rates that were observed for men ≥50 years (28.4%) and postmenopausal women (19.4%) with a BMI
≥30 kg/m2 (P<0.001) (Table 3).
Obesity and bone mass
Compared with men ≥50 years, and postmenopausal women with a BMI <25 kg/m2, the age-adjusted risk of femoral neck osteoporosis was over 4-fold lower in those with a BMI ≥30 (odds ratio [OR], 0.26; 95% CI, 0.11 to 0.64 for men; and OR, 0.15; 95% CI, 0.11 to 0.20 for postmenopausal women). The as- sociation between BMI and osteopenia was similar (Table 3).
When a Z-score ≤–2.0 was used as alternative analysis to diag- nose low bone mass in premenopausal women and men <50
Table 1. Selected Anthropometric and Densitometric Measures of 183 Men <50 Years, 409 Men ≥50 Years, 1,832 Premenopausal Women, and 3,468 Postmenopausal Women
Variable Men Women
<50 Years ≥50 Years Premenopausal Postmenopausal
Age, yr 41.7±0.65 64.5±0.47 44.1±0.21 60.3±0.15a
BMI, kg/m2 25.9±0.41 26.5±0.26 28.6±0.13 29.0±0.09a
BMD, g/cm2
L1–L4 1.06±0.02 1.03±0.01 1.03±0.006 1.03±0.004
Femoral neck 0.824±0.013 0.838±0.008 0.818±0.004 0.796±0.002a
Total hip 0.886±0.013 0.909±0.008 0.875±0.004 0.854±0.002a
T-score
L1–L4 –0.733±0.121 –0.873±0.076 –0.819±0.034 –0.840±0.022
Femur neck –2.138±01.45 –2.102±0.066 –1.451±0.030 –1.642±0.020a
Total hip –1.887±0.114 –1.828±0.071 –0.673±0.029 –0.843±0.020a
Z-score
L1–L4 –0.350±0.111 - –0.42±0.032 -
Femur neck –0.487±0.104 –0.478±0.068 –0.06±0.029 –0.31±0.019a
Total hip –0.706±0.113 –0.665±0.074 0.12±0.028 –0.10±0.019a
Fat mass, g
L1–L4 1.626±0.049 1.592±0.030 1.55±0.014 1.58±0.009
Femoral neck 31.274±0.837 29.518±0.527 35.473±0.241 35.363±0.160a
Total hip 253.473±7.094 247.471±4.463 299.505±2.113 300.222±1.403a
L1–L4
Normal - 192 (49.1) - 1,732 (49.9)
Osteopenia - 169 (43.2) - 1,498 (43.2)
Osteoporosis - 30 (7.7) - 238 (6.9)
Femoral neck
Normal - 44 (11.3) - 737 (21.3)a
Osteopenia - 164 (41.9) - 1,748 (50.4)a
Osteoporosis - 183 (46.8) - 984 (28.4)a
Total hip
Normal - 75 (19.2) - 1,684 (48.7)a
Osteopenia - 186 (46.0) - 1,493 (43.2)a
Osteoporosis - 136 (34.8) - 282 (8.2)a
Z-score <–2.0
L1–L4 12 (6.6) - 89 (5.5) -
Femoral neck 20 (10.0) - 45 (2.5) -
Total hip 39 (19.5) - 17 (0.9) -
BMI, kg/m2
<18.5 8 (4.0) 7 (1.8) 14 (0.8) 23 (0.7)a
18.5–24.9 75 (37.3) 142 (36.4) 429 (23.5) 625 (18.0)a
25–29.9 82 (40.8) 160 (41.0) 752 (41.2) 1,371 (39.6)
30–39.9 36 (17.9) 81 (20.8) 610 (33.4) 1,394 (40.2)a
≥40 0 0 22 (1.2) 53 (1.5)a
Values are expressed as mean±SE or number (%). Age-adjusted means were calculated using general linear models. Z-scores (Z-score ≤–2.0) were used to diagnose low bone mass for premenopausal women and men <50 years and T-scores were used for postmenopausal women and men ≥50 years which were categorized as: normal if T-score ≥–1.0; osteopenia if –2.5<T-score<–1.0; osteoporosis if T-score ≤–2.5.
BMI, body mass index; BMD, bone mineral density.
aP<0.001.
Table 2. Selected Anthropometric and Densitometric Measures of 1,323 (22.5%) Normal Weight, 2,365 (40.2%) Overweight and 2,196 (37.3%) Obese Men <50 Years, Men ≥50 Years, Premenopausal Women, and Postmenopausal Women
Variable Men Women
<50 Years ≥50 Years Premenopausal Postmenopausal
Normal weight
Age, yr 40±1.07 64.7±0.74 41.2±0.44 60.7±0.37a
BMI, kg/m2 21.9±0.23 23.3±0.17 22.7±0.11 22.7±0.09a
BMD, g/cm2
L1–L4 1.02±0.03 1.02±0.018 1.02±0.012 1.02±0.009
Femoral neck 0.79±0.015 0.83±0.010 0.77±0.007 0.75±0.005a
Total hip 0.82±0.014 0.89±0.010 0.81±0.007 0.75±0.005a
T-score
L1–L4 –0.94±0.15 –0.93±0.11 –0.90±0.07 –0.87±0.05
Femoral neck –2.49±0.12 –2.22±0.09 –1.85±0.06 –2.06±0.05a
Total hip –2.45±0.12 –2.07±0.08 –1.17±0.06 –1.38±0.04a
L1–L4
Normal - 67 (42.7) - 325 (50.2)
Osteoporosis - 15 (9.6) - 53 (8.2)
Osteopenia - 75 (47.8) - 270 (41.7)
Femoral neck
Normal - 12 (7.6) - 68 (10.5)a
Osteoporosis - 92 (58.6) - 287 (44.3)a
Osteopenia - 53 (33.8) - 293 (45.2)a
Total hip
Normal - 14 (8.9) - 178 (27.8)a
Osteoporosis - 79 (50.3) - 125 (19.5)a
Osteopenia - 64 (40.8) - 338 (52.7)a
Z-score <–2.0
L1–L4 4 (5.9) - 22 (5.6) -
Femoral neck 13 (17.6) - 25 (5.7)b -
Total hip 25 (33.8) - 11 (2.5)a -
Overweight
Age, yr 41.0±0.97 64.4±0.64 44.5±0.30 60.6±0.23a
BMI, kg/m2 27.3±0.17 27.3±0.11 27.6±0.06 27.6±0.04b
BMD, g/cm2
L1–L4 1.04±0.02 1.05±0.016 1.03±0.009 1.03±0.006
Femoral neck 0.83±0.015 0.86±0.010 0.81±0.005 0.79±0.004a
Total hip 0.88±0.014 0.94±0.009 0.86±0.005 0.85±0.003a
T-score
L1–L4 –0.79±0.14 –0.78±0.10 –0.84±0.05 –0.85±0.04
Femoral neck –2.18±0.12 –1.88±0.08 –1.54±0.05 –1.67±0.03a
Total hip –1.97±0.12 –1.57±0.08 –0.80±0.04 –0.89±0.03a
L1–L4
Normal - 87 (51.8) - 670 (48.9)
Osteoporosis - 12 (7.1) - 92 (6.7)
Osteopenia - 69 (41.1) - 609 (44.4)
(Continued to the next page)
Table 2. Continued
Variable Men Women
<50 Years ≥50 Years Premenopausal Postmenopausal
Femoral neck
Normal - 19 (11.3) - 250 (18.2)a
Osteoporosis - 74 (44.0) - 416 (30.3)a
Osteopenia - 75 (44.6) - 705 (51.4)a
Total hip
Normal - 34 (20.2) - 624 (45.6)a
Osteoporosis - 52 (31.0) - 109 (8.0)a
Osteopenia - 82 (48.8) - 636 (46.5)a
Z-score <–2.0
L1–L4 6 (8.7) - 37 (5.6) -
Femoral neck 4 (5.4) - 14 (1.9)b -
Total hip 9 (12.2) - 5 (0.7)a -
Obese
Age, yr 42.7±1.27 61.4±0.81 45.7±0.29 59.9±0.20a
BMI, kg/m2 32.2±0.49 32.5±0.31 33.5±0.14 33.4±0.08c
BMD, g/cm2
L1–L4 1.06±0.04 1.07±0.023 1.04±0.010 1.03±0.006
Femoral neck 0.92±0.023 0.89±0.014 0.85±0.006 0.82±0.004a
Total hip 0.99±0.022 0.98±0.013 0.92±0.006 0.89±0.004a
T-score
L1–L4 –0.78±0.21 –0.63±0.13 –0.76±0.06 –0.81±0.03
Femoral neck –1.41±0.19 –1.66±0.12 –1.15±0.05 –1.41±0.03a
Total hip –0.98±0.18 –1.17±0.11 –0.29±0.05 –0.52±0.03a
L1–L4
Normal - 47 (56.6) - 736 (50.9)
Osteoporosis - 3 (3.6) - 93 (6.4)
Osteopenia - 33 (39.8) - 618 (42.7)
Femoral neck
Normal - 15 (18.1) - 419 (29.0)a
Osteoporosis - 25 (30.1) - 280 (19.4)a
Osteopenia - 43 (51.8) - 748 (51.7)a
Total hip
Normal - 30 (36.1) - 881 (60.9)a
Osteoporosis - 9 (10.8) - 48 (3.3)a
Osteopenia - 44 (53.0) - 518 (35.8)a
Z-score <–2.0
L1–L4 2 (6.5) - 30 (5.3) -
Femoral neck 1 (2.9) - 6 (0.9)c -
Total hip 0 - 1 (0.2) -
Values are expressed as mean±SE or number (%). Age-adjusted means were calculated using general linear models. Z-scores (Z-score ≤–2.0) were used to diagnose low bone mass for premenopausal women and men <50 years and T-scores were used for postmenopausal women and men ≥50 years which were categorized as: normal if T-score ≥–1.0; osteopenia if –2.5<T-score<–1.0; osteoporosis if T-score ≤–2.5.
BMI, body mass index; BMD, bone mineral density.
aP<0.001; bP<0.05; cP<0.01.
Table 3. Osteopenia and Osteoporosis Prevalence Rates and Odds Ratios (95% CI) of Normal Weight, Overweight and Obese Men <50 Years, Men ≥50 Years, Premeno- pausal Women, and Postmenopausal Women VariablePrevalence, % (95% CI)Age-adjusted odds ratio (95% CI)a Men <50 YearsMen ≥50 YearsPremenopausal womenPostmenopausal womenMen <50 YearsMen ≥50 YearsPremenopausal womenPostmenopausal women Femoral neck osteopenia-41.8 (36.9–46.7)-50.4 (48.7–52.0)---- Normal weight -32.2 (24.7–39.7)-45.2 (41.4–49.0)-1.00-1.00 Overweight -45.0 (37.3–52.7)-51.4 (48.8–54.1)-0.59 (0.25–1.39)-0.62 (0.46–0.84)b Obese -53.1 (41.7–64.3)-51.7 (49.1–54.3)-0.19 (0.07–0.56)b-0.38 (0.29–0.51)c Femoral neck osteoporosise9.9 (6.0–15.2)46.9 (42.0–51.9)2.5 (1.8–3.3)28.4 (26.9–29.9)---- Normal weight 17.6 (9.7–28.2)59.7 (51.9–67.6)5.7 (3.7–8.3)44.3 (40.5–48.1)1.001.001.001.00 Overweight 5.4 (1.5–13.3)44.4 (36.7–52.1)1.9 (1.0–3.1)30.3 (27.9–32.8)0.28 (0.09–0.094)d0.52 (0.23–1.16)0.34 (0.17–0.68)b0.36 (0.26–0.50)c Obese2.9 (0.08–15.3)28.4 (18.9–39.5)0.9 (0.3–2.1)19.4 (17.3–21.4)0.17 (0.02–1.40)0.26 (0.11–0.64)b0.18 (0.07–0.45)c0.15 (0.11–0.20)c L1–L4 osteopenia-43.1 (38.2–48.0)-43.2 (41.5–44.8)---- Normal weight -46.3 (38.3–54.3)-41.7 (37.9–45.5)-1.00-1.00 Overweight -41.2 (33.6–48.9)-44.4 (41.8–47.1)-0.72 (0.45–1.13)-1.09 (0.90–1.33) Obese -40.7 (29.9–52.2)-42.7 (40.2–45.3)-0.66 (0.38–1.15)-1.01 (0.83–1.23) L1–L4 osteoporosise7.1 (3.7–12.1)7.7 (5.3–10.8)5.5 (4.4–6.7)6.9 (6.1–7.8)---- Normal weight 5.9 (1.6–14.4)10.1 (5.2–14.0)5.6 (3.6–8.4)8.2 (6.2–10.6)1.001.001.001.00 Overweight 8.7 (3.3–18.0)7.5 (3.9–12.7)5.6 (4.0–7.8)6.7 (5.4–8.2)1.68 (0.44–6.38)0.62 (0.27–1.40)1.00 (0.57–1.73)0.8 4 (0.58–1.21) Obese6.5 (0.6–21.4)3.7 (0.8–10.4)5.3 (3.6–7.5)6.4 (5.2–7.8)1.31 (0.22–7.79)0.29 (0.08–1.02)0.94 (0.53–1.69)0.79 (0.55–1.14) Total hip osteopenia-46.2 (41.2–51.1)-43.2 (41.5–44.8)---- Normal weight -40.3 (32.4–48.1)-52.7 (48.9–56.6)-1.00-1.00 Overweight -48.8 (41.0–56.5)-46.5 (43.8–49.1)-0.53 (0.97–1.03)-0.50 (0.40–0.62)c Obese -51.9 (40.5–63.1)-35.8 (33.3–38.3)-0.32 (0.15–0.67)b-0.28 (0.23–0.35)c Total hip osteoporosise18.7 (13.0–24.3)34.6 (29.9–39.3)0.9 (0.5–1.5)8.2 (7.3–9.1)---- Normal weight 33.8 (23.2–45.7)50.3 (42.3–58.4)2.5 (1.3–4.5)19.5 (16.4–22.6)1.001.001.001.00 Overweight 12.2 (5.7–21.8)31.9 (24.7–39.1)0.7 (0.2–1.5)8.0 (6.7–9.5)0.27 (0.12–0.65)b0.27 (0.13–0.55)c0.29 (0.10–0.86)d0.19 (0.13–0.28)c Obese0.0 (0.0–10.3)11.1 (5.2–20.1)0.2 (0.006–0.9)3.3 (2.5–4.4)0.04 (0.02–0.09)c0.05 (0.02–0.14)c0.07 (0.009–0.56)d0.06 (0.04–0.10)c CI, confidence interval. aOdds ratios (with 95% CI) were calculated by multiple logistic regression; bP<0.01; cP<0.001; dP<0.05; eZ-scores (Z-score ≤–2.0) were used to diagnose low bone mass for premenopausal women and men <50 years and T-scores were used for postmenopausal women and men ≥50 years which were categorized as: normal if T-score ≥–1.0; osteopenia if –2.5<T-score<–1.0; os- teoporosis if T-score ≤–2.5.
years, the results were very similar to results of T-score ≤–2.5 comparisons.
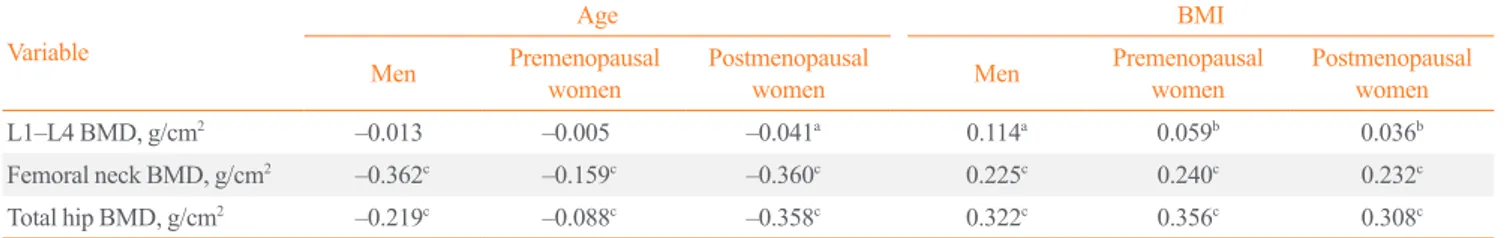
In men, premenopausal women, and postmenopausal women, there was a negative correlation between age and BMD indica- tors and a positive correlation between BMI and BMD indica- tors; the strongest correlation coefficients were between age and BMD in the femoral neck and the weakest correlations were be- tween age and L1 to L4 BMD (Table 4). The association be- tween age and BMD was stronger in postmenopausal women.
In men, premenopausal women, and postmenopausal women, the correlation between BMI and BMD indicators remained af- ter age-adjustment. The relationship between the bone BMD and body fat composition by gender and menopause status are shown in Table 5. Before adjusting for confounders, all regions of fat mass were positively correlated with BMD (data not shown).
After adjusting for both age and BMI, there was a significant negative correlation between all regions of fat mass and a posi- tive correlation between all regions of lean mass and bone BMD in both genders and with menopausal status. The associations between obesity, body fat composition and BMD, and correla- tions between the bone BMD and body fat composition in nor- mal weight, overweight, and obese individuals are also shown in Table 6. Similarly, there was a significant negative correlation between all regions of fat mass and a positive correlation be- tween all regions of lean mass and bone BMD in all BMI groups after adjusting for both age and BMI.
DISCUSSION
In this study, obesity significantly decreased the risk for osteo- porosis, osteopenia, and low bone mass in all participants. This study did not identify any influence of gender and menopause on the obesity paradox in osteoporosis, despite significant dif- ferences in characteristics between both genders and menopause
Table 4. Pearson Correlation Coefficients between Age and BMI and BMD Indicators in Men, Premenopausal Women, and Postmeno- pausal Women
Variable
Age BMI
Men Premenopausal
women Postmenopausal
women Men Premenopausal
women Postmenopausal women
L1–L4 BMD, g/cm2 –0.013 –0.005 –0.041a 0.114a 0.059b 0.036b
Femoral neck BMD, g/cm2 –0.362c –0.159c –0.360c 0.225c 0.240c 0.232c
Total hip BMD, g/cm2 –0.219c –0.088c –0.358c 0.322c 0.356c 0.308c
BMI, body mass index; BMD, bone mineral density.
aP<0.01; bP<0.05; cP<0.001.
Table 5. Partial Correlations between Body Composition and BMD after Adjusting for Age and Body Mass Index in Men, Premenopausal Women, and Postmenopausal Women
Body composition BMD, g/cm2
L1–L4 Femoral neck Total hip Men
Fat mass, g
Femoral neck –0.005 –0.170a –0.249a
L1–L4 0.138b 0.076 0.030
Total hip 0.048 –0.131b –0.226a
Lean mass, g
Femoral neck 0.030 0.136b 0.154a
L1–L4 0.265a 0.028 0.018
Total hip 0.119b 0.253a 0.245a
Premenopausal women Fat mass, g
Femoral neck 0.028 –0.045 –0.126a
L1–L4 0.075b 0.040 0.016
Total hip 0.027 0.005 –0.084b
Lean mass, g
Femoral neck 0.026 –0.036 0.009
L1–L4 0.253a –0.042 –0.009
Total hip 0.020 0.040 0.077b
Postmenopausal women Fat mass, g
Femoral neck 0.029 –0.176a –0.232a
L1–L4 0.102a –0.008 –0.032
Total hip 0.035c –0.103a –0.163a Lean mass, g
Femoral neck –0.008 0.082a 0.125a
L1–L4 0.201b 0.060b 0.092a
Total hip –0.003 0.199a 0.243a
BMD, bone mineral density.
aP<0.001; bP<0.01; cP<0.05.
status. The existence of the obesity paradox in osteoporosis re- mains controversial. Cui et al. [10] studied men and women in rural Korea and reported that fat mass may positively contribute to BMD only in postmenopausal women and older men, and Lekamwasam et al. [11] found similar results in a group of healthy, middle-aged, premenopausal women in Sri Lanka.
These findings correlated with the results of Salamat et al. [12]
which found that both BMI and weight are associated with BMD of the hip and vertebrae and that overweight and obesity reduced the risk for osteoporosis in Iranian men. Other authors have also confirmed the existence of the obesity paradox in os-
teoporosis [23-25]. Overall, obesity has a protective effect on osteoporosis because of the increase in bone density related to a higher body weight. While some authors have reported that the increase in adipose tissue was not beneficial for bone density [13-17,19], Taes et al. [13] reported that increased fat mass is associated with smaller bone size, which was in contrast with the established view that a high BMI is a protective factor for osteoporosis, whereas lean mass is a consistent positive deter- minant of bone size. Zhao et al. [14] showed that increasing fat mass may not have a beneficial effect on bone mass and Janicka et al. [15] showed similar results in a group of healthy sexually mature adolescents and young adults. Additionally, Chang et al.
[16] suggested that central obesity was negatively associated with osteoporosis in a population of older women. Other au- thors have also suggested that obesity may not protect against decreases in bone mass [26,27]. The inconsistencies between these results could be attributable to the specific study popula- tions (these studies have been focused on a specific gender, age, or site of measurement), genetic backgrounds, research designs, sampling methods, sample size, ethnicity, and methodological differences. Several studies have reported that there are poten- tial physiological mechanisms that may result in obesity para- doxes [14,28].
A small number of studies have enrolled both genders and in- cluded pre- and postmenopausal women to assess gender- and menopausal-based differences in the association between the obesity paradox and BMD. Our study enrolled both genders and both pre- and postmenopausal women and the results did not in- dicate any significant differences between the investigated groups, the obesity paradox and BMD. However, gender differ- ences and the association with obesity and BMD remain contro- versial. Katzmarzyk et al. [29] reported no gender differences between BMD and visceral adiposity tissue and abdominal sub- cutaneous tissue in African-American and white men and wom- en, which is consistent with our results, whereas another study found a positive association between fat mass and the femoral neck BMD in women, but no significant association in men [30]. In contrast, Kim et al. [31] found a reverse association be- tween waist circumference and the femoral neck BMD in both men and women. Ley et al. [19] reported that body fat distribu- tion is not similar between men and women and between pre- and postmenopausal women.
We also assessed the association between fat mass, lean mass and BMD before and after adjusting for age and BMI, and the results indicated that there was a negative association between fat mass and a positive association of lean mass with BMD; ad- Table 6. Partial Correlation between Body Composition and
BMD after Adjusting for Age and Body Mass Index in Normal, Overweight, and Obese Individuals
Body composition BMD, g/cm2
L1–L4 Femoral neck Total hip Normal weight
Fat mass, g
Femoral neck 0.036 –0.158a –0.235a
L1–L4 0.078b 0.045 0.031
Total hip 0.041 –0.112a –0.182a
Lean mass, g
Femoral neck 0.018 0.194a 0.210a
L1–L4 0.225a 0.023 0.026
Total hip 0.019 0.264a 0.290a
Overweight Fat mass, g
Femoral neck 0.008 –0.154a –0.226a
L1–L4 0.077a 0.009 –0.027
Total hip 0.010 0.121a –0.194a
Lean mass, g
Femoral neck 0.015 –0.157a 0.202a
L1–L4 0.225a –0.037 0.064
Total hip 0.038 0.216a 0.267a
Obese Fat mass, g
Femoral neck 0.042 –0.129a –0.184a
L1–L4 0.131a 0.013 –0.007
Total hip 0.045c –0.44c –0.118a
Lean mass, g
Femoral neck 0.029 0.074b 0.156a
L1–L4 0.228a 0.38 0.082a
Total hip 0.032 0.182a 0.241a
BMD, bone mineral density.
aP<0.001; bP<0.01; cP<0.05.
ditionally, the correlation between fat mass and BMD changed from positive to negative after adjusting for BMI in both gender and menopause status. Similarly, previous studies [14,32-35]
found a negative correlation between fat mass and BMD after adjusting for BMI, whereas several studies that did not adjust for body weight found a positive correlation between fat mass and BMD [11,23,24,35]. Fat mass is a major component of body weight. When the mechanical loading effect of body weight is statistically removed, fat mass is negatively correlated with bone mass. The negative effect of weight-adjusted fat mass on bone might be driven by higher levels of proinflammatory cytokines, which may up-regulate receptor activation of nuclear factor-κB ligand, leading to increased bone resorption and de- creased BMD [36]. In this study, obesity was more strongly cor- related with BMD at femoral sites, compared with those at the lumbar spine. Femoral sites are composed of relatively higher cortical bones than the lumbar spine [37]. Thus, these findings suggest that body composition parameters may have a greater effect on cortical bone than trabecular bone, similar to observa- tions by others. [33].
The obesity paradox may be partly elucidated by the lack of the discriminatory power of BMI to distinguish between lean mass and fat mass. Higher osteoporosis in the low BMI catego- ry may be attributable to the sarcopenic obesity that is charac- terized by low muscle mass [17]. Sarcopenia impairs insulin re- sistance and dysglycemia in both non-obese and obese individu- als. Many obese individuals have an increased fat mass and also increased muscle mass and fat does not have a protective effect on bone.
Our results showed that men ≥50 years had a higher preva- lence of osteoporosis than post-menopausal women and multi- ple factors may explain the gender-related prevalence of osteo- porosis. The higher prevalence of osteoporosis in men could be attributable, at least in part, to different dietary behaviors, age, smoking, different levels of calcium and vitamin D intake, or selection bias. However, we were unable to confirm a causal re- lationship for this occurrence; therefore, additional studies are necessary to elucidate these factors and relationships.
Our study includes results from real-life data that reflect actu- al body composition and BMD patterns in patients who were referred to our center and the study population included both men <50 and ≥50 years old, and pre- and postmenopausal women. Although this study had several results that provide a better understanding of gender and menopause differences in the relationship between the obesity paradox and BMD in Irani- an men, premenopausal women, and postmenopausal women,
there were some limitations. In this study, one potential source of bias is residual confounding due to the risk factors that we were unable to account for in our analysis (socioeconomic sta- tus, educational level, level of physical activity, smoking, alco- hol consumption, vitamin D status, sex hormone levels, and nu- trition). The study was not population-based; therefore, the study population may not include a clinical spectrum represen- tative of the population in the community. Clinic-based esti- mates of the prevalence of low bone mass are most likely to be affected by referral patterns. The study is cross-sectional and is limited in the ability to elucidate causal relationships. Another limitation is that BMI does not account for body fat distribution and we did not use other markers of obesity. However, this study offers new data from Iran, a developing country, which has been under-represented in past studies.
In summary, although obesity is documented as a major risk factor for developing cardiovascular and metabolic diseases and some cancers, a higher BMI may be associated with lower os- teoporosis. Our study provides additional evidence for the obe- sity paradox in individuals with osteoporosis. Finally, the obesi- ty paradox seems to have similar effects on osteoporosis in men, premenopausal women, and postmenopausal women, which could provide a basis for future investigations.
CONFLICTS OF INTEREST
No potential conflict of interest relevant to this article was re- ported.
ORCID
Mohsen Janghorbani http://orcid.org/0000-0003-3024-3380
REFERENCES
1. Rossner S. Obesity: the disease of the twenty-first century.
Int J Obes Relat Metab Disord 2002;26 Suppl 4:S2-4.
2. Hu FB. Overweight and obesity in women: health risks and consequences. J Womens Health (Larchmt) 2003;12:163-72.
3. Cummings SR, Nevitt MC, Browner WS, Stone K, Fox KM, Ensrud KE, et al. Risk factors for hip fracture in white women. Study of Osteoporotic Fractures Research Group. N Engl J Med 1995;332:767-73.
4. Rosen CJ, Klibanski A. Bone, fat, and body composition:
evolving concepts in the pathogenesis of osteoporosis. Am J Med 2009;122:409-14.
5. Kim CJ, Oh KW, Rhee EJ, Kim KH, Jo SK, Jung CH, et al.
Relationship between body composition and bone mineral density (BMD) in perimenopausal Korean women. Clin En- docrinol (Oxf) 2009;71:18-26.
6. Yamaguchi T, Kanazawa I, Yamamoto M, Kurioka S, Yam- auchi M, Yano S, et al. Associations between components of the metabolic syndrome versus bone mineral density and vertebral fractures in patients with type 2 diabetes. Bone 2009;45:174-9.
7. Ravn P, Cizza G, Bjarnason NH, Thompson D, Daley M, Wasnich RD, et al. Low body mass index is an important risk factor for low bone mass and increased bone loss in early postmenopausal women. Early Postmenopausal Intervention Cohort (EPIC) study group. J Bone Miner Res 1999;14:
1622-7.
8. Felson DT, Zhang Y, Hannan MT, Anderson JJ. Effects of weight and body mass index on bone mineral density in men and women: the Framingham study. J Bone Miner Res 1993;
8:567-73.
9. Shepherd JA. Is osteoporosis an obesity paradox? J Clin Den- sitom 2013;16:131-2.
10. Cui LH, Shin MH, Kweon SS, Park KS, Lee YH, Chung EK, et al. Relative contribution of body composition to bone mineral density at different sites in men and women of South Korea. J Bone Miner Metab 2007;25:165-71.
11. Lekamwasam S, Weerarathna T, Rodrigo M, Arachchi WK, Munidasa D. Association between bone mineral density, lean mass, and fat mass among healthy middle-aged pre- menopausal women: a cross-sectional study in southern Sri Lanka. J Bone Miner Metab 2009;27:83-8.
12. Salamat MR, Salamat AH, Abedi I, Janghorbani M. Rela- tionship between weight, body mass index, and bone miner- al density in men referred for dual-energy X-ray absorptiom- etry scan in Isfahan, Iran. J Osteoporos 2013;2013:205963.
13. Taes YE, Lapauw B, Vanbillemont G, Bogaert V, De Bac- quer D, Zmierczak H, et al. Fat mass is negatively associat- ed with cortical bone size in young healthy male siblings. J Clin Endocrinol Metab 2009;94:2325-31.
14. Zhao LJ, Liu YJ, Liu PY, Hamilton J, Recker RR, Deng HW. Relationship of obesity with osteoporosis. J Clin Endo- crinol Metab 2007;92:1640-6.
15. Janicka A, Wren TA, Sanchez MM, Dorey F, Kim PS, Mit- telman SD, et al. Fat mass is not beneficial to bone in adoles- cents and young adults. J Clin Endocrinol Metab 2007;92:
143-7.
16. Chang CS, Chang YF, Wang MW, Chen CY, Chao YJ,
Chang HJ, et al. Inverse relationship between central obesity and osteoporosis in osteoporotic drug naive elderly females:
the Tianliao Old People (TOP) Study. J Clin Densitom 2013;
16:204-11.
17. Stenholm S, Harris TB, Rantanen T, Visser M, Kritchevsky SB, Ferrucci L. Sarcopenic obesity: definition, cause and consequences. Curr Opin Clin Nutr Metab Care 2008;11:
693-700.
18. Lovejoy JC, Sainsbury A; Stock Conference 2008 Working Group. Sex differences in obesity and the regulation of ener- gy homeostasis. Obes Rev 2009;10:154-67.
19. Ley CJ, Lees B, Stevenson JC. Sex- and menopause-associ- ated changes in body-fat distribution. Am J Clin Nutr 1992;
55:950-4.
20. Physical status: the use and interpretation of anthropometry.
Report of a WHO Expert Committee. World Health Organ Tech Rep Ser 1995;854:1-452.
21. Assessment of fracture risk and its application to screening for postmenopausal osteoporosis. Report of a WHO Study Group. World Health Organ Tech Rep Ser 1994;843:1-129.
22. Hans D, Downs RW Jr, Duboeuf F, Greenspan S, Jankowski LG, Kiebzak GM, et al. Skeletal sites for osteoporosis diag- nosis: the 2005 ISCD Official Positions. J Clin Densitom 2006;9:15-21.
23. Reid IR, Ames R, Evans MC, Sharpe S, Gamble G, France JT, et al. Determinants of total body and regional bone min- eral density in normal postmenopausal women: a key role for fat mass. J Clin Endocrinol Metab 1992;75:45-51.
24. Reid IR, Plank LD, Evans MC. Fat mass is an important de- terminant of whole body bone density in premenopausal women but not in men. J Clin Endocrinol Metab 1992;75:
779-82.
25. Douchi T, Yamamoto S, Oki T, Maruta K, Kuwahata R, Na- gata Y. Relationship between body fat distribution and bone mineral density in premenopausal Japanese women. Obstet Gynecol 2000;95:722-5.
26. De Laet C, Kanis JA, Oden A, Johanson H, Johnell O, Del- mas P, et al. Body mass index as a predictor of fracture risk:
a meta-analysis. Osteoporos Int 2005;16:1330-8.
27. Hsu YH, Venners SA, Terwedow HA, Feng Y, Niu T, Li Z, et al. Relation of body composition, fat mass, and serum lip- ids to osteoporotic fractures and bone mineral density in Chinese men and women. Am J Clin Nutr 2006;83:146-54.
28. Shi YC, Baldock PA. Central and peripheral mechanisms of the NPY system in the regulation of bone and adipose tissue.
Bone 2012;50:430-6.
29. Katzmarzyk PT, Barreira TV, Harrington DM, Staiano AE, Heymsfield SB, Gimble JM. Relationship between abdomi- nal fat and bone mineral density in white and African Amer- ican adults. Bone 2012;50:576-9.
30. Taaffe DR, Cauley JA, Danielson M, Nevitt MC, Lang TF, Bauer DC, et al. Race and sex effects on the association be- tween muscle strength, soft tissue, and bone mineral density in healthy elders: the Health, Aging, and Body Composition Study. J Bone Miner Res 2001;16:1343-52.
31. Kim HY, Choe JW, Kim HK, Bae SJ, Kim BJ, Lee SH, et al.
Negative association between metabolic syndrome and bone mineral density in Koreans, especially in men. Calcif Tissue Int 2010;86:350-8.
32. Kim JH, Choi HJ, Kim MJ, Shin CS, Cho NH. Fat mass is negatively associated with bone mineral content in Koreans.
Osteoporos Int 2012;23:2009-16.
33. Ahn SH, Lee SH, Kim H, Kim BJ, Koh JM. Different rela- tionships between body compositions and bone mineral
density according to gender and age in Korean populations (KNHANES 2008-2010). J Clin Endocrinol Metab 2014;99:
3811-20.
34. Zhao LJ, Jiang H, Papasian CJ, Maulik D, Drees B, Hamil- ton J, et al. Correlation of obesity and osteoporosis: effect of fat mass on the determination of osteoporosis. J Bone Miner Res 2008;23:17-29.
35. Aghaei Meybodi H, Hemmat-Abadi M, Heshmat R, Rezaei Homami M, Madani S, Ebrahimi M, et al. Association be- tween anthropometric measures and bone mineral density:
population-based study. Iran J Public Health 2011;40:18-24.
36. Campos RM, de Piano A, da Silva PL, Carnier J, Sanches PL, Corgosinho FC, et al. The role of pro/anti-inflammatory adipokines on bone metabolism in NAFLD obese adoles- cents: effects of long-term interdisciplinary therapy. Endo- crine 2012;42:146-56.
37. Clarke B. Normal bone anatomy and physiology. Clin J Am Soc Nephrol 2008;3 Suppl 3:S131-9.