738 Korean Chem. Eng. Res., 56(5), 738-751 (2018)
https://doi.org/10.9713/kcer.2018.56.5.738 PISSN 0304-128X, EISSN 2233-9558
Thermal Oxidative Purification of Detonation Nanodiamond in a Gas-Solid Fluidized Bed Reactor
Jae Hoon Lee, Yong Suk Youn* and Dong Hyun Lee†
Department of Chemical Engineering, Sungkyunkwan University, 2066, Seobu-ro, Jangan-gu, Suwon-si, Gyeonggi-do, 16419, Korea
*NanoResource Co., Ltd, 1201, Star valley, 99, Digital-ro 9-gil, Geumcheon-gu, Seoul, 08510, Korea (Received 19 April 2018; Received in revised form 17 June 2018; accepted 4 July 2018)
Abstract − The effect of the reaction temperature and reaction time on the thermal oxidative purification quality of detonation nanodiamond (NDsoot) was investigated in a gas-solid fluidized bed reactor of a 0.10 m-ID × 1.0 m-high stainless steel column with zirconia beads (dSV= 99.2 µm). The carbon conversion increased with increasing the reac- tion temperature; however, when the reaction temperature was greater than 773 K, the carbon conversion did not increase. The content of sp3-hybridized carbon at the reaction temperature of 703 K barely changed when the reaction time was more than 30 minutes, but at 773 K, the content decreased as preferred. At 703 K, the purification quality increased with the increasing reaction time; however, at 773 K, the purification quality increased up to 30 minutes and then decreased rapidly.
Key words: Nanodiamond, Purification, Thermal oxidation, Fluidized bed reactor
1. Introduction
Nanodiamond can maintain excellent properties in the bulk state of a diamond, including hardness, Young’s modulus, biocompatibil- ity, optical and fluorescence characteristics, high-thermal conductiv- ity, high-electric resistance, and stability in chemical and severe conditions [1]. Because of these unique characteristics, many researchers have been studying and applying nanodiamond in various fields. It can be used in in vivo imaging applications, utilizing the benefits of the semiconductor quantum dots of fluorescence combined with advantages such as biocompatibility, non-toxicity, and surface chem- istry [2-4]. Nanodiamond and carbon onion have been used in the field of tribology as well as for lubrication such as lubricating ball bearings [5], added directly to the lubricant [6], and dispersion in grease or oil [7,8]. Nanodiamond has the potential for application in target therapy and in a broad range of therapeutics due to biocompat- ibility, dispersibility in water, and scalability [9-13] combined with imaging. Nanodiamond has also been studied in various areas such as protein mimicking [14-16], tissue scaffolds, and surgical implants [17-20].
Many methods can be used to synthesize nanodiamond, such as shock wave, detonation, and chemical vapor deposition (CVD) [21].
Among these, detonation can employ scale-up and can be used as a commercial method for mass production. To synthesize nanodia-
mond by the detonation synthesis method, high-explosive (such as Composition B [1]) with a negative oxygen balance (for example, a mix of 60 w% TNT(C6H2(NO2)3CH3) and 40 w% hexogen (C3H6N6O6)) is detonated in a closed reactor which can endure high temperature and high pressure [1,21]. At the high temperature and pressure con- ditions, carbon is more stable in the diamond phase than in the graph- ite phase, but when the temperature and pressure decrease, it is more stable in the graphite phase than in the diamond phase. Because of this phase shift of carbon, carbon vapor is crystallized on diamond crystal at the early stage of detonation synthesis; with time, the tem- perature and pressure decrease so that graphite is formed on, and covers, the synthesized nanodiamond. Following these synthesis steps, detonation nanodiamond (NDsoot) was made using the deto- nation synthesis method, forming a shape in which graphitic materi- als cover the nanodiamond, similar to the core-shell model. Therefore, these graphitic materials need to be eliminated and the nanodiamond to be used needs to be separated from the nanodiamond to be used.
Two major methods can be used for the purification of detonation nanodiamond: acidic treatment using liquid oxidants and thermal oxidation. First, the method of acidic treatment using liquid oxidants (such as HNO3, a mixture of H2SO4 and HNO3, K2Cr2O7 in H2SO4, KOH/KNO3, Na2O2, HNO3/H2O2 under pressure, or HClO4) [1,6,21,22]
has been used in various industries; however, a large amount of strong acid is needed in this method and acidic treatment causes many problems both economically and environmentally such as the high cost of acids and the dangerous handling of waste acids emitted from purification. In comparison, the thermal oxidation method [23- 25] is emerging as a suitable method for addressing the economic and environmental problems of acidic treatment by using gases such as oxygen in air or pure oxygen with ozone. However, in the case of
†To whom correspondence should be addressed.
E-mail: [email protected]
‡This article is dedicated to Prof. Yong Kang on the occasion of his retirement from Chungnam National University.
This is an Open-Access article distributed under the terms of the Creative Com- mons Attribution Non-Commercial License (http://creativecommons.org/licenses/by- nc/3.0) which permits unrestricted non-commercial use, distribution, and reproduc- tion in any medium, provided the original work is properly cited.
previous studies, researchers discussed and investigated oxidative purification process results which were obtained using small scale equipment such as a tube furnace and thermobalance [23,25]. A flu- idized bed reactor has many advantages in comparison with previ- ous thermal oxidation methods because it decreases the reaction time, is applicable for mass production by continuous processing since the particles are injected continuously, enables easy capture of the particles, and enables an increase in the mass of reaction since the reactant and medium are mixed well, increasing the contact surface areas of particles.
Therefore, the purpose of this study was to find the optimum con- ditions for the thermal oxidative purification method by analyzing the carbon conversion of detonation nanodiamond, the yield, and the sp3/sp2 ratio with various reaction conditions (reaction temperature, reaction gas flow rate, and reaction time) using a fluidized bed reac- tor. The variables and their range used in this study are the reaction temperature (703~873 K), gas flow rate (4.067 × 10⁻⁵~5.167 × 10⁻⁵ m3/s), and reaction time (0~120 min).
2. Materials and Methods
2-1. Experimental setups
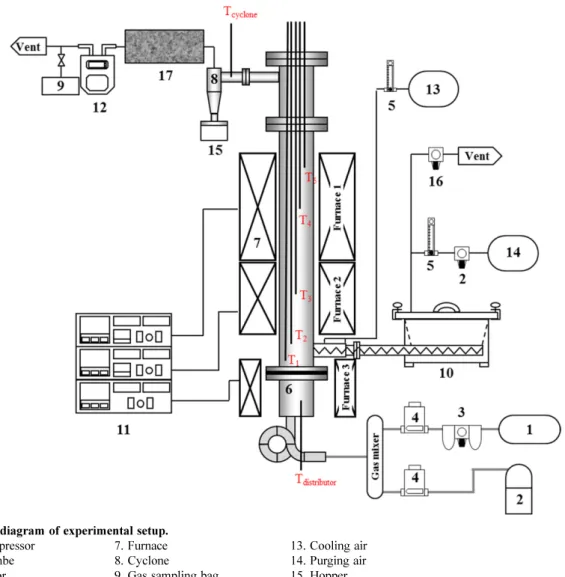
Fig. 1 shows the experimental setup of the fluidized bed reactor used in this study. The reactor was a stainless steel fluidized bed reactor with an inner diameter of 0.10 m and a height from the dis- tributor of 1.0 m. A sintered metal distributor (pore size ≈ 50 mm) was used to inject the oxidation gas uniformly into the reactor. Fur- naces were installed below the distributor to pre-heat the gases enter- ing the plenum chamber and reactor section and to develop the reaction temperature inside the reactor and in the media. A cyclone installed at the top of the reactor captured the entrained particles escaping the reactor. The particles that were not captured by the cyclone were captured by the filter to minimize the loss of particles.
The gas flow rate of the effluent gas passing through the filter was measured by the integrated flow meter and a sampling tap was installed to analyze the components of the effluent gas by gas chro- matography (GC) analysis. Reactant gases were injected using a mass flow controller (MFC), and the reactant material (detonation
Fig. 1. Schematic diagram of experimental setup.
1. Air compressor 7. Furnace 13. Cooling air
2. Gas bombe 8. Cyclone 14. Purging air
3. Regulator 9. Gas sampling bag 15. Hopper
4. Mass flow meter 10. Screw feeder 16. Back pressure regulator 5. Flowmeter 11. Furnace controller 17. Back filter
6. Distributor 12. Integrating flow meter
nanodiamond; NDsoot) was injected by a screw feeder at the height of 0.10 m from the upper side of the distributor, as shown in Fig. 1.
The cover of the screw feeder was sealed to prevent the leakage of gases and a back pressure regulator was installed at the top end of the cover to balance the pressure between the inside of the reactor and the feeder, which also prevents the countercurrent of media particles through the feeder. To maintain a low temperature of NDsoot before injecting inside the bed, a cooler was installed on the feeding line.
Five thermocouples installed inside the reactor checked the tempera- ture of the bed with an axial height; the thermocouples were located at 40 mm, 105 mm, 230 mm, 465 mm, and 665 mm above the dis- tributor.
To ensure good mixing and good heat transfer between NDsoot and the reactant gas inside the reactor, zirconia beads (ZBs), which have a chemically non-reactive characteristic at high-temperature, were used as the media particles. The injecting speed of NDsoot was maximized and the injecting time was minimized to ensure the same reaction time for all injected particles. The weight of the entrained particles outside the reactor for each experimental step was mea- sured. Three experimental steps were used as follows: the injecting step in which the NDsoot was injected into the reactor, the reaction step in which oxidative purification was progressed, and the entrain- ment step in which the completed oxidative purification samples were collected
The particle density (ρP), Sauter mean diameter, and minimum fluidizing gas velocity (Umf,ZB) of the ZBs used as the media parti- cles are 3,726 kg/m3, 99.2 mm, and 1.1 × 10⁻³ m/s, respectively. The bulk density (ρb) of NDsoot used as the reactant is 234.7 kg/m3.
Table 1 shows the result of the industrial analysis (proximate anal-
ysis) of NDsoot to determine the component weight fraction of the moisture, volatile component, fixed carbon, and ash. The result of analysis shows that NDsoot contains almost 85.4% of fixed carbon, 9.4% of volatile matter, and 5.21% of ash (metal impurities).
Carbon conversion is defined as the weight fraction of carbon emitted by the gas phase compared with the total injection weight.
Yield (YEnt) is defined as the weight reaction of the entrained weight at the entrainment step compared with the total injection weight.
(1)
Among all three steps, the particles collected at the entrainment step undergo the entire reaction process.
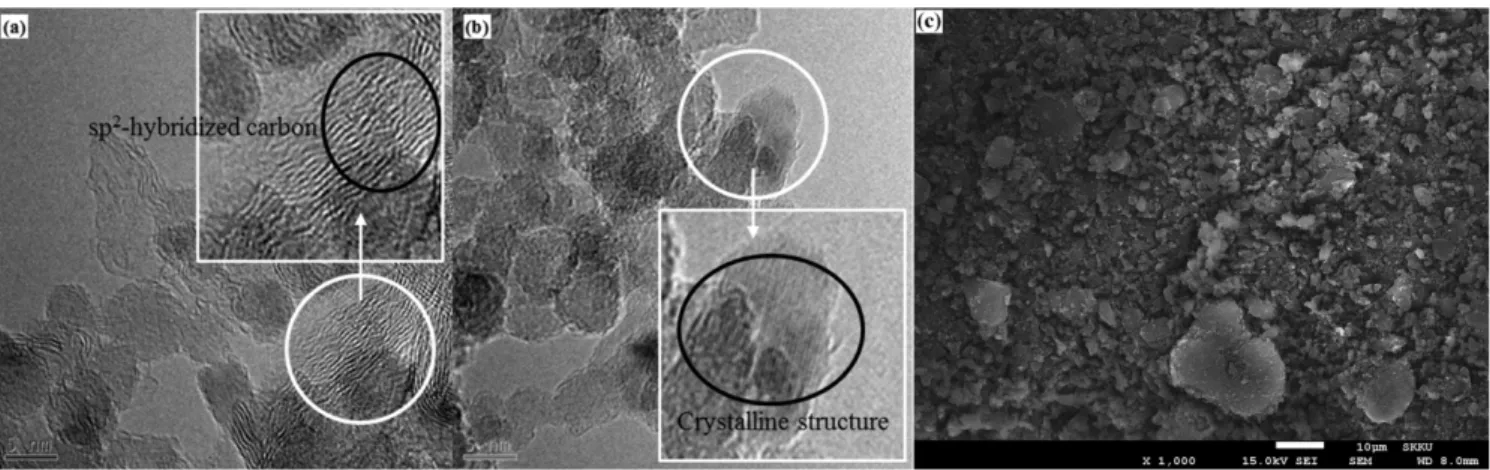
2-2. Shape of reference samples
Fig. 2 shows the TEM images of NDsoot and NDgray and the SEM image of NDsoot. From the TEM image of NDsoot in Fig.
2(a), the structures of sp2-hybridized carbon (carbon onion, amor- phous carbon, and graphite ribbon) and sp3-hybridized carbon (nan- odiamond) are detected [23]. However, in the TEM image of NDgray in Fig. 2(b), which was treated by the acid purification method, almost all of the samples are composed of sp3-hybridized carbon (nanodiamond) and their size is around 5 nm. In Fig. 2(c), almost all particles are a few micro meters in size and some are more than 10 μm in size. The strong van der Waals interacting force increases the size of the nanoscale particles to agglomerate and their sizes vary from many micrometers to tens of micrometers. For this reason, the entire process of the media fluidized bed reactor and pro- cesses of the experiment were designed so that there were no
TEnt WEnt WInj total, ---
=
Fig. 2. Transmission electron microscopy (TEM) images of (a) NDsoot and (b) NDgray. (c) Scanning electron microscopy (SEM) image of NDsoot.
Table 1. Proximate analysis of NDsoot
Sample name
Concentration (wt.%)
Moisture (Mar) Ash Volatile matter Fixed carbon
Aar Ad Var Vd FCar FCd
NDsoot 4.82 4.96 5.21 8.98 9.43 81.2 85.4
*Mar = Moisture as received; Aar = Ash as received; Ad = Ash dried; Var = Volatile matter as received; Vd = Volatile matter dried; FCar = Fixed Carbon as received; Vd = Fixed Carbon dried.
agglomerates in the reactor during the purification reaction time to ensure that the NDsoot inside the agglomerate would also be suffi- ciently reacted.
2-3. Experimental conditions
The superficial gas velocity for the thermal oxidation reaction in the fluidized beds should be determined not only to minimize the loss of particles escaping the reactor by entrainment, but also to flu- idize the media particles (ZBs) during the reaction time. The mini- mum fluidizing gas velocity of zirconia particles (Umf,ZB) is 1.1 × 10⁻³ m/s. To ensure a good mixing condition, the reacting gas velocity was 1.65 x 10⁻³ m/s (1.5 times of Umf,ZB). As shown in Fig. 2(c), the mean diameter of NDsoot is smaller than the Sauter mean diameter of ZB (dSV= 99.2 μm). The bulk density (ρb) of NDsoot is 234.7 kg/
m3, which is much smaller than that of ZB (ρb= 2,040 kg/m3), so that it can be fully fluidized with a gas velocity of 1.65 × 10⁻³ m/s.
During the experiments (Exp. #1 - #4), to maintain the same mole ratio between NDsoot and the reacting gas (O2), the volumetric gas flow rate of the injected gas was fixed at 5.167 × 10⁻⁵ m3/s, which can give a superficial gas velocity of 1.62 × 10⁻² m/s based on the temperature of 773 K. In Exp. #5 - #12, the superficial gas velocity of reactant gas was fixed at 1.30 × 10⁻³ m/s to minimize the loss of entrained parti- cles caused by the gas flow; and the ZBs can be fully fluidized at this gas velocity. When the oxidative purification was completed, the gas velocity for collecting the purified NDsoot was increased. The value of TDH was 0.584 m when the gas velocity of the reaction condition was 1.65 × 10⁻³ m/s. shows the operating conditions for the thermal oxidative reaction.
2-4. Temperature profiles
Fig. 3 shows the recorded temperature during Exp. #8 shown in Table 2. Temperatures were recorded during the experiments from the start of the injection of NDsoot to the collection of the samples by entrainment. The temperatures were recorded for the following com- ponents: each part of the reactor (furnace, distributor, and cyclone in Fig. 3(a)) and the axial-position inside of the reactor column (T1, T2, T3, T4, and T5 in Fig. 3(b)). Steps E-I, E-II, and E-III represents the injection steps for NDsoot, oxidative purification reaction step, and
entrainment step, respectively. Fig. 3(a) shows the temperature pro- file for each apparatus. When the experiment steps were changed, the temperature of the cyclone decreased for a moment and then increased. This is because the reactant gas flow was shut down for measuring the weight of the entrained particles during each experi- mental step. In step E-III, the temperature of the distributor decreased, and the temperature of the cyclone increased because the volumetric flow rate of the injecting gas was increased (4.47 × 10⁻⁵ m3/s to 35.2 Fig. 3. (a) Temperature profiles of apparatus sections (furnaces,
distributor, and cyclone) and (b) reacting section from start (injecting NDsoot) to end (entrainment) of Exp. 8.
Table 2. Operating conditions for the thermal oxidation experiment
Exp. # 1 2 3 4 5 6 7 8 9 10 11 12
T setting TRxn K 673 703 773 873 703 703 703 703 773 773 773 773
Gas cond.
Reaction gas - Air Air Air Air Air Air Air Air Air Air Air Air
U0,Trxn (× 10-3) m/s 1.65 1.50 1.65 1.87 1.3 1.3 1.3 1.3 1.3 1.3 1.3 1.3
Vin,298K (× 10-3) m3/s 5.167 5.167 5.167 5.167 4.467 4.467 4.467 4.467 4.067 4.067 4.067 4.067
Media
Particle - ZB ZB ZB ZB ZB ZB ZB ZB ZB ZB ZB ZB
WZB kg 5 5 5 5 5 5 5 5 5 5 5 5
HS m 0.30 0.30 0.30 0.30 0.3 0.3 0.3 0.3 0.3 0.3 0.3 0.3
Feeder Inj. speed rpm 30 30 30 30 90 90 90 90 90 90 90 90
PBPR (× 106) Pa 0.005 0.005 0.005 0.005 0.005 0.005 0.005 0.005 0.005 0.005 0.005 0.005
Exp. Time
tNDsoot min 30 30 30 30 5 5 5 5 5 5 5 5
tRxn min 70 70 70 70 15 30 60 120 15 30 60 120
tEnt min 60 60 60 60 60 60 60 60 60 60 60 60
× 10-5 m3/s) for the entrained and collected purified particles after the reaction had finished. Fig. 3(b) shows the recorded temperatures of the T1, T2, T3, T4, and T5 thermocouples, which were located at 40, 105, 230, 465, and 665 mm above the distributor, respectively. T1 and T2 were submerged in the ZB media bed and their temperatures were similar because the media was fully fluidized during the experi- ment. T3 was located near the surface of the media bed so that its temperature changes followed the temperature changes of furnace 2 and thus differed from the temperature changes of T1 and T2. Also, the change of the temperature in step E-III was smaller to that in step E-II due to the increasing volumetric gas flow rate of the injecting gas in the entrainment step (E-III). The temperature change of T4 and T5 followed that of furnace 1 because these thermocouples were located higher above the bed surface than the other thermocouples.
In the reaction step (E-II), the data of the T1 and T2 thermocouples were measured to determine the temperature of the ZB media where the reaction occurred. Their average temperatures were 702 and 700 K, respectively, which were similar to the setting temperature in Exp.
#8 of 703 K. Therefore, the temperature inside the reactor was steadily maintained during the gas phase oxidative purification pro- cess.
2-5. Analysis
2-5-1. X-ray Photoelectron Spectroscopy (XPS)
XPS was performed on an ESCA2000 (VG Microtech). The source of X-ray was Al ka (1,486.6 eV) / Mg ka (1253.6 eV). Wide scan surveys were taken at an analyzer pass energy of 50 eV and nar- row high resolution scans were taken at 20 eV. The wide scan sur- veys were processed at the range of 1100~0 eV with 1.0 eV steps.
Narrow higher resolution scans were processed with 0.05 eV steps.
The base pressure in the analysis chamber was below 10-10 torr and was maintained below 10-9 torr during the analysis.
2-5-2. Proximate analysis
Proximate analysis was performed on a proximate analysis of coal device (5E-MACIV, Chungshakaiyuan Instrument Co., LTD, China).
The heating rate of the furnace was 30~45 K/min, the temperature control precision was ±5 K, and the mass balance sensitivity was 0.1 mg.
To eliminate the moisture in the samples, the N2 gas condition of 376 K was maintained for 45 min. After the demoisturizing step, the tem- perature was increased to 1,223 K and was maintained for 7 min to eliminate the volatile matter and then the samples were cooled to room temperature for remeasuring the weight of the samples. Finally, the temperature was increased from room temperature to 1,023 K and maintained for 60 min while the gas condition of N2 was changed to air and the fixed carbon in the samples was eliminated for the analysis.
2-5-3. Thermogravimetric Analysis (TGA)
TGA was performed on both a DSC 7020 (SEICO INST.) and a TGA 1000 (DaeDuk). In the case of the DSC 7020, two analysis con- ditions were used: under non-isothermal conditions and under semi-
isothermal conditions. In the first condition, air gas was injected (1.667 × 10⁻⁶ m3/s) under non-isothermal condition with an increas- ing temperature rate of 10 K/min up to 873 K. In the second condi- tion, the semi-isothermal conditions increased from 573 K to 823 K at 50 K steps and the same period of time was maintained for each temperature step. The other conditions (gas type, gas flow rate) of analysis were the same as those of the non-isothermal method.
The analysis method using TGA 1000 was a three-step analysis consisting of three isothermal steps (380, 683, and 873 K) with each step maintained at different lengths of time. In step I, the demoistur- izing step, 380 K was maintained for 45 minutes to eliminate the moisture in the samples. In step II, the sp2-elimination step, the tem- perature was increased to 683 K and maintained for 200 minutes to eliminate the sp2-hybridized carbon in the analysis samples. Finally, total oxidation was performed in step III to eliminate both the remaining sp2-hybridized carbon and the other carbon components (including sp3-hybridized carbon) by oxidation, with only ash remaining. The loading weight of all the analysis samples was fixed at 20 mg. After the demoisturizing step (step I), the samples without moisture were used as the zero-base condition to set the same conditions for all analysis samples. The results of the test samples were compared with those of the purified samples.
2.5-4. Transmission Electron Microscopy (TEM)
TEM was performed on a JEM ARM 200F (JEOL). Analysis samples were dispersed on a copper grid and the magnification of TEM was 500,000.
2-5-5. Gas Chromatography (GC)
GC was performed on an Acme 6000 GC (Younglin Instrument Co., LTD). The column used in the analysis was 60/80 Carboxen- 1000 and the carrier gas was Ar gas (purity 99.999%). The tempera- ture setting of the oven was isothermal at 443 K and the initial main- taining time was 5 min. The temperature of the injection hole was 453 K and the flow rate was 0.500 × 10⁻⁶ m3/s. The setting of the TCD temperature was 453 K, the reference flow rate was 0.550 × 10⁻⁶ m3/s, the supplement gas flow rate was 0 m3/s, the TCD sensitivity was 5, and polarity change (initial polarity: (-)) was used.
3. Results and Discussion
3-1. sp2 and sp3-hybridized carbon
Fig. 4 shows the XPS results of the reproducibility test of the ana- lyzed reference samples (NDsoot and NDgray) and their fitting curves. Through the XPS results, the bonding energy state of the sam- ples can be separated by using the reference bonding energy data of functional groups. The functional group peaks of the carbon-groups were shown as follows: the sp2-hybridized carbon peaks was close to 284.6 eV, the sp3-hybridized carbon peaks were close to 285.9 eV, the C-O or C-N functional group peaks were close to 287.2 eV, and the C=O functional group peak was close to 288.5 eV [26-32]. In this
study, a reproducibility test of the reference samples (NDsoot and NDgray) was performed to verify that XPS analysis was reliable for quantitative analysis of the purification samples. Fig. 4(a) and (b)
show the wide-scan survey results of the NDsoot and NDgray sam- ples, respectively. The O 1s, N 1s, and C 1s peaks appeared close to 530 eV, 400 eV, and 286 eV, respectively. Comparing the two sam- Fig. 4. XPS reproducibility test for reference samples. Wide-scan survey spectra of XPS for all elements for (a) NDsoot and (b) NDgray, high
resolution spectra of XPS and their fitting curves for C (1s) functional groups for (c) NDsoot and (d) NDgray.
ples, the Cl 2p peak was detected in the NDgray sample because it was treated with acid. Fig. 4(c) and (d) show the result of high resolu- tion spectra for the C 1s peak and the peak was split into several functional groups. The areas included sp2-hybridized carbon, sp3- hybridized carbon, C-O, C=O, and the other peaks (noises), respec- tively.
Table 3 shows the results of the peak positions of C 1s for each analyzed sample group, the fractional areas of the fitting curves, and the standard deviation (STDEV) of the results. The C 1s peak was divided into several small peaks as follows: sp2-hybridized carbon, sp3-hybridized carbon, C-O, C=O, and other peaks. The fitting curves of sp2, sp3, C-O, and C=O were located at 284.6 eV, 285.9 eV, 287.2 eV, and 288.5 eV, respectively. The other peaks (noises) were located randomly. From the results in , the fractional areas of the NDsoot peaks and NDgray peaks were large deviation. The reason for this unreliability is based on the analysis principles of XPS analy- sis. In XPS analysis, the surfaces of the samples were analyzed using X-ray so that the results differed according to the analysis position of the samples. Therefore, XPS analysis should be used by many positions of the sample and the average value taken. As can be seen in Table 3, the average value (sp3/sp2) of NDgray is higher than that of NDsoot.
3-2. Reference samples
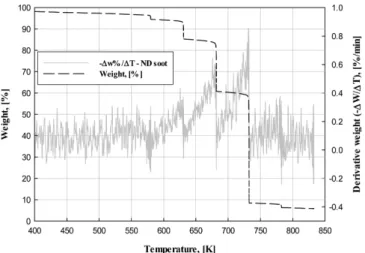
In previous research, when TGA analysis was performed in ambi- ent air condition, the oxidation of detonation nanodiamond, treated by the acid purification method, started at a temperature close to 773 K [22,23,33]. In the case of using the samples treated by ozone, it was confirmed that the thermal oxidation started at 773 K, similar to the acid treated samples [31]. However, it is generally known that the raw material (detonation nanodiamond) starts to oxidize at close to 673 K [22,23].
Fig. 5 shows the TGA results of weight fraction and derivative thermogravimetry (DTG) for the reference samples (NDsoot and NDgray) analyzed by DSC 7020 (SEICO INST.) under the following conditions: ambient air injection, temperature increasing rate of 10 K/
min from room temperature to the desired temperature of 873 K. The weight loss of the samples (TG) with increasing temperature, marked as a weight fraction (wt%), is shown on the left y-axis. The differen-
tial weight fraction with temperature, marked DTG (-Δwt%/Δt), is shown on the right y-axis. From the result of the TG and DTG peaks, the temperature at the start of weight loss differed between the two reference samples. The weight of the NDsoot started decreasing close to 593 K and that of NDgray started decreasing close to 723 K.
The DTG curve of NDsoot increased slightly at a temperature close to 593 K and then increased after 723 K, but the curve of NDgray increased only once at the temperature of 723 K. sp2-hybridized car- bon was oxidized and then eliminated at a temperature close to 593 K;
the TG and DTG curves of NDsoot therefore first changed at that temperature. At close to 723 K, sp3-hybridized carbon (nanodia- mond) started to oxidize. For these reasons, the TG and DTG curves of the NDsoot and NDgray samples rapidly changed after 723 K. At 873 K, all the carbonaceous matters (sp2-hybridized carbon and sp3- hybridized carbon), which enable oxidation, were eliminated and only ash component (metal impurities) remained. Analysis revealed that the NDsoot contained 8.7% of ash and NDgray contained about 2%
of ash. Also, the maximum peak value of the DTG curve appeared at the temperature range of 783~883 K, implying that the nanodiamond (sp3-hybridized carbon), which is the main component of the refer- ence samples, was oxidized faster at that temperature range.
Table 3. Atomic content of different chemical states of C in the references (NDsoot and NDgray) and their standard deviation (STDEV)
NDsoot_1 NDsoot_2 NDsoot_3 NDsoot_4 NDsoot_5 NDsoot_6 Average STDEV
sp2 (284.6 eV) 30.59 43.65 25.84 35.78 39.75 37.88 35.58 5.882
sp3 (285.9 eV) 35.71 31.60 40.83 35.65 33.77 36.11 35.61 2.799
C-O, C-N (287.2 eV) 27.58 18.37 27.73 23.75 20.38 22.04 23.31 3.478
C=O (288.5 eV) 6.12 6.39 5.61 4.83 6.10 3.98 5.51 0.848
sp3/sp2 1.168 0.724 1.580 0.996 0.849 0.953 1.045 0.275
NDgray_1 NDgray_2 NDgray_3 NDgray_4 NDgray_5 NDgray_6 Average STDEV
sp2 (284.6 eV) 19.46 26.68 32.59 28.48 30.44 18.23 26.01 5.368
sp3 (285.9 eV) 47.41 39.75 42.33 42.47 38.46 44.13 42.45 2.904
C-O, C-N (287.2 eV) 26.93 26.37 20.19 22.69 23.85 30.52 25.09 3.312
C=O (288.5 eV) 6.20 7.19 4.89 6.35 7.25 7.12 6.50 0.829
sp3/sp2 2.437 1.490 1.299 1.491 1.264 2.420 1.734 0.499
Fig. 5. TGA weight loss graphs for reference samples (NDsoot, NDgray). (a) Weight loss of samples with temperature increases and (b) DTG of samples with temperature increases.
Fig. 6 shows the weight fraction of the sp2-hybridized carbon and sp3-hybridized carbon in the NDsoot samples using DSC 7020 (SEICO INST.) with an isothermal step analysis procedure. The steps between the isothermal temperatures were 50 K from 583 to 833 K. The duration time for each temperature step was sufficient to reduce the DTG values at each step to zero, and to ensure that no fur- ther weight loss occurred in these steps. The sp2-hybridized carbon (carbon onion, graphite ribbon, and amorphous carbon) started oxi- dization at a 683 K, and the weight fraction also decreased. Where the temperature was between 683 and 833 K, the weight fraction decreased due to the oxidation of sp3-hybridized carbon (nanodia- mond) [23,29]. Combining these results with our analysis results, we confirmed that the amounts of sp2-hybridized carbon and sp3-hybrid- ized carbon contained in the NDsoot were about 40% and 54%, respectively. Also, the remaining content after the temperature reached 833 K was inflammable ashes (metal impurities), about 6% of which existed in the NDsoot.
3-3. Thermal oxidation with reaction temperature and time Fig. 7 shows the accumulative emitting quantity of gas phase car- bon obtained by using the emitting molar flow rate of CO2 gas with elapsed time for Exp. #1 to #4. Fig. 7(a) shows the molar flow rate of effluent CO2 gas with experiment time, and Fig. 7(b) shows the cumulative mass of output carbon by the gas phase. In Fig. 7(a), the maximum molar flow rate of CO2 was 0.024 - 0.027 mol/min. This value was similar to the theoretical molar flow rate of O2 in the injected air gas flow. At the reaction temperature between 673 and 873 K, almost all of the O2 moles in the injected air gas participated in the reaction. The CO2 molar flow rate decreased after the reaction time of 40 minutes in Exp. #1 (reaction temperature 673 K) and Exp. # 2 (reaction temperature 703 K), because the moles of sp2-hybridized carbon, which could be oxidized, decreased after 40 minutes at the experimental reaction temperatures of 673 and 703 K. In Exp. #3 (reaction temperature 773 K) and Exp. #4 (reaction temperature 873 K),
the molar flow rate of CO2 barely changed and the maximum value was maintained until the reaction time of 80 minutes because both sp2-hybridized carbon and sp3-hybridized carbon were oxidized so that all of the carbonaceous materials in the reactor had oxidized until no materials remained. Also, the GC graph between Exp. #3 (reaction temperature 773 K) and Exp. #4 (reaction temperature 873 K) appear to be similar because, when under these experimental conditions (injection speed of NDsoot: 30, volumetric injection gas flow rate:
5.167 × 10⁻⁵ m3/s), the amount of oxygen in air gas limits the total amount of reaction dose.
Table 4 shows the weight loss of the particles (captured from the cyclone and back filter) emitted from the reactor by entrainment for each experimental step (feeding (WFeeding, E-I), reaction (WRxn, E-II), and entrainment (WEnt, E-III)), where the emitting weight of carbon by gas phase (WC,GC) was calculated using the analyzed result of the moles of CO2 gas gained from GC. The yield (YEnt) was calculated from the emitted weight of carbon. From the results of Exps. #1 to
#4, the emitted weight of particles during the feeding and reaction steps increased with increasing reaction temperature. The entrain- ment weight during the entrainment step decreased with increasing reaction temperature, but when the temperature was over 773 K, the captured weight barely changed. In contrast to the change of the entrainment weight during the entrainment step, the effluent gas weight Fig. 6. TGA and DTG graph of NDsoot using TGA1000 (DaeDuk).
Maintaining temperature at each temperature step (60 min for 573, 623, 773, and 823 K; 120 min for 673 K; 240 min for 723 K).
Fig. 7. GC result with experimental time. (a) Molar flow rate of CO2 gas and (b) cumulative mass of output carbon by gas phase.
of carbon by gas phase increased as the reaction temperature increased and barely changed after the temperature reached 773 K. In the experiment at which the reaction temperature was 703 K (Exps. #5 to
#8), the value of the captured weight of carbon from GC analysis (WC,GC) barely changed when the purification reaction time was more than 60 minutes. Also, the carbon conversion (CCarbon) barely changed (around 46%) when the reaction time was more than 60 minutes. However, in the case of the yield (YEnt), the value at the reaction time of 120 minutes decreased by 10 % more than that at 60 minutes. In the experiments with the reaction temperature of 773 K (Exps. # 9 to #12), the values of WC,GC and CCarbon also barely changed when the reaction time was more than 60 minutes. How- ever, the yield (YEnt) rapidly decreased when the reaction time was increasing. The value of yield decreased up to 5.60% when the reac- tion time was 120 minutes. The weight of entrained particles during the feeding and reaction steps increased when the reaction tempera- ture increased in Exps. #1 to #4 because, when the reaction tempera- ture increased, the volume of the injected reaction gas (air gas) expanded, so that the superficial gas velocity inside the reactor increased, caus- ing an increase in the emitting weight from the reactor. When the temperature increased, carbonaceous materials (sp2 and sp3-hybrid- ized carbon) were more oxidized, so that the captured weight decreased and the effluent gas-phase-carbon increased; however, above 773 K, no carbon remained to be oxidized so that the collected weight of the entrainment and effluent carbon barely changed after the tempera- ture of 773 K. At the reaction temperature of 703 K (Exps. #5 to #8), purification reaction barely occurred when the reaction time was more than 60 minutes; rather, the yield decreased due to the entrain- ment of the particles. The rapid decrease of the yield at 773 K (Exp.
#9 to #12) occurred because the reaction temperature of 773 K was higher than 703 K, so that all of the sp3-hybridized carbon was oxi- dized in the reaction.
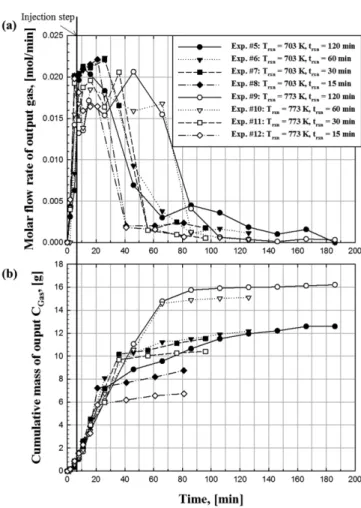
Fig. 8 shows a graph of the emitted molar flow rate of CO2 (Fig.
8(a)) and the accumulative emitting carbon by gas phase (Fig. 8(b)) with reaction time. As can be seen in Fig. 8(a), the maximum molar flow rates differed between the reaction temperatures of 703 K and 773 K. At 703 K, even the reaction time increased, and the molar flow rate decreased rapidly after the reaction time was more than 30 minutes. At the reaction temperature of 773 K, the molar flow rate
maintained a higher value and for a longer time than at 703 K. How- ever, after the reaction time increased to more than 70 minutes, the molar flow rate decreased rapidly. The maximum values of the molar flow rates differed because a different volumetric gas flow rate was used between the experiment sets (4.467 × 10⁻⁵ m3/s for Exps. #5 to
#8 and 4.067 × 10⁻⁵ m3/s for Exps. #9 to #12) to ensure that an equal superficial gas velocity was maintained inside the reactor. At the reaction temperature of 703 K, when the reaction time was more than 30 minutes, the molar flow rate decreased sharply because, while the sp2-hybridized carbon could be oxidized, the sp3-hybridized carbon could not be oxidized at this reaction temperature. Also, this means Table 4. Experimental results for the reaction temperature and time
Exp. # 1 2 3 4 5 6 7 8 9 10 11 12
Input 1)WInj.total g 43.42 42.50 44.38 48.10 28.06 28.76 26.58 26.49 22.66 25.24 26.96 24.8
Output
WFilter g 6.2 4.4 2.2 4 4.3 3.9 4.1 4.1 1.9 2.9 3.5 3.2
WFeeding g 1.24 1.99 1.75 4.08 0.12 0.14 0.15 0.12 0.25 0.16 0.23 0.21
WRxn g 2.69 3.56 8.51 8.27 0.65 1.12 1.9 4.48 0.9 2.16 3.6 3.8
WEnt g 17.2 11.51 1.56 1.59 14.25 12.08 8.26 5.21 12.89 9.62 4.53 1.39
WC,GC g 15.80 21.04 30.36 30.16 8.74 11.52 12.17 12.58 6.72 10.4 15.1 16.2 Conversion 2)CCarbon % 36.39 49.50 68.41 62.70 31.16 40.07 45.78 47.92 29.67 41.2 56.02 65.33 Entrainment Yield 3)YEnt % 39.61 27.08 3.52 3.31 50.78 42 31.08 19.51 56.87 38.12 16.8 5.6
1)WInj.total= WFilter+ WRxn+ WEnt+WC,GC, 2)CCarbon= WC GC, , 3)YEnt= . WInj.total
--- WEnt WInj.total ---
Fig. 8. GC result with experimental time. (a) Molar flow rate of CO2 gas and (b) cumulative mass of output carbon by gas phase.
that the sp2-hybridized carbon was sufficiently eliminated at less than 30 minutes of purification. At the reaction temperature of 773 K, sp2 and sp3-hybridized carbon oxidized simultaneously, so that the molar flow rate maintained a high value for a longer time. However, after 70 minutes of purification time, no further carbon remained to be oxidized and the value decreased rapidly. As shown in Fig. 8(b), the initial reaction rates in all experiments at the two reaction tempera- tures of 703 K and 773 K were almost the same. The graphs of the experiment at 703 K show a similar shape when the reaction time was more than 30 minutes. However, when the reaction temperature was 773 K, the graph shapes were similar when the reaction time was more than 70 minutes. These results occurred because when the reaction temperature was 703 K, only the sp2-hybridized carbon was oxidized. Therefore, after the reaction time of 30 minutes, no further CO2 was emitted. When the reaction temperature was 773 K, all car- bonaceous materials (including sp2-hybridized carbon and sp3-hybrid- ized carbon) were oxidized so that the maximum CO2 peak value was maintained for a much longer time. However, after 70 minutes, the cumulative mass of carbon weight was barely changed because no further carbon materials remained to be oxidized.
Fig. 9 shows a graph of the analysis result of the amounts of sp2- hybridized carbon, sp3-hybridized carbon, and ash in the samples (collected samples from each experiment and the reference samples (NDsoot and NDgray)) performed on a TGA 1000 (DaeDuk). The dark gray solid line refers to the temperature settings of TGA and the other lines refer to the weight fraction (TG) for each sample. The detailed values of the TGA results are given in Table 5. In Fig. 9(a), through step I, the moisture inside the samples was eliminated and the weight fractions were then normalized. In step II, the sp2-hybrid- ized carbon was eliminated. In step III, all the remaining carbona- ceous matters were eliminated and only ash remained. By comparing the TGA results of NDsoot between TGA 1000 and DSC 7020, using TGA 1000 instead of DSC 7020 was reliable because the content of sp2-hybridized carbon, sp3-hybridized carbon, and ash was similarly analyzed. From the graphs, the sample from Exp. #12 has the greatest ash content, significantly more than that of the other samples. This is
Table 5. Thermogravimetric analysis (TGA) results of experiments
Exp. # NDsoot NDgray 5 6 7 8 9 10 11 12
TGA
W0 mg 20.00 20.00 20.00 20.00 20.00 20.00 20.00 20.00 20.00 20.00
W%683K % 68.53 93.50 83.22 85.26 87.77 89.1 79.64 81.76 87.04 88.91
W%873K % 5.76 0.00 3.06 3.7 7.35 9.04 7.04 5.24 19.76 37.5
4)Wash mg 1.15 0.00 0.61 0.74 1.47 1.81 1.41 1.05 3.95 7.5
5)Wsp2 mg 6.30 1.30 3.36 2.95 2.45 2.18 4.07 3.65 2.59 2.22
6)Wsp3 mg 12.55 18.70 16.03 16.31 16.08 16.01 14.52 15.3 13.46 10.28
W%ash % 5.76 0.00 3.06 3.7 7.35 9.04 7.04 5.24 19.76 37.5
W%sp2 % 31.48 6.50 16.78 14.74 12.23 10.9 20.36 18.24 12.96 11.09
W%sp3 % 62.76 93.50 80.16 81.56 80.42 80.06 72.6 76.51 67.28 51.41
sp3 ratio Wsp3/Wsp2 - 1.99 14.38 4.78 5.53 6.57 7.35 3.57 4.19 5.19 4.64
Yield 7)Ysp3 % - - 40.7 34.25 24.99 15.62 41.29 29.17 11.3 2.88
4)Wash= W0× W%873K, 5)Wsp2= W0× (100 - W%683K), 6)Wsp3= W0- Wash- Wsp2,7)Ysp3=WEnt(W%sp3). WInj.total ---
Fig. 9. (a) TGA results of each experiment, (b) TGA isothermal results (step II) to compare the sp2-hybridized carbon ratios for entrained samples of each experiment; “I” refers to the step of removing moisture in the samples, “II” refers to the step of removing sp2-hybridized carbon, and “III” refers to the step of removing sp3-hybridized carbon. The dark gray colored solid line (——) refers to the temperature settings of TGA, the black and gray colored dashed and two dotted lines (— ·· —) denote the reference samples (NDsoot and NDgray, respectively), the black colored lines refer to the samples with the reaction temperature of 703 K, and the gray colored lines denote the samples with the reaction tem- perature of 773 K.
because, when the reaction temperature was 773 K, all the carbona- ceous matters could be oxidized, but ash could not be eliminated; the content of the ash therefore increased rapidly when the reaction time increased. In Fig. 9(b), the NDsoot has the largest content of sp2- hybridized carbon and the NDgray has the lowest. When purifica- tion progressed, the curves more closely represented those of the graph of NDgray [23]. At the reaction temperatures of 703 K and 773 K, as the reaction time increased, the content of sp2-hybridized carbon decreased. However, comparing the content of sp2-hybrid- ized carbon between the samples with the same reaction time yet with different reaction temperatures (Exps. #5 to #9 and Exps. #8 to
#12), a greater amount of sp2-hybridized carbon remained when the reaction temperature was higher. However, this contradicts the typi- cal results, whereby when the reaction temperature is higher, greater and more rapid oxidation occurs. The contradictory result is due to the reaction temperature. At the reaction temperature of 773 K, all carbonaceous matter oxidized simultaneously, even sp3-hybridized carbon (nanodiamond), so that the weight fraction of sp2-hybridized carbon was relatively larger than that of the samples obtained at the reaction temperature of 703 K.
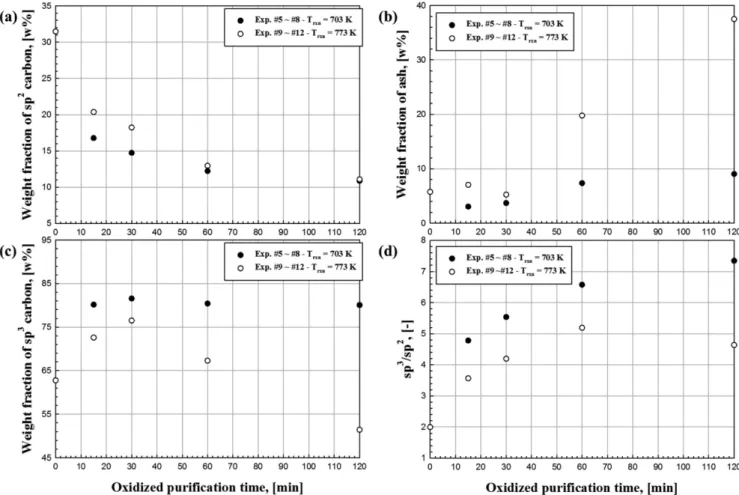
Fig. 10 shows the changes of the sp2-hybridized carbon content, sp3-hybridized carbon content, the content of ash, and the ratio of sp3/sp2 of Exps. #5 to #12 with experimental reaction time. NDsoot
is composed of 31.5% sp2-hybridized carbon, 62.8% sp3-hybridized carbon, and 5.76% ash and the value of sp3/sp2 is 1.99. NDgray is composed of 6.50% sp2-hybridized carbon, 93.5% sp3-hybridized carbon, and 0% ash and the value of sp3/sp2 is 14.38. As can be seen in Fig. 10(a), the content of sp2-hybridized carbon decreased with increasing reaction time. However, the decreasing rate of the sp2- hybridized carbon content at 703 K was greater than the decreasing rate at 773 K. This is because when the reaction temperature was 773 K, sp3-hybridized carbon was oxidized simultaneously during the puri- fication process so that the relative content ratio decreased. In Fig.
10(b), the fraction of ash (metal impurities) increased with the increasing reaction time because it was impossible to eliminate the ash by oxidation, so that ash was condensed during the oxidative purification process. However, when the reaction temperature was 703 K, the increasing rate of ash content was not noticeable, although at 773 K, the increasing rate of ash increased rapidly. This is due to the oxidation of sp3-hybridized carbon at 773 K but not at 703 K. Fig.
10(c) shows the content changes of sp3-hybridized carbon. When the reaction temperature was 703 K, the content of sp3-hybridized car- bon increased and when the reaction time was more than 30 min- utes, the content barely changed. However, when the reaction temperature was 773 K, the content of sp3-hybridized carbon increased until the reaction time of 30 minutes and the content then
Fig. 10. Weight fraction changes with reaction time and reaction temperature. (a) Weight fraction change of sp2-hybridized carbon, (b) weight fraction change of ash, (c) weight fraction change of sp3-hybridized carbon, and (d) change of the nanodiamond ratio (sp3/sp2).
decreased rapidly. This is because the oxidation of sp3-hybridized carbon occurs at the reaction temperature of 773 K. Fig. 10(d) shows the ratio between sp3-hybridized carbon and sp2-hybridized carbon (sp3/sp2) for each experiment sample. According to Osswald et al.
[23], the ratio of sp3/sp2 increased with purification progress. The purification levels of the samples were determined by using the ratios of sp3-hybridized carbon and sp2-hybridized carbon contained in the collected experiment samples. When the reaction temperature was 703 K, as the purification reaction progressed, the value of sp3/ sp2 increased and the maximum value increased up to 7.35. When the reaction temperature was 773 K, the rate increased up to 5.19 until the reaction time of 30 minutes, and then decreased rapidly.
This tendency was similar to that of the result from the previous study in which the experiment was performed on nanocrystalline diamond film [34]. (The Raman spectroscopy analysis results of that study were used for comparison with the results in this current study).
This result occurred because the sp3-hybridized carbon was oxidized simultaneously during the purification process, as previously men- tioned. As shown in Fig. 10, the tendency was similar to that when annealing at different temperatures under ultra-high vacuum (UHV) condition [26], but the duration of processing time of our study was 1/6-th less than that in the previous study (The study by Petit, et al.
[26] was carried out using the sp2-hybridized carbon and sp3-hybrid- ized carbon analyzed from XPS). The largest value of sp3/sp2 from the Exp. #8 sample is 7.35 and the value of NDgray is 14.38, both of which were two times greater than the values of NDgray. However, for the mass fraction of the Exp. #9 sample without the content of ash, the content of sp2-hybridized carbon was 11.98% and that of sp3-hybridized carbon was 88.02%, which are similar values to those of NDgray (sp2-hybridized carbon was 6.5% and sp3-hybridized carbon was 93.5%).
4. Conclusions
The change in the quality of purified NDsoot with various purifi- cation reaction temperatures and reaction times was investigated in a media gas phase fluidized bed reactor.
For analysis of the quality of the product, quantitative analysis should be performed on a TGA; sp2-hybridized carbon was oxidized under the condition 683 K, while sp3-hybridized carbon was not oxi- dized at that temperature. The other methods (XRD, XPS, Raman, FTIR etc) can only be used for the analysis of the surface of the prod- ucts.
When the reaction temperature was 673 and 703 K, the amount of emitted gas flow rate of CO2 increased with the increasing reaction time. When the temperature was greater than 773 K, significantly more CO2 gas was generated by oxidation. When the purification level was determined according to the reaction time, the sp2-hybridized carbon, purified by oxidation, increased with the increasing reaction time. However, when the reaction temperature was 773 K, the amount of sp2-hybridized carbon remained greater than that of 703 K
because both the sp2-hybridized carbon and sp3-hybridized carbon were oxidized simultaneously.
The content of sp3-hybridized carbon at the reaction temperature of 703 K was barely changed when the reaction time was more than 30 minutes, but at 773 K, the content decreased as preferred.
The content of sp2-hybridized carbon and sp3-hybridized carbon was important data to determine the quality of the nanodiamond products. From the results described above, at 703 K, the purifica- tion quality increased with the increasing reaction time. However, at 773 K, the purification quality increased up to 30 minutes and then decreased rapidly. Using these results, the operating conditions can be estimated according to the necessary quality level of the purified products.
Acknowledgment
This study was funded by NanoResource, Republic of Korea, and partly supported by the Korea Institute of Energy Technology Evalu- ation and Planning (KETEP) grant (No.20163010050070) funded by the Ministry of Trade, Industry and Energy, Republic of Korea.
Nomenclature
ρs : Particle density [kg/m3] ρg : Gas density [kg/m3] Cond. : Conditions CCarbon : Conversion of CO2 dSV : Sauter mean diameter [m]
g : Gravitational acceleration [m/s2] HS : Static bed height [m]
Inj. : Injection
PBPR : Pressure of back pressure regulator [Pa]
tEnt : Entrainment time [min]
tRxn : Oxidative purification reaction time [min]
tNDsoot : NDsoot injecting time [min]
TRxn : Reaction temperature [K]
U : Superficial gas velocity [m/s]
U0,Trxn : Superficial gas velocity at reaction temperature [m/s]
Umf,ZB : Minimum fluidized gas velocity of zirconia beads [m/s]
Vin,298K : Volumetric gas flow rate of inlet gas at 298 K [m3/s]
W0 : Loading weight at TGA [mg]
WAsh : Weight of ash in the samples [mg]
WC,GC : Captured weight of carbon from GC analysis [g]
WEnt : Captured weight from cyclone after entrainment was completed [g]
WFilter : Captured weight from cyclone after experiment was completed [g]
WInj.,total: Total injected weight of NDsoot [g]
WRxn : Captured weight from cyclone after reaction was completed (gas only) [g]
Wsp2 : Weight of sp2-hybridized carbon in the samples [mg]
Wsp3 : Weight of sp3-hybridized carbon in the samples [mg]
WZB : Weight of zirconia bead [kg]
W%683K: Weight fraction left in the samples after treating at 683 K [%]
W%873K: Weight fraction left in the samples after treating at 873 K [%]
W%ash : Weight fraction of ash in the samples [%]
W%sp2 : Weight fraction of sp2-hybridized carbon in the samples [%]
W%sp3 : Weight fraction of sp3-hybridized carbon in the samples [%]
YEnt : Yield of product compared with injecting NDsoot [%]
Ysp3 : Yield of product (sp3-hybidized carbon) compared with injecting NDsoot [%]
ZB : Zirconia bead
References
1. Mochalin, V. N., Shenderova, O., Ho, D. and Gogotsi, Y., “The Properties and Applications of Nanodiamonds,” Nat. Nanotech- nol., 7 11-23(2012).
2. Chang, Y. R., Lee, H. Y., Chen, K., Chang, C. C., Tsai, D. S., Fu, C. C., Lim, T. S., Tzeng, Y. K., Fang, C. Y., Han, C. C., Chang, H. C. and Fann, W., “Mass Production and Dynamic Imaging of Fluorescent Nanodiamonds,” Nat. Nanotechnol., 3, 284-288 (2008).
3. Faklaris, O., Joshi, V., Irinopoulou, T., Tauc, P., Sennour, M., Girard, H., Gesset, C., Arnault, J. C., Thorel, A., Boudou, J. P., Curmi, P. A. and Treussart, F., “Photoluminescent Diamond Nanoparti- cles for Cell Labeling: Study of the Uptake Mechanism in Mam- malian Cells,” ACS Nano, 3, 3955-3962(2009).
4. McGuinness, L. P., Yan, Y., Stacey, A., Simpson, D. A., Hall, L.
T., Maclaurin, D., Prawer, S., Mulvaney, P., Wrachtrup, J., Caruso, F., Scholten, R. E. and Hollenberg, L. C. L., “Quantum Measure- ment and Orientation Tracking of Fluorescent Nanodiamonds Inside Living Cells,” Nat. Nanotechnol., 6, 358-363(2011).
5. Chou, C. C. and Lee, S. H., “Tribological Behavior of Nanodi- amond-dispersed Lubricants on Carbon Steels and Aluminum Alloy,” Wear, 269, 757-762(2010).
6. Dolmatov, V. Y., “Detonation Synthesis Ultradispersed Dia- monds: Properties and Applications,” Uspekhi Khimii, 70, 687- 708(2001).
7. Ivanov, M. G., Pavlyshko, S. V., Ivanov, D. M., Petrov, I. and Shenderova, O., “Synergistic Compositions of Colloidal Nano- diamond as Lubricant-additive,” J. Vacuum Science & Technol- ogy B, 28, 869-877(2010).
8. Kato, T., Lin, W. M. and Osawa, E., “Lubrication Property of Single-Digit-Nanodiamond in an Aqueous Colloid,” J. Japanese Society Tribologists, 54, 122-129(2009).
9. Shimkunas, R. A., Robinson, E., Lam, R., Lu, S., Xu, X. Y., Zhang, X. Q., Huang, H. J., Osawa, E. and Ho, D., “Nanodia- mond-insulin Complexes as pH-dependent Protein Delivery Vehicles,” Biomaterials, 30, 5720-5728(2009).
10. Alhaddad, A., Adam, M. P., Botsoa, J., Dantelle, G., Perruchas, S., Gacoin, T., Mansuy, C., Lavielle, S., Malvy, C., Treussart, F.
and Bertrand, J. R., “Nanodiamond as a Vector for siRNA Delivery to Ewing Sarcoma Cells,” Small, 7, 3087-3095(2011).
11. Huang, H., Pierstorff, E., Osawa, E. and Ho, D., “Active Nano- diamond Hydrogels for Chemotherapeutic Delivery,” Nano Let- ters, 7, 3305-3314(2007).
12. Zhang, X. Q., Chen, M., Lam, R., Xu, X. Y., Osawa, E., Ho, D.,
“Polymer-Functionalized Nanodiamond Platforms as Vehicles for Gene Delivery,” ACS Nano, 3, 2609-2616(2009).
13. Chen, M., Zhang, X. Q., Man, H. B., Lam, R., Chow, E. K., Ho, D. A., “Nanodiamond Vectors Functionalized with Polyethylen- imine for siRNA Delivery,” J. Physical Chemistry Letters, 1, 3167-3171(2010).
14. Kotov, N. A., “Inorganic Nanoparticles as Protein Mimics,” Sci- ence, 330, 188-189(2010).
15. Perevedentseva, E., Cai, P.J., Chiu, Y.C., Cheng, C.L., "Charac- terizing Protein Activities on the Lysozyme and Nanodiamond Complex Prepared for Bio Applications,” Langmuir, 27, 1085- 1091(2011).
16. Krueger, A., “New Carbon Materials: Biological Applications of Functionalized Nanodiamond Materials,” Chemistry-a European J., 14, 1382-1390(2008).
17. Thalhammer, A., Edgington, R. J., Cingolani, L. A., Schoepfer, R. and Jackman, R. B., “The Use of Nanodiamond Monolayer Coatings to Promote the Formation of Functional Neuronal Net- works,” Biomaterials, 31, 2097-2104(2010).
18. Xing, Z., Pedersen, T. O., Wu, X. J., Xue, Y., Sun, Y., Finne- Wistrand, A., Kloss, F. R., Waag, T., Krueger, A., Steinmuller- Nethl, D. and Mustafa, K., “Biological Effects of Functionaliz- ing Copolymer Scaffolds with Nanodiamond Particles,” Tissue Engineering Part A, 19, 1783-1791(2013).
19. Shu, X. Z., Liu, Y. C., Palumbo, F. S., Lu, Y. and Prestwich, G.
D., “In situ Crosslinkable Hyaluronan Hydrogels for Tissue Engi- neering,” Biomaterials, 25, 1339-1348(2004).
20. Yeh, J., Ling, Y. B., Karp, J. M., Gantz, J., Chandawarkar, A., Eng, G., Blumling, J., Langer, R. and Khademhosseini, M. A.,
“Micromolding of Shape-controlled, Harvestable Cell-laden Hydro- gels,” Biomaterials, 27, 5391-5398(2006).
21. Shenderova, O. A., Zhirnov, V. V. and Brenner, D. W., “Carbon Nanostructures,” Crit. Rev. Solid State Mat. Sci., 27, 227-356 (2002).
22. Pichot, V., Comet, M., Fousson, E., Baras, C., Senger, A., Le Normand, F. and Spitzer, D., “An Efficient Purification Method For Detonation Nanodiamonds,” Diamond and Related Materi- als, 17, 13-22(2008).
23. Osswald, S., Yushin, G., Mochalin, V., Kucheyev, S. O. and Gogotsi, Y., “Control of sp (2)/sp (3) Carbon Ratio and Surface Chemis- try of Nanodiamond Powders by Selective Oxidation in air,” J.
American Chemical Society, 128, 11635-11642(2006).
24. Shenderova, O., Koscheev, A., Zaripov, N., Petrov, I., Skryabin, Y., Detkov, P., Turner, S. and Van Tendeloo, G., “Surface Chemistry and Properties of Ozone-Purified Detonation Nanodiamonds,” J.
Phys. Chem. C, 115, 9827-9837(2011).
25. Apolonskaya, I. A., Tyurnina, A. V., Kopylov, P. G. and Obraztsov, A. N., “Thermal Oxidation of Detonation Nanodiamond,” Mos- cow University Physics Bulletin, 64, 433-436(2009).
26. Petit, T., Arnault, J. C., Girard, H. A., Sennour, M., Bergonzo, P.,
“Early Stages of Surface Graphitization on Nanodiamond Probed by x-ray Photoelectron Spectroscopy,” Physical Review B, 84, 5(2011).
27. Xie, F. Y., Xie, W. G., Gong, L., Zhang, W. H., Chen, S. H., Zhang, Q. Z. and Chen, J., “Surface Characterization on Graph- itization of Nanodiamond Powder Annealed in Nitrogen Ambi- ent,” Surface and Interface Analysis, 42, 1514-1518(2010).
28. Cunningham, G., Panich, A. M., Shames, A. I., Petrov, I. and Shenderova, O., “Ozone-modified Detonation Nanodiamonds,”
Diamond and Related Materials, 17, 650-654(2008).
29. Xu, X. Y. and Yu, Z. M., “Influence of Thermal Oxidation on As-synthesized Detonation Nanodiamond,” Particuology, 10, 339-344(2012).
30. Duffy, E., Mitev, D. P., Thickett, S. C., Townsend, A. T., Paull, B. and Nesterenko, P. N., “Assessing the Extent, Stability, Purity and Properties of Silanised Detonation Nanodiamond,” Applied Surface Science, 357, 397-406(2015).
31. Petrov, I., Shenderova, O., Grishko, V., Grichko, V., Tyler, T., Cunningham, G. and McGuire, G., “Detonation Nanodiamonds
Simultaneously Purified and Modified by Gas Treatment,” Dia- mond and Related Materials, 16, 2098-2103(2007).
32. Liu, Y. Y. and Kim, D. Y., “Enhancement of Capacitance by Electro- chemical Oxidation of Nanodiamond Derived Carbon Nano- Onions,” Electrochimica Acta, 139, 82-87(2014).
33. Zou, Q., Wang, M. Z. and Li, Y. G., “Analysis of the Nanodia- mond Particle Fabricated by Detonation,” J. Experimental Nano- science, 5, 319-328(2010).
34. Pu, J. C., Wang, S. F. and Sung, J. C., “High-temperature Oxi- dation Behavior of Nanocrystalline Diamond Films,” J. Alloy.
Compd., 489, 638-644(2010).