© 2016 Korean Breast Cancer Society. All rights reserved. http://ejbc.kr | pISSN 1738-6756
INTRODUCTION
Epigenetic alterations of histones in chromatin are essential in gene transcription pattern regulation in cells and are medi- ated by the catalytic activity of histone deacetylases and methyl- transferases [1]. Enhancer of zeste homologue 2 (EZH2),
which is located on chromosome 7q35, is a member of the catalytic subunit of the polycomb repressive complex 2, which is a highly conserved histone methyltransferase that methyl- ates lysine 27 of histone 3 [2]. EZH2, which has a SET do- main, epigenetically regulates chromatin structure and re- presses target gene transcription by trimethylating histone 3 lysine 27 (H3K27me3). Growing evidence demonstrates that EZH2 is required for tumorigenesis, cancer cell proliferation, progression, metastasis, stem cell maintenance, and drug re- sistance [3]. EZH2 overexpression has been implicated in var- ious malignancies including prostate, breast, endometrial, bladder, and head and neck squamous cell carcinomas, and this overexpression is associated with poor outcomes [4-8].
Recent studies of myeloid malignancies have highlighted that EZH2 acts as a tumor suppressor, suggesting that EZH2 ex- hibits varied roles in cancer development depending on can-
High EZH2 Protein Expression Is Associated with Poor Overall Survival in Patients with Luminal A Breast Cancer
Si-Hyong Jang*, Jong Eun Lee1,*, Mee-Hye Oh, Ji-Hye Lee, Hyun Deuk Cho, Kyung-Ju Kim, Sung Yong Kim1, Sun Wook Han1, Han Jo Kim2, Sang Byung Bae2, Hyun Ju Lee
Departments of Pathology, 1Surgery, and 2Division of Hemato-Oncology, Department of Internal Medicine, Soonchunhyang University Cheonan Hospital, Soonchunhyang University College of Medicine, Cheonan, Korea
ORIGINAL ARTICLE
Purpose: The enhancer of zeste homologue 2 (EZH2) is a cataly- tic subunit of the polycomb repressive complex 2, a highly con- served histone methyltransferase. EZH2 overexpression has been implicated in various malignancies, including breast cancer, where is associated with poor outcomes. This study aims to clarify nuclear EZH2 expression levels in breast cancers using immunohistochemistry (IHC) and correlate these findings with clinicopathologic variables, including prognostic significance.
Methods: IHC was performed on tissue microarrays of 432 inva- sive ductal carcinoma (IDC) tumors. Associations between EZH2 expression, clinicopathologic characteristics, and molecular subtype were retrospectively analyzed. The relationship between EZH2 protein expression in normal breast tissue and ductal car- cinoma in situ (DCIS) was also assessed. Results: High EZH2 expression was demonstrated in 215 of 432 tumors (49.8%).
EZH2 was more frequently expressed in DCIS and IDC than in normal breast tissue (p=0.001). High EZH2 expression signifi- cantly correlated with high histologic grade (p<0.001), large tu- mor size (p=0.014), advanced pathologic stage (p=0.006), neg-
ative estrogen receptor status (p<0.001), positive human epi- dermal growth factor receptor 2 (HER2) status (p<0.001), high Ki-67 staining index (p<0.001), positive cytokeratin 5/6 status (p=0.003), positive epidermal growth factor receptor status (p<0.001), and positive p53 status (p<0.001). Based on mole- cular subtypes, high EZH2 expression was significantly associat- ed with HER2-negative luminal B, HER2-positive luminal B, and HER2 type and triple-negative basal cancers (p<0.001). In pa- tients with luminal A, there was a significant trend toward shorter overall survival for those with tumors having high EZH2 expres- sion compared to those with tumors having low EZH2 expres- sion (p=0.045). Conclusion: EZH2 is frequently upregulated in breast malignancies, and it may play an important role in cancer development and progression. Furthermore, EZH2 may be a prognostic marker, especially in patients with luminal A cancer.
Key Words: Breast neoplasms, Enhancer of zeste homologue 2, Immunohistochemistry, Prognosis
Correspondence to: Hyun Ju Lee
Department of Pathology, Soonchunhyang University Cheonan Hospital, Soonchunhyang University College of Medicine, 31 Soonchunhyang 6-gil, Dongnam-gu, Cheonan 31151, Korea
Tel: +82-41-570-3589, Fax: +82-41-570-3580 E-mail: [email protected]
*These authors contributed equally to this work.
This work was supported in part by the Soonchunhyang University Research Fund.
Received: July 10, 2015 Accepted: January 11, 2016
Breast
Cancer
cer type [9]. Two EZH2 inhibitors are currently being tested in phase I and II clinical trials in patients with and without EZH2 mutations in their lymphoma [10]. Therefore, it is im- portant to establish a method of determining optimal candi- dates for EZH2 inhibitor treatment.
Elevated EZH2 levels highly correlate with invasiveness and increased proliferation rates of breast cancers [11]. EZH2 ex- pression progressively increases from normal breast tissue to atypical ductal hyperplasia, ductal carcinoma in situ (DCIS), and invasive ductal carcinoma (IDC), suggesting that EZH2 protein levels increase as breast cancer develops [4,11,12]. Al- though EZH2 protein overexpression has been correlated with poor prognosis of breast cancer patients, little is known about the role EZH2 plays in breast cancer tumorigenesis [11,13]. Herein, we report EZH2 nuclear expression in 432 breast IDC samples by immunohistochemistry (IHC) and correlate findings to clinicopathologic variables, including prognostic significance, and molecular subtype. We also ana- lyzed the relationship between EZH2 protein expression in normal breast tissue and DCIS.
METHODS
Patients
Four hundred thirty-two formalin-fixed and paraffin- embedded surgical breast IDC specimens, 27 DCIS speci- mens, and 11 matched normal breast tissues obtained from the Soonchunhyang University Hospital from 2001 to 2013 were included in this retrospective study. Every included pa- tient was diagnosed with breast cancer by pathologists based on pathological test results. Hematoxylin and eosin-stained slides were independently reviewed in each case to confirm the original diagnosis by two pathologists (S.H.J. and H.J.L.), based on the 2012 World Health Organization classification [14]. Data regarding patient age at initial diagnosis, tumor size, histological type, histological tumor grade, lymph node status, and surgery type were also collected. Pathologic TNM classification and staging were performed for the 432 cases using the current TNM international staging system (seventh edition of the American Joint Committee on Cancer criteria).
Further data, including disease progression, patient survival, and cause of death, were obtained from medical records and/
or interviews with patients’ families. This study was approved by the Institutional Review Board at the Soonchunhyang Uni- versity Hospital (SCHCA 2015-06-006).
Tissue microarrays
For tissue microarray (TMA) construction, a sufficient via- ble tumor sample with no hemorrhage or necrosis was select-
ed for each case. Representative 2-mm diameter core tissue sections were taken from paraffin blocks. They were arranged in new recipient TMA blocks using a manual TMA device (SuperBioChips Laboratories, Seoul, Korea). In cases with variable histological features, the most representative area was selected for TMA construction. In addition, 11 nonneoplastic breast tissues from IDC patients were included.
Immunohistochemistry
EZH2 expression was analyzed by IHC. Four-micrometer sections from the TMA blocks were deparaffinized in xylene and rehydrated with gradually decreasing concentrations of ethanol in distilled water. IHC staining of the TMA samples was performed with a Bond-Max Autostainer (Leica Microsys- tems, Bannockburn, USA). Primary antibody binding was de- tected with the Bond Polymer Refine Detection kit (Leica Mi- crosystems), according to the manufacturer’s instructions. The primary anti-EZH2 mouse monoclonal antibody (Novocastra, Newcastle Upon Tyne, UK) was used at a dilution of 1:100.
Two independent observers (S.H.J. and H.J.L.) read the slides in a blinded manner, and consensus was made by repeated ex- amination when results were discordant. Only epithelial cells were evaluated, and results for each core were recorded sepa- rately. At the time of review, neither of these investigators was aware of clinicopathologic data associated with each specimen because all slides had been coded. Nuclear EZH2 expression was scored as negative (score=0, no staining), weak (score=1,
<25% of nuclei staining with any intensity), moderate (score=2, 25%–75% of nuclei staining with any intensity), or strong (score=3, >75% of nuclei staining with any intensity) [13]. Tumors with nuclear staining with moderate or strong were classified as having high EZH2 expression, whereas those with completely absent or weak nuclear staining were classified as having no or low EZH2 expression.
Immunohistochemical staining for estrogen receptor (ER;
1:50; Dako Co., Carpinteria, USA), progesterone receptor (PR;
1:50; Dako Co.), human epidermal growth factor receptor 2 (HER2; 1:200; Novocastra Laboratories Ltd., Newcastle, UK), Ki-67 (1:800; Dako Co.), cytokeratin 5/6 (CK5/6; 1:50; Dako Co.), epidermal growth factor receptor (EGFR; 1:100; Dako Co.), and p53 (1:1,200; Dako Co.) was done on 4-μm sections in the TMA blocks. ER and PR immunohistochemical stain- ing was evaluated using the Allred method [15]. An Allred score of 3 or higher was classified as positive. HER2 was ana- lyzed according to the general guidelines set by the American Society of Clinical Oncology/College of American Pathol- ogists. When IHC yielded equivocal results, HER2 status was established with fluorescent in situ hybridization. Ki-67 and p53 expression levels were counted in 1,000 tumor cells, and
positivity was defined as ≥14% and >10% staining, respec- tively. CK5/6 and EGFR expression levels were considered positive when the cytoplasmic and/or membranous reaction was ≥10%. The phenotypes were classified as follows: luminal A: ER- and/or PR-positive, HER2-negative, and Ki-67 index
<14%; HER2-negative luminal B: ER- and/or PR-positive, HER2-negative, and Ki-67 index ≥14%; HER2-positive lumi- nal B: ER- and/or PR-positive, HER2-positive, and any Ki-67 index; HER2 type: ER- and PR-negative and HER2-positive;
basal triple-negative breast cancer (TNBC): ER-, PR-, and HER2-negative and CK5/6- and/or EGFR-positive; and non- basal TNBC: ER-, PR-, HER2-, CK5/6-, and EGFR-negative.
Statistical analyses
Statistical analyses were performed using the software pack- age SPSS version 19.0, for Windows (IBM Corp., Armonk, USA). Associations between EZH2 expression and the clini- copathologic characteristics were analyzed using Pearson chi- square test, Fisher exact test, or an independent t-test, accord- ing to test conditions. Survival rates were plotted using the Kaplan-Meier method and log-rank test. Disease-free survival (DFS) periods were defined as the intervals between primary surgeries and final follow-up visits without disease or evidence of recurrence or metastasis of breast cancers (locoregional re- lapse and distant metastasis). Overall survival (OS) periods were defined as the intervals between primary surgeries and the last follow-up visits or deaths from any cause. Cox propor- tional hazard model was used to evaluate the associations be- tween clinicopathological factors and survival rates. Hazard ratio (HR) and associated 95% confidence interval (CI) were calculated for each variable. A p-value <0.05 was considered statistically significant.
RESULTS
Patient characteristics and EZH2 immunoreactivity
This study included 426 women (98.6%) and six men
(1.4%). The mean age was 52.4±12.4 years (range, 24–81 years), and the mean tumor size was 2.4±1.4 cm (range, 0.3–
12 cm). Of the 432 patients, 222 (51.4%) underwent breast- conserving surgeries, and 210 (48.6%) underwent mastect- omies. Of the 432 samples, 54 were grade 1 (12.5%), 213 were grade 2 (49.3%), and 165 were grade 3 (38.2%). Primary tu- mor size data were available for the 432 patients. From this, 212 (49.1%), 197 (45.6%), 19 (4.4%), and 4 (0.9%) tumors were categorized as pT1, pT2, pT3, and pT4, respectively. Of the 432 patients, 163 patients (37.7%) had lymph node posi- tivity at the time of surgery. The 432 patient tumors were clas- sified using the TNM classification system as stage I (n=154, 35.6%), stage II (n=198, 45.8%), and stage III (n=80, 18.5%).
The proportions of patient tumors positive for ER and PR ex- pression were 66.0% and 35.2%, respectively. Upon HER2 ex- pression analysis, 18.1% of all patient tumors were positive.
High Ki-67 expression was noted in 45.6% of tumors. Positive CK5/6 and EGFR expression levels were found in 9.3% and 20.6% of tumors, respectively. For p53 expression, 18.5% of patient tumors were positive.
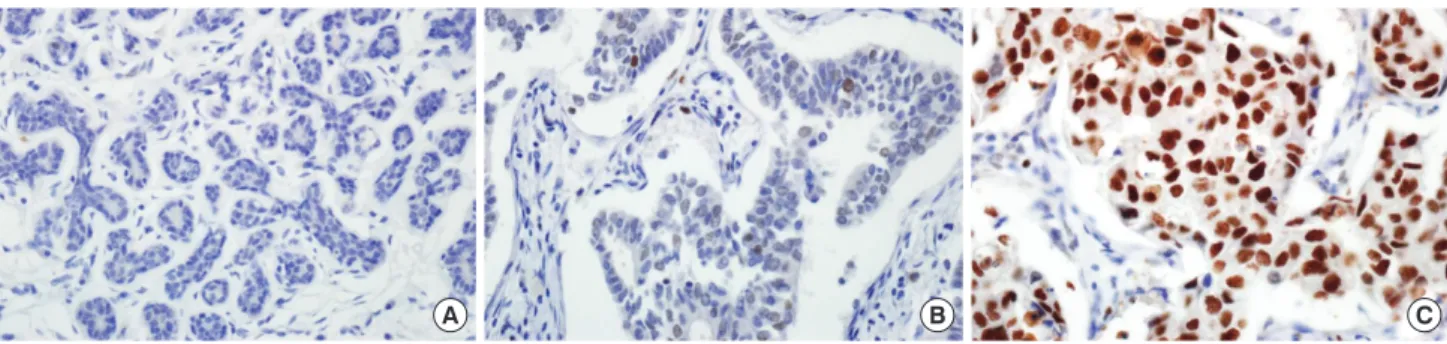
EZH2 protein in IDC was expressed mainly in tumor cell nuclei (Figure 1). We evaluated EZH2 expression in 11, 27, and 432 normal breast tissues, DCIS specimens, and IDC specimens, respectively. EZH2 expression was positive in 0 of 11 (0%) normal breast tissue, 8 of 27 (29.6%) DCIS speci- mens, and 215 of 432 (49.8%) IDC specimens, in increasing order, and the differences in positivity between groups were statistically significant (p=0.001) (Table 1). The mean EZH2 expression score was 0.18 ±0.41 in normal breast tissue, 0.89±1.09 in DCIS, and 1.49±1.12 in IDC (Figure 2). EZH2 expression was significantly higher in DCIS and IDC speci- mens than in normal breast tissue (p<0.001). After evalua- tion of the 432 immunostained IDC specimens, 109 (25.2%) were negative; 108 (25.0%) were scored 1, indicating weak positivity; 109 (25.2%) were scored 2, indicating moderate positivity; and 106 (24.5%) were scored 3, indicating strong positivity. For statistical analyses, the cases were subdivided
Figure 1. Immunohistochemical analysis of enhancer of zeste homologue 2 (EZH2) expression in invasive ductal carcinoma of breast (×400): (A) nor- mal breast tissue, (B) low, and (C) high expression. Note that EZH2 protein is expressed in the nuclei of cancer cells.
A B C
into an EZH2-high expression group (scores 2 and 3; n=215, 49.8%) and an EZH2-low expression group (scores 0 and 1;
n=217, 50.2%).
1.6 1.4 1.2 1.0 0.8 0.6 0.4 0.2 0
Normal DCIS IDC
Mean EZH2 score
p<0.001
0.18±0.41
0.89±1.09
1.49±1.12
Figure 2. Mean enhancer of zeste homologue 2 (EZH2) expression score. Mean EZH2 expression score was significantly higher in malig- nant tumors than in normal breast tissues.
Normal =normal breast tissue; DCIS =ductal carcinoma in situ;
IDC=invasive ductal carcinoma.
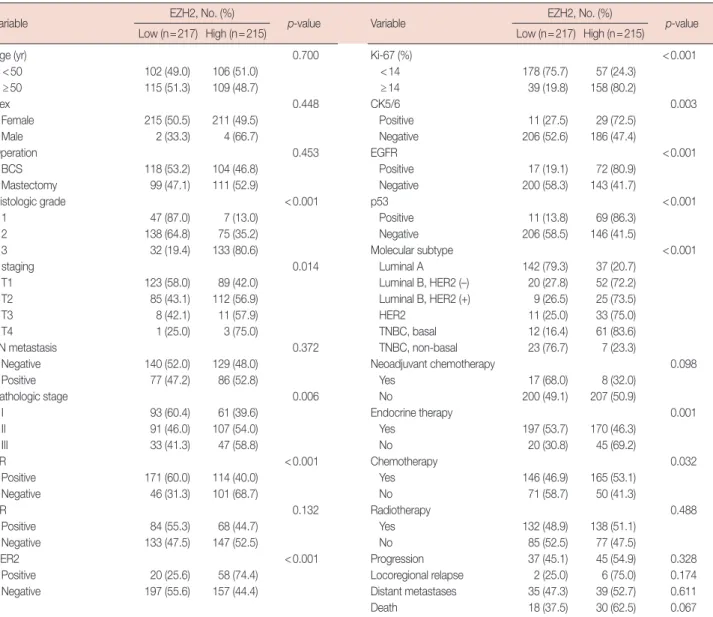
Variable EZH2, No. (%)
p-value Low (n=217) High (n=215)
Age (yr) 0.700
<50 102 (49.0) 106 (51.0)
≥50 115 (51.3) 109 (48.7)
Sex 0.448
Female 215 (50.5) 211 (49.5)
Male 2 (33.3) 4 (66.7)
Operation 0.453
BCS 118 (53.2) 104 (46.8)
Mastectomy 99 (47.1) 111 (52.9)
Histologic grade <0.001
1 47 (87.0) 7 (13.0)
2 138 (64.8) 75 (35.2)
3 32 (19.4) 133 (80.6)
T staging 0.014
T1 123 (58.0) 89 (42.0)
T2 85 (43.1) 112 (56.9)
T3 8 (42.1) 11 (57.9)
T4 1 (25.0) 3 (75.0)
LN metastasis 0.372
Negative 140 (52.0) 129 (48.0)
Positive 77 (47.2) 86 (52.8)
Pathologic stage 0.006
I 93 (60.4) 61 (39.6)
II 91 (46.0) 107 (54.0)
III 33 (41.3) 47 (58.8)
ER <0.001
Positive 171 (60.0) 114 (40.0)
Negative 46 (31.3) 101 (68.7)
PR 0.132
Positive 84 (55.3) 68 (44.7)
Negative 133 (47.5) 147 (52.5)
HER2 <0.001
Positive 20 (25.6) 58 (74.4)
Negative 197 (55.6) 157 (44.4)
Variable EZH2, No. (%)
p-value Low (n=217) High (n=215)
Ki-67 (%) <0.001
<14 178 (75.7) 57 (24.3)
≥14 39 (19.8) 158 (80.2)
CK5/6 0.003
Positive 11 (27.5) 29 (72.5)
Negative 206 (52.6) 186 (47.4)
EGFR <0.001
Positive 17 (19.1) 72 (80.9)
Negative 200 (58.3) 143 (41.7)
p53 <0.001
Positive 11 (13.8) 69 (86.3)
Negative 206 (58.5) 146 (41.5)
Molecular subtype <0.001
Luminal A 142 (79.3) 37 (20.7) Luminal B, HER2 (–) 20 (27.8) 52 (72.2) Luminal B, HER2 (+) 9 (26.5) 25 (73.5)
HER2 11 (25.0) 33 (75.0)
TNBC, basal 12 (16.4) 61 (83.6) TNBC, non-basal 23 (76.7) 7 (23.3)
Neoadjuvant chemotherapy 0.098
Yes 17 (68.0) 8 (32.0)
No 200 (49.1) 207 (50.9)
Endocrine therapy 0.001
Yes 197 (53.7) 170 (46.3)
No 20 (30.8) 45 (69.2)
Chemotherapy 0.032
Yes 146 (46.9) 165 (53.1)
No 71 (58.7) 50 (41.3)
Radiotherapy 0.488
Yes 132 (48.9) 138 (51.1)
No 85 (52.5) 77 (47.5)
Progression 37 (45.1) 45 (54.9) 0.328
Locoregional relapse 2 (25.0) 6 (75.0) 0.174 Distant metastases 35 (47.3) 39 (52.7) 0.611
Death 18 (37.5) 30 (62.5) 0.067
Table 2. Distribution of EZH2 status in 432 patients with invasive ductal carcinoma
EZH2=enhancer of zeste homologue 2; BCS=breast-conserving surgery; LN=lymph node; ER=estrogen receptor; PR=progesterone receptor; HER2=human epidermal growth factor receptor 2; CK5/6=cytokeratin 5/6; EGFR=epidermal growth factor receptor; TNBC=triple-negative breast cancer.
Table 1. EZH2 expression in normal breast tissue, ductal carcinoma in situ, and invasive ductal carcinoma (n=470)
Tissue sample EZH2 expression, No. (%)
p-value Negative (n=247) Positive (n=223)
NL 11 (100.0) 0 0.001
DCIS 19 (70.4) 8 (29.6)
IDC 217 (50.2) 215 (49.8)
EZH2=enhancer of zeste homologue 2; NL=normal breast tissue; DCIS=
ductal carcinoma in situ; IDC=invasive ductal carcinoma.
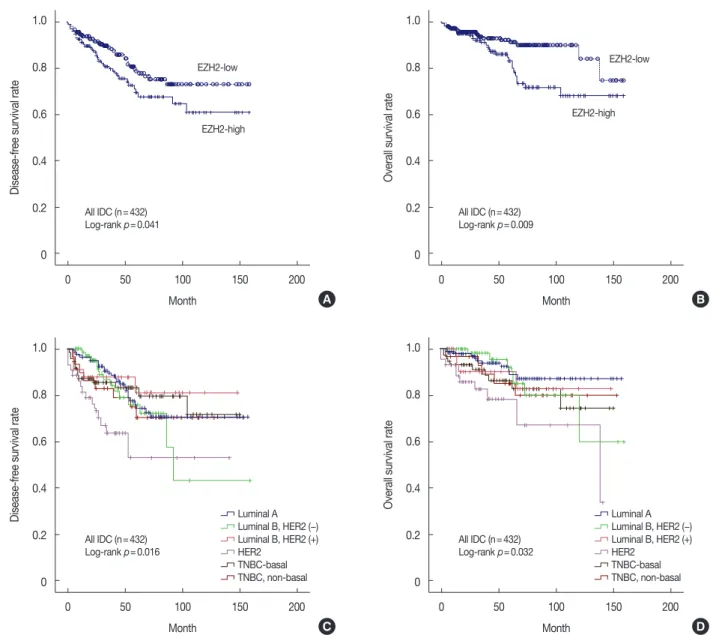
Figure 3. Kaplan-Meier survival curve for enhancer of zeste homologue 2 (EZH2) (A, B) and molecular subtypes (C, D). (A) Disease-free survival (DFS, p=0.041) and (B) overall survival (OS, p=0.009) in breast cancer (n=432). Statistically significant differences among the molecular subtypes of (C) DFS and (D) OS.
IDC=invasive ductal carcinoma; HER2=human epidermal growth factor receptor 2; TNBC=triple-negative breast cancer.
1.0
0.8
0.6
0.4
0.2
0
1.0
0.8
0.6
0.4
0.2
0
1.0
0.8
0.6
0.4
0.2
0
1.0
0.8
0.6
0.4
0.2
0
0 50 100 150 200
0 50 100 150 200
0 50 100 150 200
0 50 100 150 200
Month
Month
Month
Month
Disease-free survival rateDisease-free survival rate Overall survival rateOverall survival rate
A
C
B
D All IDC (n=432)
Log-rank p=0.041
All IDC (n=432) Log-rank p=0.016
All IDC (n=432) Log-rank p=0.009
All IDC (n=432) Log-rank p=0.032
EZH2-low EZH2-low
EZH2-high
EZH2-high
Luminal A Luminal A
Luminal B, HER2 (−) Luminal B, HER2 (−)
Luminal B, HER2 (+) Luminal B, HER2 (+)
HER2 HER2
TNBC-basal TNBC-basal
TNBC, non-basal TNBC, non-basal
Correlations between EZH2 expression and clinicopathologic parameters
High EZH2 expression significantly correlated with high histologic grade (p<0.001), large tumor size (p=0.014), ad- vanced pathologic stage (p-stage, p=0.006), negative ER ex- pression (p<0.001), positive HER2 expression (p<0.001), high Ki-67 staining index (p<0.001), positive CK5/6 expres- sion (p=0.003), positive EGFR expression (p<0.001), posi- tive p53 expression (p<0.001), endocrine therapy status (p=0.001), and chemotherapy (p=0.032) (Table 2). Other clinicopathologic variables, including age (p=0.700), sex
(p=0.448), operation method (p=0.453), lymph node metas- tasis (p=0.372), negative PR expression (p=0.132), neoadju- vant chemotherapy (p=0.098), and radiotherapy (p=0.488), did not correlate with EZH2 expression.
For molecular subtypes, high EZH2 expression was signifi- cantly associated with HER2-negative luminal B (72.2%), HER2-positive luminal B (73.5%), and HER2 type (75.0%) as well as basal TNBC (83.6%) cancers, but high EZH2 was not associated with luminal A cancer (20.7%) or non-basal TNBC (23.3%, p<0.001).
Survival analysis
The median follow-up period for all patients was 41.0 months, with a range of 1 to 158 months. At the time of analy- sis, the numbers of overall deaths and patients with disease progression were 48 and 82, respectively. The 4-year overall survival rates for IDC patients with high or low EZH2 expres- sion were 86.0% and 91.7%, respectively. By univariate analy- sis, conventional prognostic parameters, including tumor size, lymph node metastasis, and p-stage were significant predic- tors of DFS and OS (Table 3). In addition, expression levels of ER and HER2 significantly predicted DFS or OS of breast cancer patients. Patients with high EZH2 expression had a significantly worse DFS (p=0.041) and OS (p=0.009) than did patients with low EZH2 expression (Figure 3A, B). Based on molecular subtypes, the DFS (p=0.016), and OS (p=
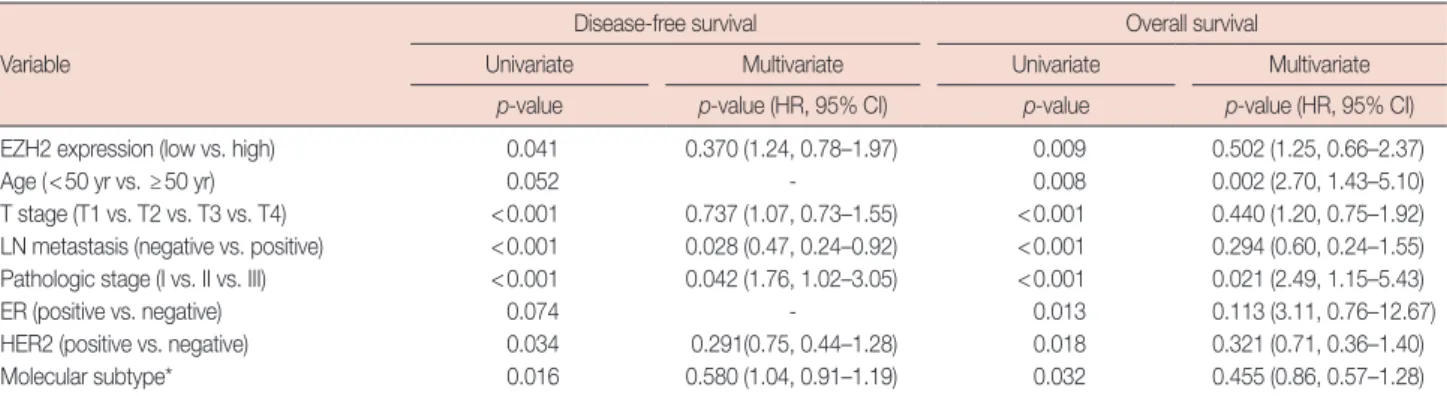
Table 3. Univariate and multivariate analysis results of disease-free survival and overall survival in 432 patients with invasive ductal carcinoma Variable
Disease-free survival Overall survival
Univariate Multivariate Univariate Multivariate
p-value p-value (HR, 95% CI) p-value p-value (HR, 95% CI)
EZH2 expression (low vs. high) 0.041 0.370 (1.24, 0.78–1.97) 0.009 0.502 (1.25, 0.66–2.37)
Age (<50 yr vs. ≥50 yr) 0.052 - 0.008 0.002 (2.70, 1.43–5.10)
T stage (T1 vs. T2 vs. T3 vs. T4) <0.001 0.737 (1.07, 0.73–1.55) <0.001 0.440 (1.20, 0.75–1.92) LN metastasis (negative vs. positive) <0.001 0.028 (0.47, 0.24–0.92) <0.001 0.294 (0.60, 0.24–1.55) Pathologic stage (I vs. II vs. III) <0.001 0.042 (1.76, 1.02–3.05) <0.001 0.021 (2.49, 1.15–5.43)
ER (positive vs. negative) 0.074 - 0.013 0.113 (3.11, 0.76–12.67)
HER2 (positive vs. negative) 0.034 0.291(0.75, 0.44–1.28) 0.018 0.321 (0.71, 0.36–1.40)
Molecular subtype* 0.016 0.580 (1.04, 0.91–1.19) 0.032 0.455 (0.86, 0.57–1.28)
HR=hazard ratio; CI=confidence interval; EZH2=enhancer of zeste homologue 2; LN=lymph node; ER=estrogen receptor; HER2=human epidermal growth factor receptor 2.
*Luminal A vs. luminal B HER2- vs. Luminal B HER2+ vs. HER2 vs. triple-negative breast cancer (TNBC) basal vs. TNBC non-basal.
Figure 4. Kaplan-Meier survival curve for enhancer of zeste homologue 2 (EZH2) in patients with luminal A type disease (n=179). (A) Disease-free sur- vival (p=0.142) and (B) overall survival (p=0.045).
1.0
0.8
0.6
0.4
0.2
0
1.0
0.8
0.6
0.4
0.2
0
0 50 100 150 200 0 50 100 150 200
Month Month
Disease-free survival rate Overall survival rate
A B
Luminal A (n=179) Log-rank p=0.142
Luminal A (n=179) Log-rank p=0.045 EZH2-low
EZH2-low
EZH2-high EZH2-high
0.032) rates were significantly different (Figure 3C, D). Lumi- nal A patient had the best survival, closely followed by HER2- negative luminal B patients during the first 40 months of fol- low-up with respect to DFS and OS. Patients with HER2-pos- itive cancer had the poorest prognoses with respect to DFS and OS. All TNBC patients (both basal and non-basal) had intermediate survival times, with deaths occurring earlier than deaths of luminal A patients.
To evaluate EZH2 positivity in IDC as an independent pre- dictor of DFS and OS, multivariate analysis using the Cox proportional hazard model was performed and included age, tumor size, lymph node metastasis, and EZH2 expression. All variables with p<0.05 in univariate analysis were included in the multivariate Cox model. Three variables, age (p=0.002, only for OS), lymph node metastasis (p=0.028, only for DFS),
and p-stage (p=0.042 and p=0.021 for DFS and OS, respec- tively) were significant prognostic factors for IDC patients (Table 3). Multivariate analysis showed no significant associa- tion between EZH2 expression and disease progression and overall death (HR, 1.24, 95% CI, 0.78–1.97, p=0.370; and HR, 1.25, 95% CI, 0.66–2.37, p=0.502).
The DFS and OS rates of the EZH2-high and -low expres- sion groups, stratified according to molecular subtype, are shown in Figure 4 and Supplementary Figure 1 (available on- line). In patients with luminal A disease, high EZH2 expres- sion was significantly associated with shorter OS compared to low EZH2 expression (p=0.045) (Figure 4B). In contrast, DFS was not significantly different between the EZH2-high and -low expression groups (p=0.142) (Figure 4A). In patients with HER2-negative luminal B disease, neither DFS nor OS was significantly different according to EZH2 expression (p=0.386 and p=0.147, respectively) (Supplementary Figure 1A, B). In patients with HER2-positive luminal B disease, nei- ther DFS nor OS was significantly different according to EZH2 expression (p=0.634 and p=0.782, respectively) (Supplemen- tary Figure 1C, D). In patients with HER2-positive disease, neither DFS nor OS was significantly different according to EZH2 expression (p=0.522 and p=0.690, respectively) (Sup- plementary Figure 1E, F). In patients with basal TNBC, nei- ther DFS nor OS was significantly different according to EZH2 expression (p=0.367 and p=0.535, respectively) (Supplemen- tary Figure 1G, H). In patients with non-basal TNBC, neither DFS nor OS was significantly different according to EZH2 ex- pression (p=0.274 and p=0.374, respectively) (Supplementary Figure 1I, J). Multivariate analysis using the Cox proportional hazard model showed that high EZH2 expression in luminal A cancer was not a significant independent prognostic factor for OS (HR, 2.85; 95% CI, 0.80–10.16; p=0.106).
DISCUSSION
In the present study, we evaluated EZH2 expression in 11, 27, and 432 normal breast tissues, DCIS specimens, and IDC specimens, respectively. EZH2 expression is significantly in- creased in DCIS and IDC compared with normal breast tis- sues, suggesting a role for EZH2 in tumorigenesis and pro- gression as a molecular marker [11,16]. EZH2 expression in DCIS has been linked to recurrence and progression of inva- sive breast cancer [12].
We investigated the associations between EZH2 in IDC and various clinicopathologic characteristics, including prognostic significance, by molecular subtype. High EZH2 expression was associated with features of aggressive tumors, such as high histologic grade, large tumor size, advanced p-stage, ER nega-
tivity, HER2 positivity, high Ki-67 proliferative index, CK5/6 and EGFR positivity, and positive p53 expression. For mole- cular subtypes, high EZH2 expression was significantly associ- ated with HER2-negative luminal B, HER2-positive luminal B, and HER2-positive cancers as well as basal TNBC. Further- more, increased EZH2 expression was significantly associated with poor DFS and OS in univariate analyses. We were also able to demonstrate an association between EZH2 expression and clinical outcomes according to molecular subtype. In pa- tients with luminal A cancer, there was a significant trend to- ward shorter OS of patients with high EZH2-expressing tu- mors compared to patients with low EZH2-expressing tumors.
Our findings regarding the association of high EZH2 ex- pression with aggressive breast cancer features are consistent with previous reports. EZH2 overexpression was previously associated with tumor diameter, stage of disease, decreasing age, negative ER status, negative PR status, lymph node status, and poor survival [11]. Another study reported that increased EXH2 expression was associated with poorly differentiated breast carcinomas [17]. A significant association between EZH2 expression and the TNBC phenotype has been de- scribed [18].
While previous reports showed no association between high EZH2 expression and HER2 positivity, our study reveals the specific association between high EZH2 expression and HER2 positivity in a cohort of patients with IDC from a single institution [11,18,19]. However, in patients with HER-positive luminal B or HER2-positive diseases, neither DFS nor OS was significantly different according to EZH2 expression. Further investigation may be warranted to reveal a role for EZH2 in HER2-positive breast cancer.
We also demonstrated a significant correlation between high EZH2 expression and positivity for CK5/6 and EGFR, which are markers commonly expressed in highly aggressive and poorly differentiated basal-like breast cancer, which might suggest that EZH2 controls the basal-like breast cancer differ- entiation state [20]. We also found a significant correlation between high EZH2 expression and both p53 overexpression and high Ki-67 proliferative index. This is consistent with pre- vious experimental findings that suggest roles for p53 and Ki- 67 in regulating EZH2 via its promoter [21,22].
Recently, Bae et al. [19] reported high EZH2 expression as a prognostic factor for shorter OS for patients with breast can- cer, including the ER+ breast cancer subtype. Similarly, we have observed that increased EZH2 expression was associated with poor survival in patients with breast cancer, including the luminal A subtype, as evidenced by univariate analyses.
If EZH2 functions in breast cancer progression, its inherent methyltransferase activity may serve as an attractive therapeutic
target. Recent studies have identified synthetic lethality upon use of targeted EZH2 methyltransferase inhibitor therapy in diffuse large B-cell lymphomas and ARID1A-mutated ovarian cancer cells [10,23]. Further studies are warranted to examine the effects of these specific EZH2 inhibitors in breast IDC.
The current study has limitations that include its retrospec- tive nature and the small sample size drawn from a single in- stitution, which is prone to selection bias. The limited number of tissues analyzed by immunohistochemical stains on TMA and the loss of some cases either due to loss of tissue cores during processing or due to lack of tumor cells might consti- tute another limitation. Another shortcoming of this study is the relatively short follow-up period to determine the survival, which made it difficult to study the impact of EZH2 expres- sion on progression and death.
In conclusion, this study indicated that EZH2 is frequently upregulated in breast malignancy, and EZH2 may function importantly in cancer development and progression. Further- more, EZH2 could a prognostic marker, especially in patients with luminal A disease. The exact role of EZH2 and its poten- tial as a novel therapeutic target for breast cancer should be investigated in future studies.
CONFLICT OF INTEREST
The authors declare no conflict of interest.
REFERENCES
1. Margueron R, Reinberg D. The Polycomb complex PRC2 and its mark in life. Nature 2011;469:343-9.
2. Tan JZ, Yan Y, Wang XX, Jiang Y, Xu HE. EZH2: biology, disease, and structure-based drug discovery. Acta Pharmacol Sin 2014;35:161-74.
3. Yamaguchi H, Hung MC. Regulation and role of EZH2 in cancer. Cancer Res Treat 2014;46:209-22.
4. Ding L, Kleer CG. Enhancer of zeste 2 as a marker of preneoplastic pro- gression in the breast. Cancer Res 2006;66:9352-5.
5. Bohrer LR, Chen S, Hallstrom TC, Huang H. Androgens suppress EZH2 expression via retinoblastoma (RB) and p130-dependent path- ways: a potential mechanism of androgen-refractory progression of prostate cancer. Endocrinology 2010;151:5136-45.
6. Bachmann IM, Halvorsen OJ, Collett K, Stefansson IM, Straume O, Haukaas SA, et al. EZH2 expression is associated with high prolifera- tion rate and aggressive tumor subgroups in cutaneous melanoma and cancers of the endometrium, prostate, and breast. J Clin Oncol 2006;24:
268-73.
7. Weikert S, Christoph F, Köllermann J, Müller M, Schrader M, Miller K, et al. Expression levels of the EZH2 polycomb transcriptional repressor correlate with aggressiveness and invasive potential of bladder carcino- mas. Int J Mol Med 2005;16:349-53.
8. Kim KH, Kim L, Choi SJ, Han JY, Kim JM, Chu YC, et al. The clinico-
pathological significance of epithelial mesenchymal transition associ- ated protein expression in head and neck squamous cell carcinoma.
Korean J Pathol 2014;48:263-9.
9. Ernst T, Chase AJ, Score J, Hidalgo-Curtis CE, Bryant C, Jones AV, et al.
Inactivating mutations of the histone methyltransferase gene EZH2 in myeloid disorders. Nat Genet 2010;42:722-6.
10. Dubois S, Mareschal S, Picquenot JM, Viailly PJ, Bohers E, Cornic M, et al. Immunohistochemical and genomic profiles of diffuse large B- cell lymphomas: implications for targeted EZH2 inhibitor therapy?
Oncotarget 2015;6:16712-24.
11. Kleer CG, Cao Q, Varambally S, Shen R, Ota I, Tomlins SA, et al. EZH2 is a marker of aggressive breast cancer and promotes neoplastic trans- formation of breast epithelial cells. Proc Natl Acad Sci U S A 2003;100:
11606-11.
12. Knudsen ES, Dervishaj O, Kleer CG, Pajak T, Schwartz GF, Witkiewicz AK. EZH2 and ALDH1 expression in ductal carcinoma in situ: com- plex association with recurrence and progression to invasive breast can- cer. Cell Cycle 2013;12:2042-50.
13. Alford SH, Toy K, Merajver SD, Kleer CG. Increased risk for distant metastasis in patients with familial early-stage breast cancer and high EZH2 expression. Breast Cancer Res Treat 2012;132:429-37.
14. Lakhani SR, Ellis IO, Schnitt SJ, Tan PH, van de Vijver MJ. WHO Clas- sification of Tumours of the Breast. 4th ed. Lyon: International Agency for Research on Cancer; 2012.
15. Allred DC, Harvey JM, Berardo M, Clark GM. Prognostic and predic- tive factors in breast cancer by immunohistochemical analysis. Mod Pathol 1998;11:155-68.
16. Ding L, Erdmann C, Chinnaiyan AM, Merajver SD, Kleer CG. Identifi- cation of EZH2 as a molecular marker for a precancerous state in mor- phologically normal breast tissues. Cancer Res 2006;66:4095-9.
17. Raaphorst FM, Meijer CJ, Fieret E, Blokzijl T, Mommers E, Buerger H, et al. Poorly differentiated breast carcinoma is associated with increased expression of the human polycomb group EZH2 gene. Neoplasia 2003;
5:481-8.
18. Hussein YR, Sood AK, Bandyopadhyay S, Albashiti B, Semaan A, Nahleh Z, et al. Clinical and biological relevance of enhancer of zeste homolog 2 in triple-negative breast cancer. Hum Pathol 2012;43:1638- 44.
19. Bae WK, Yoo KH, Lee JS, Kim Y, Chung IJ, Park MH, et al. The methyl- transferase EZH2 is not required for mammary cancer development, although high EZH2 and low H3K27me3 correlate with poor progno- sis of ER-positive breast cancers. Mol Carcinog 2015;54:1172-80.
20. Granit RZ, Gabai Y, Hadar T, Karamansha Y, Liberman L, Waldhorn I, et al. EZH2 promotes a bi-lineage identity in basal-like breast cancer cells. Oncogene 2013;32:3886-95.
21. Athanassiadou AM, Tsipis A, Patsouris E, Gonidi M, Nicolopoulou- Stamati P, Chelidonis G, et al. Enhancer of zeste homologue 2 expres- sion in breast carcinoma smears in relationship with p53, Ki-67 and other prognostic parameters. Acta Cytol 2011;55:180-6.
22. Tang X, Milyavsky M, Shats I, Erez N, Goldfinger N, Rotter V. Activated p53 suppresses the histone methyltransferase EZH2 gene. Oncogene 2004;23:5759-69.
23. Bitler BG, Aird KM, Garipov A, Li H, Amatangelo M, Kossenkov AV, et al. Synthetic lethality by targeting EZH2 methyltransferase activity in ARID1A-mutated cancers. Nat Med 2015;21:231-8.