An Investigation of the Fear of Crime in the Neighborhoods:
The Case Study of Youngtong, Suwon
Jun-Ho Ko*
근린에서의 범죄의 두려움에 대한 고찰 -수원 영통을 사례로-
고준호*
Abstract:This paper aims to analyze fear of crime which is considered socio-psychologically important in our daily lives from a geographical point of view. Especially, the spatial patterns of the fear of crime which were analyzed in the area of Youngtong in Suwon city. First, this paper takes a look at the correlation between the incidence of crime and the fear of crime. Most people feel fear in actual crime scenes, but they do not always coincide with place where people feel the high level of fear. Fear of crime is closely connected with physical environments as well as the incidence of crime. The level of fear is high in places where the light is dark, unfrequented paths, especially in parks and around mountains. Several factors which have effects on fear of crime operate differently upon place. Second, a survey which measures the fear of crime was quantitatively analyzed. Factor analysis was employed to find out whether questions are appropriate for measuring the fear of crime as well as to reduce the amount of data so that more exact result can be derived from the data. Through the factor analysis, seven factors were extracted and it is found that a factor of incivility accounts for 24.032% of variance. Other factors which affect fear of crime are community cohesion, warning, incidence of crime, victimization, morality and authority.
Key Words : fear of crime, crime hot spot, factor analysis
요약:본 연구는 일상생활에서 사회-심리적으로 중요하게 여겨지는 범죄의 두려움을 지리적 관점에서 분석한 것이다. 특별히, 수 원시 영통 지역을 사례로 범죄의 두려움의 공간적 패턴을 분석하였다. 첫째, 범죄 발생과 범죄의 두려움과의 상호 관련성을 살펴보 았다. 실제 범죄 발생 장소와 두려움을 느끼는 장소는 어느 정도 일치하지만, 가장 두려움을 많이 느끼는 장소는 일치하지 않았다.
범죄의 두려움은 범죄의 발생뿐만 아니라 물리적 환경과 깊은 관련성이 있다. 두려움의 수준은 조명이 어둡고, 인적이 드문 길, 특 히, 공원과 산 주변에서 높다. 범죄의 두려움에 영향을 미치는 여러 가지 요인들은 장소에 따라 다양하게 작용한다. 둘째, 범죄의 두 려움을 측정하는 설문지를 계량 분석하였다. 범죄의 두려움을 측정하는데 있어서 설문 문항의 적절성 여부를 파악하고, 많은 양의 자료를 축소하기 위하여 요인 분석을 실시하였다. 요인 분석을 통하여 7개의 요인이 추출되었고, 무례한 행동(incivility)이 범죄의 두려움을 가장 많이 설명하는 요인(24.032%)으로 나타났다. 두려움에 영향을 주는 다른 요인들로는 공동체 유대, 주의, 범죄 발생, 피해자, 윤리의식, 공권력 등이 있다.
주요어 : 범죄의 두려움, 범죄 집중 장소, 요인 분석
* Teacher, Cheongmyeong Highschool(Graduate Student, Korea National University of Education), [email protected]
1. Introduction
Modern people always have concerns and anxieties about their body and property in daily lives. They are especially afraid that crimes might take place to them and feel uneasy of becoming the victim of crimes. So, the fear of crime is a very important socio-spatial issue to people.
People are afraid not only of crimes or criminals but also of going around places where crimes are frequently committed. Those places have one common feature. They have a geographical attribute of hot spot, even though there are several factors that have impacts on incidents of crime. Many people have the fear of these places and try to avoid areas perceived as unsafe. A number of factors are related to the fear of crime.
For example, it is influenced by personal experiences and by perceptions of the environment which threaten danger. People may be more likely to express anxieties about their safety(Skogan and Maxfield, 1981).
Everyone has the feeling of fear and it is very subjective. Fear of crime can seriously impair quality of life. This fear of crime may have more effects on residents in the neighborhood than an actual crime. People who believed that crime in their neighborhoods was increasing or was higher than in other places, tended to be more fearful.
Fear of crime is still unfamiliar to us. It was first identified as a problem by US researchers on the President’s Commission on Law Enforcement and Administration of Justice(1967), and it has remained of considerable interest to scholars ever since.1)
Geographical studies on it have been partially made overseas, but there was not any progress in Korea. Early studies were made about the
relationship between physical environment and fear of crime. (e.g., Smith, 1987a; Van der Wurff and Stringer, 1989; Coleman, 1990; Herbert and Davidson, 1995; Fyfe and Bannister, 1996). With that, studies on how the interaction between places and several elements of society has an impact on fear of crime have been made. (e.g., Pain, 1991; Valentine and McKendrick, 1997).
Within sociology and criminology, one of the key research findings of the last 10 to 15 years has been the importance of fear of crime in Korea. Therefore, geographic researches on it are strongly required.
Along these perspectives, the purpose of this paper is to explain the relationship between crime(an objective fact) and fear(a subjective feeling) and to examine its characteristics closely.
2. Materials and Methods
1) Study area
Youngtong-dong is located in Youngtong-gu, the eastern part of Suwon, Kyeonggi-do. It is an area where apartment complexes are crowded stretching from northeast to southwest over Mt.
Cheongmyeong. Nine apartment complexes had been built within an area of one million p’yong2) and 26,000 households have moved into them since 1997. Most occupants were employees of Samsung Electronics and cooperative parts suppliers at first because Samsung Electronics was adjacent to Youngtong. As a network of transportation was equipped and various kinds of convenient facilities were built, youths who worked in Seoul and newly weds swarmed into Youngtong. Youngtong became one of the best suburban residential areas in a short time.
According to the statistics, the average age of people who live in Youngtong is 29 and lowest in Korea because of population inflow of youths.3)
Because the third, fourth, sixth, and seventh complexes are located near Joongsang(central commercial district of Youngtong area)4) where convenient facilities are concentrated and the price of real estate is much higher than any other area in Suwon. Also, Youngtong is the center of education and is well-known for its highest enthusiasm for education. There are ten elementary schools, middle schools, and high schools in apartment complex areas and students are shielded from harmful surrounding environments.
Joongsang area is located between Home Plus and Grand Department Store on both sides of the Youngtong main road and surrounded by apartment complexes. It exceeded both Nammun5) which had been the greatest market area for so long and Suwon Station market which has been developing since 2003.
Youngtong became the biggest market and amusement area in Suwon. According to retailers, lots of people from other areas in Suwon, such as Kwonsun-gu, Paldal-gu tend to visit Youngtong to have a lot of fun at night.
Moreover, even people from adjacent areas to Suwon such as Yongin, Giheung, Singal, and Hwasung want to enjoy themselves in Youngtong..
Youngtong is a new residential area of Suwon.
The household income level of Youngtong is high and lots of entertainment places are concentrated there. So, Youngtong was chosen as a study area because its conditions are considered appropriate for investigating fear of crime.
2) Data and method
This paper compared the indicator of fear of crime with that of safety in walking at night firstly. Second, this paper mapped places where actual crimes were committed and verified that they were associated with fear of crime. Finally, a survey questionnaire was analyzed.
For this study, statistical data of the National Police Agency was collected. Also, the result of a survey regarding fear of crime was analyzed and mapped. The statistics of the National Police Agency about specific 5 offences such as a rape, burglary, murder, violence, and theft that occurred in Youngtong between 1st January and 31st December 2005 were analyzed. Except for 47 cases of crimes which could not be mapped because their place numbers were not identified, 628 cases were mapped out of total 675 cases.
The survey was conducted on high school students and women(mostly their mothers) who seem most vulnerable to crime in March 2006.
About 250 copies for students and 150 copies for women were distributed and 223 copies for students and 89 copies for women were taken back.
Respondents marked spots where they felt fear of crime and answered questions regarding fear.
The maps for the individual respondents were digitized and overlaid using ArcView GIS. After that, Hot Spots were mapped, and then Standard Deviational Ellipse were presented to find out the main trend.
The questionnaire about fear of crime was composed of 20 questions based on a Likert scale(5 point scale) which is commonly used for figuring attitude and value. Scores to 20 questions were input in SPSS for statistical analysis.
What is made clear in this study is like these:
First, do people actually feel fear in places where crimes are committed? Second, what are characteristics of places where people feel fear of crime? Third, what are factors which affect fear?
3. Fear of Crime
1) Definition
People are always concerned about the safety of their body and property. One of factors that threaten this safety is crime. Worries and concerns about this safety are connected with fear of crime. Fear is not only a portion of person’s rational responses to crime and threat, but also the result of their perception and cognition of crime. So, fear of crime varies among persons and among places.
It is hard to define fear of crime clearly, but let’s take a look at several definitions by previous researchers. Furstenberg(1972) distinguished fear and general concern. The fear is a anxiety produced by encountering a suspicious looking stranger on the street. Fear involves a personalized threat rather than abstract beliefs and attitude about crime
Garofalo(1981) distinguished actual fear and
potential fear. The former fear is the feeling of someone when confronted by an assailant at night. The latter emotion is experienced by someone who anticipates the possibility of a risky situation. Such anticipated fear is closer to fear of crime.
Then, what causes fear of crime? The answer to this question can be explained by two main models. One is an indirect victimization model that Skogan and Maxfield(1981) proposed. This model is that crime victims tell neighbors and acquaintances about what has happened to them. The latter then become more fearful. Thus, local communication about crime and crime- related issues boosts residents’ fear levels.
The other is a disorder model that Wilson and Kelling(1982)6) developed. If people see more physical and social signs of decay around where they live, they will feel more vulnerable and fearful. Physical signs of decay include abandoned houses and cars, graffiti, vacant lots littered with trash, and so on.
2) Measurement of fear
The question which is easily and widely used to measure fear is “how much do you feel fear of crime?” or “Do you feel fearful when walking alone at night?” Responses to these questions are
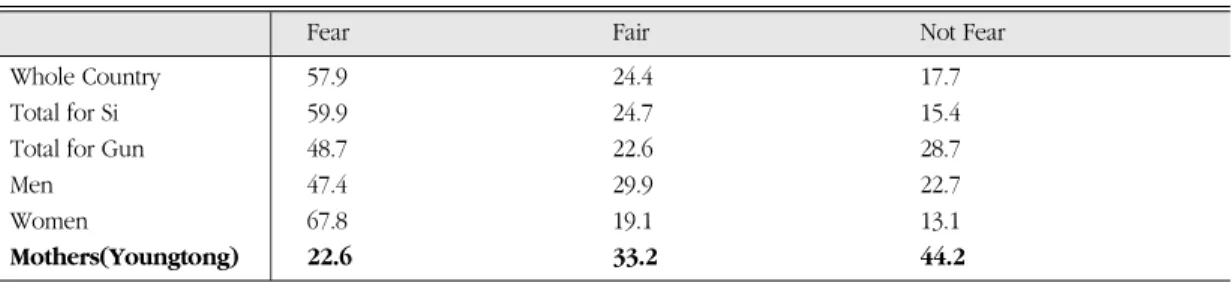
Table 1. Percentage in perceptions of fear of crime (unit: %)
Fear Fair Not Fear
Whole Country 57.9 24.4 17.7
Total for Si 59.9 24.7 15.4
Total for Gun 48.7 22.6 28.7
Men 47.4 29.9 22.7
Women 67.8 19.1 13.1
Mothers(Youngtong) 22.6 33.2 44.2
Source: Korea National Statistical Office, 2005, Report on the Social Statistical Survey.
shown in Table 1, 2. As you can see in Table 1, the level of fear in urban areas(Si) is greater than that in rural areas(Gun) and in women higher than in men. This is a universal phenomenon which results from environmental and physical differences. It is noteworthy that in the National Survey the level of fear in our whole country is 57.9%, which is much higher compared to that in Youngtong where the level of fear is 22%. The gap between the two is great. This may be partly due to the difference of a survey method, but it can be also interpreted that residents in Youngtong are not comparatively sensitive to crime. And residents in Youngtong think that their neighborhoods are safer than any other region.
Table 2 shows that people who live in Si and women feel high level of fear when walking alone at night like Table 1. The level of fear of crime in Youngtong is low, but mothers in Youngtong still feel a little more danger than those in the whole country when walking at night. This means that streets in Youngtong at night do not make people feel safe psychologically compared with the level of the incidence of crime. In other words, environments such as a surrounding entertainment center, university town, and huge apartment complexes
make people feel dangerous when walking along streets in Youngtong at night.
There are several reasons why people feel fear walking at night. Among them, the most important one is that there are few people around. The second important reason is that there is no light. The level of fear is highest when there are fewer people around and a stranger approaches from the opposite direction even though streets are well-lit. Generally, the crime rate is high in multi-functional downtown areas(Ko, 2001), and a high crime rate is directly linked with fear. But people feel a higher level of fear when they are in unfrequented places at night because of the increased chance of danger.
The percentage of others among reasons is quite high(10.8%) because they include no response.
As you can see above, fear of crime and safety at night vary among regions, and genders. It is supposed that these cause avoidance of specific places.
3) Mapping (fear) of crime
628 crimes that occurred in Youngtong were mapped regardless of their relative seriousness and types as shown in Figure 1. A crime map was overlaid with a satellite photograph to add Table 2. Percentage of feeling and reasons for safety of walking at night (unit: %)
Not Reasons
Dangerous
dangerous Very few
No Light Area with
Other
people around frequent crime
whole country 42.6 57.4 62.7 28.0 8.5 0.8
Total for Si 44.4 55.6 63.4 26.8 9.1 0.7
Total for Gun 34.4 65.6 59.0 35.3 4.8 0.9
Men 30.8 69.2 59.1 30.0 10.3 0.6
Women 53.9 46.1 64.7 26.9 7.5 0.9
Mothers(Youngtong) 58.2 41.8 56.1 27.3 5.8 10.8
Source: Korea National Statistical Office, 2005, Report on the Social Statistical Survey.
Figure 1. Crimes occurred in Youngtong, 2005
Figure 2. Hot spots of crime in Youngtong
Figure 3. Spots are students’ feeling of fear
Figure 4. Hot spots of students’fear of crime
Figure 5. Spots are women (mothers)’s feeling of fear
Figure 6. Example of buffers (students’fear spot) at 30m radius from crime
reality. As you can see in Figure 1, crimes are not evenly distributed. Rather, they are concentrated in specific places(hot spots), especially in central commercial district.
Figure 2 shows crime hot spots in Youngtong.
It can be seen that there are several distinct hot spots within the central commercial district, the largest one of which is located on entertainment street. Others are located in nightclub and shopping buildings.
While there is no absolute definition of a hot spot, it is often noted that incidents, particularly crime incidents, tend to be concentrated in a limited number of locations(Block and Block, 1995).
From an analytic perspective, tools that identify hot spots are very useful to police departments because they tend to focus their deployment and prevention resources on the areas that are most likely to generate incidents(Levine, 2004).
Then, do people have the highest level of fear in hot spots? The answer can be easily found in Figure 3, 4 and 5. Most students and their mothers feel fear around hot spots, but there are exceptional cases.
Students and women(mothers) feel most fearful in parks and Mt. Dokchim. Parks function as a resting place for people in the daytime, but tend to give people fear at night. Actually, crimes seldom occur in Bandal park and Mt. Dokchim, but students and mothers feel most fearful there.
Also, sidewalks adjacent to Mt. Cheongmyeong are second most fearful places to them. These sidewalks are adjacent to residential areas, so there are few people around at night.
Physical(built) environments causes fear regardless of the incidence of crime. Especially, quiet narrow paths, secluded parks, alleys in residental areas and amusement centers make
people feel more fear.
Fear of crime rises when people witness actual crime scenes, they hear about crime incidents from other people and the media, and they are in poor physical environments. Of course, these factors do not have the same effect on people.
Table 3 is a buffer analysis7)between crime and the fear of crime according to different distances.
Students’ fear spots were selected according to the distance from a crime. This buffer analysis shows the correlation between crime and fear.
Fear spots which students selected between 10m and 70m from crime were shown as a percentage. The percentage is 8.72% within 10m from crime, while the percentage is 71.14%, very high within 70m. As a result, students feel fear in places where many crimes are committed. In Figure 6, selected features within the radius of 30m from crime are highlighted.
One of the places where students feel most fearful is parks, as shown in Figure 3. The level of fear is high around Mt. Cheongmyeong, quiet paths which are adjacent to it, and surrounding apartment complexes. Those places have street lights but few people around.
Figure 7 shows Standard Deviational Ellipses8) of crime and fear of crime which students and Table 3. Buffers for crime and students’ fear spots
by different distances selected features from
students’ fear spots %
10m 26 8.72
20m 66 22.15
30m 107 35.90
40m 144 48.32
50m 176 59.06
60m 201 67.45
70m 212 71.14
Note: fear spots of students totaled 298.
mothers’ feel. The mean center of students is similar to that of mothers, and it is 400m to the north of the mean center of crime. There is probably a higher concentration of fear of crime in the northeast, and very possibly a smaller concentration in the southwest. The Mean center of crime appears to be located in the middle of the central commercial district. The direction of major axes is also a little different between crime and the fear of crime. The overall crime and fear of crime seem to trend in the northeast to southwest direction. And, the fear of students and mothers is very similar from east and west regarding the degree of dispersion, but fear of students is more dispersed north and south. This means that mothers’ fear is more concentrated around its mean center.
4) Survey analysis
Jacobs(1961) discussed the interaction of the physical environment with its inhabitants and how important this is in the life and vitality of a street or neighborhood. She wrote “the basis for community security is a strong sense of social cohesion and a feeling of control over one’s home turf.”
What are factors which have effects on fear?
Many questions was made to find out factors about fear of crime in Youngtong. Factor analysis was employed to summarize information through condensation of many questions into a few relevant ones and it intended to find out whether variables which measure the same concept could be grouped into the same factor.
Also, Factor analysis was made to compare Youngtong with other neighborhoods in the following study.
Figure 7. Standard deviational ellipses for the crime and fear of crime
In table 5, KMO and Bartlett’s test shows whether the correlation is appropriate for factor analysis. KMO should be greater than 0.5. If KMO is below 0.5, it means that variables are not suitable for factor analysis. Bartlett’s test of sphericity should be statistically significant at p
<0.05. This means that the correlation matrix is not an identity matrix. So, it is concluded that the strength of the relationship among variables is strong enough to proceed factor analysis for the data.
In the factor analysis where the number of samples is over 50, a factor loading generally deserves to be considered important if it is more than 0.3. And if a factor loading is more than 0.4, it should be considered more important. If a factor loading is more than 0.5, it is considered a quite meaningful value.
It is quite clear that seven factors are finally extracted from 20 variables by eigenvalues(over 1.0). The cumulative percentage of seven factors is 70.784% and is considered to be good in social and scientific statistics analysis(Table 6).
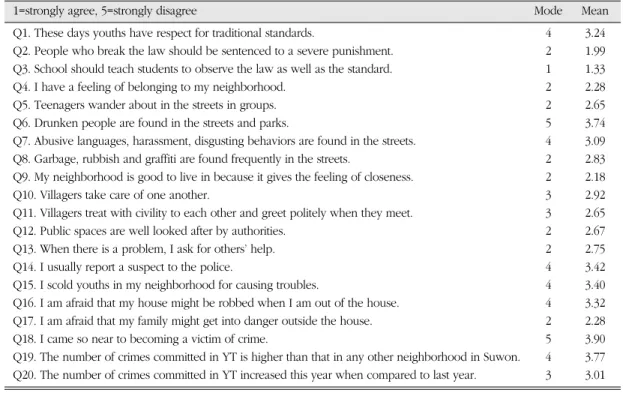
Let’s take a look at each factor. Factor I is a critical and its percentage of total variance is 24.032%. That is why Factor I becomes a primary one. And it includes Q6, Q8, Q7 and Q5, whose loadings are all above 0.6. This factor is concerned with immoral behaviors such as drunken people, garbage, and disgusting Table 4. Descriptive statistics for questionnaire
1=strongly agree, 5=strongly disagree Mode Mean
Q1. These days youths have respect for traditional standards. 4 3.24
Q2. People who break the law should be sentenced to a severe punishment. 2 1.99 Q3. School should teach students to observe the law as well as the standard. 1 1.33
Q4. I have a feeling of belonging to my neighborhood. 2 2.28
Q5. Teenagers wander about in the streets in groups. 2 2.65
Q6. Drunken people are found in the streets and parks. 5 3.74
Q7. Abusive languages, harassment, disgusting behaviors are found in the streets. 4 3.09 Q8. Garbage, rubbish and graffiti are found frequently in the streets. 2 2.83 Q9. My neighborhood is good to live in because it gives the feeling of closeness. 2 2.18
Q10. Villagers take care of one another. 3 2.92
Q11. Villagers treat with civility to each other and greet politely when they meet. 3 2.65
Q12. Public spaces are well looked after by authorities. 2 2.67
Q13. When there is a problem, I ask for others’ help. 2 2.75
Q14. I usually report a suspect to the police. 4 3.42
Q15. I scold youths in my neighborhood for causing troubles. 4 3.40
Q16. I am afraid that my house might be robbed when I am out of the house. 4 3.32 Q17. I am afraid that my family might get into danger outside the house. 2 2.28
Q18. I came so near to becoming a victim of crime. 5 3.90
Q19. The number of crimes committed in YT is higher than that in any other neighborhood in Suwon. 4 3.77 Q20. The number of crimes committed in YT increased this year when compared to last year. 3 3.01 Note: n = 155.
Table 5. KMO and Bartlett’s Test Kaiser-Meyer-Olkin Measure
0.688 of Sampling Adequacy
Approx.
1210.649 Bartlett’s Test of Chi-Square
Sphericity Df 210
Sig. 0.000
behavior, so the increase of those behaviors seems to have strong effect on the increase of fear. According to the related variables are grouped into one. It can be named Incivilities.
Factor II accounts for 11.528% of total variance.
It includes Q10(0.836), Q4(0.637), Q11(0.627) and Q9(0.612), which are related to taking care of neighbors and intimacy. The sense of belonging and attachment to a community can diminish the fear level by playing a role of crime prevention. Therefore, Q10, Q4, Q11, Q9 are grouped into second factor. So we can name Community Cohesion.
Factor III is concerned with admonition(0.704),
safety of home(0.681) and law education(-0.602), therefore Q15, Q16 and Q3 were classified into factor of Warning. In taking a look at their factor loading, they are similar in absolute values, but different in direction(plus/minus). This means that Q15, Q16 and Q3 are factors which have an opposite trend even though they share similar characteristics.
Factor IV is related to increase of crime(0.725) and safety of family(0.680), so Q20 and Q17 are put into Incidence of Crime.
Factor V is concerned with victims of crime(0.767), supervision of public space(-0.549) and number of crimes(0.491). As you can see, if Table 6. Structure matrix of seven factors by varimax rotation
Variables Factor Commu
I II III IV V VI VII nality
Q6 .808 -.028 .197 .192 .021 -.030 -.035 .732
Q8 .798 -.060 .066 .133 .121 .276 -.011 .753
Q7 .719 -.102 .140 .110 .199 -.109 -.309 .706
Q5 .665 -.066 -.179 .356 .000 -.241 -.239 .720
Q10 .072 .836 .007 -.128 -.037 .054 .105 .736
Q4 -.040 .637 -.315 .103 -.208 -.352 .168 .713
Q11 -.445 .627 .127 -.007 .167 .071 -.064 .644
Q9 -.536 .612 -.226 .134 -.072 -.069 -.110 .752
Q15 .063 .367 .704 .137 .116 .040 .202 .709
Q16 .195 -.276 .681 .397 .003 -.066 .070 .745
Q3 .042 .231 -.602 .357 -.290 -.026 .104 .640
Q20 .135 .069 .184 .725 .193 -.077 -.141 .645
Q17 .250 -.047 -.041 .680 -.225 .304 .065 .676
Q18 .031 .017 .178 .024 .767 .163 -.120 .662
Q12 -.445 .483 .202 .163 -.549 .025 .007 .801
Q19 .357 .005 .446 .336 .491 -.179 -.045 .715
Q1 -.062 -.110 -.010 .063 .119 .875 -.082 .806
Q13 .126 .344 -.022 -.056 -.111 .596 .542 .799
Q14 -.241 -.018 .187 -.033 -.154 -.017 .747 .677
Q2 -.303 .189 -.421 .029 .155 -.103 .509 .600
Eigenvalue 5.047 2.421 2.083 1.677 1.333 1.207 1.098
% of total Variance 24.032 11.528 9.917 7.985 6.349 5.746 5.227
Cumulative % 24.032 35.560 45.477 53.462 59.811 65.557 70.784
Name Incivilities Community
Warning Incidence
Victimization
Cohesion of Crime Morality Authority
public places whose level of fear is highest such as parks are well supervised by authorities, fear will diminish. As the case of crimes increases more, the possibility of victimization becomes higher. So, Q18, Q12 and Q19 are named Victimization.
Factor VI accounts for 5.746% of total variance.
It is related to respect(0.875) and help(0.596), so Q1 and Q13 are put into factor of Morality.
Factor VII is concerned with report(0.747) and punishment(0.509), and its variance is 5.227%, which is lowest. Q14 and Q2 are put into Authority.
Judging from the result of this study, it turns out that seven factors should be considered to measure the fear of crime in the place as Figure 8. In the schema of fear of crime, incivilities can be the most important factor. Of course, there are many things which cannot be dealt with in this study. Therefore, perhaps in the next study, a new survey is going to be made by making questions which correspond to place and region.
4. Conclusion
Although fear of crime is a quite meaningful subject in geography, it has not been dealt with in Korea. So, through this case study, the relationship between crime and fear of crime was verified and factors which have effects on fear of crime were analyzed. The methods used in this study are crime mapping, buffer analysis, SDE and factor analysis. Crime data was collected from National Police Agency.
First, many crimes occurs in Joongsang(central commercial district in Youngtong), so the possibility of victimization is high and fear of crime is generated to residents in neighborhood.
Second, it proves that fear of crime has close relevance to physical environments. The level of fear is high in darkness, unfrequented paths, and especially in parks and around mountains. For example, fear of crime reaches the peak in walking around uncared-for places alone at night
Finally, factor analysis was employed as an attempt to condense broad questions concerning the relationships between important variables.
Through the factor analysis which has influences Figure 8. Components of Fear of Crime in the Place
on fear of crime, seven factors are extracted.
Especially, incivilities are most important factor to fear of crime.
Wrapping up, the geographic study on the relationship between fear and crime occurrence shows that they are closely spatially connected.
Especially, environmental and social aspects have strong effects on the fear of crime. Also, fear of crime varies according to the way individuals perceive and recognize places.
In this study, the followings are left as the limitation and further work. Crimes which affect the fear were mapped regardless of their types and seriousness, so it is necessary to put weighted values considering their relative importance. Second, factor analysis which was used in this study is for socio-psychological research. So, factor analysis for geographical explanation of the place is needed in next study.
Lastly, there were lots of difficulties measuring people’s subjective feeling. To handle this problem, various methods to analyze people’s feeling quantitatively are called for.
Consequently, further studies are necessary to correct and complement several weakness on the basis of the results from this study.
Acknowledgements
The author would like to acknowledge the endeavors of the very many people who have made this research possible.
Notes
1) Maxfield, M.G., 1984, Fear of Crime in England and Wales, Home Office Research Study No. 78, 1.
2) 1 p’yong=3.954 sq. yds.
3) Dong-A Ilbo(Newspaper) 2004. 09. 25.
4) Residents in Youngtong have called it Joongsang (abbreviation for Joongsim-sangga: central commercial district).
5) The Nammun(Paldalmun) is one of four gates and is the south gate of the Suwon Hwaseong Fortress.
6) Broken windows theory is that observed disorder directly causes predatory or serious crime.
7) A buffer is a zone around an object. Buffering tools in GIS program make this a relatively simple task.
Techniques for selecting objects can be used to identify certain types of events(Harries, 1999).
8) The purpose of SDE is to capture the directional bias in a point distribution. It means that the points do not disperse around the center equally in all direction.
References
Choi, I.S. and Park, S.J., 1995, Criminal Victimization in Korea, Korean Institute of Criminal Justice Policy.
Coleman, A., 1990, Utopian on Trial, Hilary Shipman, London.
Doran, B.J. and Lees, B.G., 2005, Investigating the spatiotemporal links between disorder, crime, and the fear of crime, Professional Geographer, 57, 1-12.
Furstenberg, F. F. Jr., 1972, Fear of Crime and its Effects on Citizen Behaviour, in Biderman, A.(ed.), Crime and Justice: A Symposium, Nailburg, New York.
Fyfe, N.R. and Bannister, J., 1996, City watching: closed circuit television surveillance in public spaces, Area, 28, 37-46.
Garofalo, J., 1981, The fear of crime: causes and consequences, Journal of Criminal Law and Criminology, 72, 839-857.
Harries, K., 1999, Mapping Crime: Principle and Practice, United States National Institute of Justice.
Herbert, D. and Davidson, N., 1995, Modifying the built
environment: the impact of improved street lighting, Geoforum, 25, 339-350.
Jackson, J., 2004, Experience and expression: social and cultural significance in the fear of crime, British Journal of Criminology, 44, 946-966.
Jacobs, J., 1961, The Death and Life of Great American Cities, Vintage, New York.
Kline, P., 1994, An Easy Guide to Factor Analysis, Routledge, London.
Ko, J.H., 2001, Crime patterns of CBD in Cheongju city, Journal of the Korean Geographical Society, 36, 329-341.
Korea National Statistical Office, 2005, Report on the Social Statistics Survey.
Levine, N., 2006, Crime mapping and the Crimestat program, Geographical Analysis, 38, 41-56.
Maxfield, M.G., 1984, Fear of Crime in England and Wales, Home Office Research Study No. 78.
Pain, R., 1991, Space, sexual violence and social control:
integrating geographical and feminist analyses of women’s fear of crime, Progress in Human Geography, 15, 415-431.
Ratcliffe, R.H. and McCullagh, M.J., 1999, Hotbeds of crime and the search for spatial accuracy, Journal of Geographical Systems, 1, 385-398.
Ryu, S.J., 2007, A Study on the Spaces of Juvenile Delinquency Occurred and Perceived: Based on the Cases of Busan, M.E. Thesis, Korea National University of Education.
Sim, Y.H., Kim, J.H., Choi, I.S., Jo, J.H., and Park, J.S., 1992, A Victimization Survey in Seoul, Korean
Institute of Criminal Justice Policy.
Skogan, W. and Maxfield, M., 1981, Coping with Crime, Sage, Beverly Hills.
Smith, S.J., 1987a, Design against crime? Beyond the rhetoric of residential crime prevention, Property Management, 5, 146-150.
Smith, S.J., 1987b, Fear of crime: beyond a geography of deviance, Progress in Human Geography, 11, 1- 23.
Valentine, G. and McKendrick, J., 1997, Children’s outdoor play: exploring parental concerns about children’s safety and the changing nature of childhood, Geoforum, 28, 219-235.
Van der Wurff, A. and Stringer, P., 1988, Locations of fear, in Sime, J.D.(ed.), Safety in the Built Environment, Spon, Portsmouth.
Wilson, J.Q. and Kelling, G.L., 1982, The police and neighborhood safety: broken windows. The Atlantic Monthly (March 1982), 29-38.
Correspondence: Jun-ho Ko, Department of Geography Education, Korea National University of Education, Chungbuk, 363-791, South Korea(e-mail:
mina91@dreamwiz. com, phone: +82-43-230-3616) 교신 : 고준호, 363-791, 충청북도 청원군 강내면 다락리 산
7번지, 한국교원대학교 제2대학 지리교육과(이메일:
[email protected], 전화: 043-230-3616, 팩스:
043-233-2207)
Received May 28, 2007 Accepted June 20, 2007