Usefulness of a Pharmacokinetic Model Based on Dynamic Contrast-enhanced MRI for the Detection and
Localization of Prostate Cancer
1Ae Kyung Jeong, M.D., Jeong Kon Kim, M.D.2, Kyoung-Sik Cho, M.D.2
1Department of Radiology, Ulsan University Hospital, South Korea
2From the Department of Radiology, Asan Medical Center, University of Ulsan, South Korea.
Received May 17, 2007; Accepted August 2, 2007
Address reprint requests to : Jeong Kon Kim, M.D., Department of Radiology, Asan Medical Center, University of Ulsan, 388-1 Poongnap-dong, Songpa-gu, Seoul 138-736, South Korea.
Tel. 82-2-3010-4355 Fax. 82-2-476-0090 E-mail: rialto@ amc.seoul.kr
Purpose: To investigate the usefulness of a pharmacokinetic model based on dynamic contrast-enhanced (DCE) MR imaging for the detection and localization of prostate cancer.
Materials and Methods: Forty-four patients that had undergone radical prostatectomy for prostate cancer and dynamic contrast enhanced (DCE) MR imaging (slice thick- ness, 4 mm; time resolution of each set, 5 seconds), were enrolled in the study. From the pharmacokinetic model, the time of arrival, and the parameters Ah, Kep, and Kel were extracted and were compared for cancerous tissue and non-cancerous tissue in the central gland and peripheral zone. The diagnostic performance of each parameter for differentiating cancerous tissue from non-cancerous tissue was evaluated using re- ceiver-operating-characteristics analysis.
Results: The Kep and Kel values were significantly greater in cancerous tissue (0.13 sec-1± 0.14 and 1.59 × 10⁻³sec-1± 1.35 × 10⁻³) than in non-cancerous tissue from the central gland (0.03 sec-1± 0.02 and 0.26 × 10⁻³sec-1± 1.24 × 10⁻³) and peripher- al zone (0.04 sec-1± 0.07 and 0.58 × 10⁻³sec-1± 1.98 ×10⁻³) (p < 0.05). The area un- der the ROC curve for differentiating cancerous from non-cancerous tissue was 0.850 (95% CI, 0.778-0.876) for Kep and 0.814 (95% CI, 0.737-0.876) for Kel.
Conclusion: Kep and Kel are useful perfusion parameters for the differentiation of prostate cancerous tissue from non-cancerous tissue.
Index words :Prostate
Magnetic resonance imaging (MRI) Pharmacokinetics
Prostatic neoplasms Neoplasm staging
The incidence of prostate cancer has been increasing since the measurement of the level of prostate specific antigen was introduced for cancer screening (1). For ad- equate local staging, a biopsy plan and follow-up guid- ance following local treatment, accurate cancer detec- tion and localization are important. Although magnetic resonance (MR) imaging is widely used for the evalua- tion of prostate cancer, several studies has shown that the use of conventional spin-echo imaging, T2-weighted imaging is limited in differentiating prostate cancer from normal prostate tissue (2-9). Therefore, the addition of other MR techniques to T2-weighted imaging, such as spectroscopy, diffusion weighted imaging, and dynamic contrast-enhanced imaging have been evaluated for im- proving the diagnostic performance of MR imaging.
Over the past few years, several studies have demon- strated that analysis of contrast enhancement character- istics on the basis of a pharmacokinetic model is useful for depicting the enhancement pattern of hypervascular tumors and for investigating neoangiogenesis (10-18).
Preliminary studies have showed that prostate cancer tissue is enhanced earlier and more intensively than normal tissue on dynamic contrast-enhanced (DCE) MR imaging (19, 20).
The present study was performed to evaluate the fea- sibility of a pharmacokinetic two compartment model and to investigate which perfusion parameters are use- ful for prostate cancer detection and localization.
Materials and Methods
The institutional review board for human investiga- tion approved this study and informed consent was signed by and obtained from all patients.
Patients
This study was retrospectively designed. The inclu- sion criteria for patient enrollment in this study was as follows: 1) patients underwent dynamic contrast MR imaging in our institution; 2) patients underwent a radi- cal retropubic prostatectomy for biopsy-proven prostate cancer; 3) a pathological map of the prostate cancer was available; 4) a patient did not undergo chemotherapy or radiation prior to surgery; 5) the area of the cancer tissue and normal tissue in the central gland and peripheral zone was equal to or greater than 40 mm2, thereby pro- viding an adequate condition for drawing regions-of-in- terest (ROI). A computerized search of the medical records and review of the histological maps between
May 2005 and June 2006 generated a list of 44 patients that met the inclusion criteria. The mean patient age was 64.9 years (range, 49-75 years; SD, 5.8 years) and the mean value±SD of prostate-specific antigen was 13.7±9.6 ng/mL (range, 2.6-2.5 ng/mL). The time in- terval between the time of biopsy and MR imaging was 15-23 days. The TNM stages of the patients were T2a- T3b, No and Mo and the pathological Gleason score of the radical prostatectomy specimens was 7±2 (range, 6-10). Forty-two of the 44 patients showed multiple cancer foci and the remaining two patients had prostate cancer in the peripheral zone. In the 42 patients with multiple cancer foci, cancer tissue was noted only at the peripheral zone in eight patients, only at the central gland in seven patients, and at both the central gland and peripheral zone in 27 patients. The greatest diame- ter of cancer tissue was equal to or greater than 3 cm in 32 patients and less than 3 cm in 12 patients. The time interval between the MR examination and radical retropubic prostatectomy was 9±4 days (range, 1-16 days).
MR Imaging Technique
MR imaging was performed with a 1.5-T MR imaging unit (Gyroscan Intera; Philips Medical Systems, Best, the Netherlands) by using a commercially available sur- face coil (SENSE Flex-M; Philips Medical Systems). This system had a maximal gradient strength of 30 mT/m and a slew rate of 150 mT/m/ms.
First, transverse, coronal and sagittal T2-weighted fast spin-echo images without an endorectal coil were ac- quired from the bladder dome to the anus with the fol- lowing parameters: repetition time msec/echo time msec, 4000/90; echo-train length, 16; three signals ac- quired; flip angle, 90°; slice thickness, 4 mm; interslice gap, 0.1 mm; field of view, 150 mm; matrix size, 224 × 513; and number of sections, 20.
Thereafter, transverse dynamic contrast-enhanced im- ages were obtained by use of a three-dimensional fast- field echo sequence (repetition time msec/echo time msec, 17/2.9 ms; flip angle, 20°; slice thickness, 4 mm;
no interslice gap; field of view, 225 mm; matrix size, 256
× 192; 25 slices). The time resolution of each dynamic set was 5 seconds and 100-120 sequences were ob- tained for each patient. After an initial five image sets were obtained, a rapid bolus intravenous injection of gadopentetate dimeglumine (Magnevist; Schering, Berlin, Germany) was administered by using a MR-com- patible power injector (Spectris; Medrad, Indianola, PA
U.S.A.), which was followed by a 20 mL saline flush.
The dosage of the injected contrast material per patient was 0.1 mmole per kilogram of body weight, and the in- jection rate was 3 mL/sec.
Histological Examination
Following the radical prostatectomy, various staff pathologists in our institution who were unaware of the MR image findings obtained a histological map of the prostate cancers. Specimens were fixed in 5% buffered formalin for 24 hours before slicing; the entire prostate was then cut by hand at 4 mm intervals perpendicular to the long axis of the prostate. Each slice was halved or quartered according to its size for further processing.
Macrotome slices of 7-8 μm thickness were then ob- tained from each section and were stained with hema- toxylin-eosin. Slides of halved or quartered slices at the same level of section were collected to simulate a whole mount section slice, and then a schematic map marking both the cancer and normal tissues was generated on su- perimposed transparent films over the slices.
Postprocessing of the MR images and the measurement of perfusion parameters
According to the two compartment model proposed by Brix (21), the time of arrival, Ah, Kep (sec-1) and Kel (sec-1) can be calculated according to the following for- mula: f(t) = S0+Ah × Kep × [(exp-Kep (t - TA)- exp-Kel(t -
TA))/(Kel - Kep)], where S0 is the base line signal intensi- ty, TA is the time of arrival, Ah is the constant that cor- responds to the size of interstitial space, Kel is the elimi- nation rate constant from the plasma by renal excretion, and Kep is the elimination rate constant from the extra- cellular space back to the plasma. Each perfusion para- meter was measured by using an in-house software (4D analyzer, Seoul, South Korea).
One radiologist measured the perfusion parameters in three different ROIs, which were placed over cancer tis- sue, normal tissue in the peripheral zone and normal tis-
sue in the central gland. A round or elliptical ROI was placed over each of the three locations chosen by refer- ring to the histological maps and T2-weighted images.
When the area of the cancer tissue or normal tissue was less than 40 mm2, a measurement was not performed.
The observer attempted to cover as much cancer or nor- mal tissue as possible within the ROIs while attempting to avoid the prostate capsule, urethra and periprostatic tissue within the ROIs. The area of the four ROIs was kept constant in each patient, but varied from 40 mm2to 70 mm2for each patient.
Statistical Analysis
The repeated measures of analysis of variance with pair-wise multiple comparisons by using Tukey’s method were applied for the comparison of the perfu- sion parameters in the three ROIs.
In order to evaluate the diagnostic performance of the wash-in rate for differentiating cancer and normal tis- sue, a receiver operating characteristics (ROC) analysis was performed. From the ROC analysis, the optimal cut-off point was extracted, which showed the best sep- aration (minimal false negative and false positive results) between the prostate cancer and non-cancerous tissue.
Thereafter, the sensitivity and specificity of the perfu- sion parameters were calculated. For every statistical analysis, significance was considered to be present when the P value was less than 0.05.
Results
The perfusion parameters for prostate cancer tissue and non-cancerous tissue of the central gland and pe- ripheral zone are summarized in Table 1. In cancer tis- sue, all of the perfusion parameters were not significant- ly different, and the location; the time of arrival, Ah, Kep and Kel were 50.34 ± 20.35 sec, 2.03 ± 0.87, 0.12
± 0.10 sec-1and 1.49 ± 1.01 sec-1in the cancer tissue of the central gland, respectively, and 52.10 ± 19.56
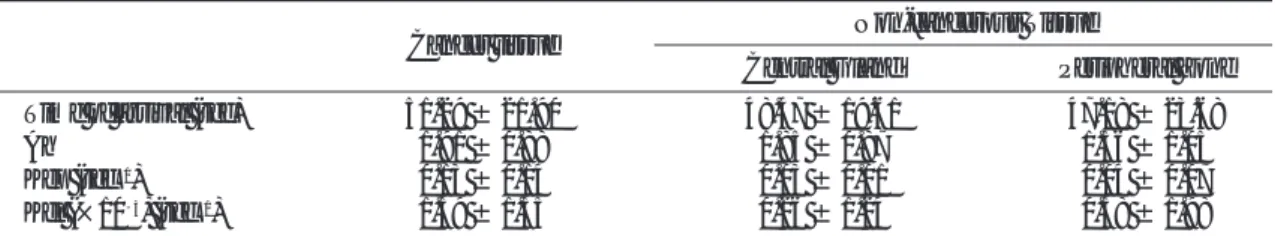
Table 1. Various Perfusion Parameters for Prostate Cancer Tissue and Non-cancerous Tissue of the Central gland and Peripheral Zone
Cancer tissue Non-cancerous Tissue
Central Gland Peripheral Zone
Time of arrival (sec) 51.29 ± 21.90 48.47 ± 19.61 47.18 ± 23.68
Ah 1.91 ± 0.88 1.85 ± 0.87 1.56 ± 1.05
Kep (sec-1) 0.13 ± 0.14 0.03 ± 0.01 0.04 ± 0.07
Kel (×10-3) (sec-1) 1.59 ± 1.35 0.26 ± 1.24 0.58 ± 1.98
Note. ─ Kep and Kel were significantly greater in cancer tissue than in non-cancerous tissue in the central gland and peripheral zone (p < 0.05).
sec, 1.88 ± 0.62, 0.14 ± 0.14 sec-1and 1.62 ± 1.40 sec-
1in the cancer tissue of the peripheral zone, respectively (p > .05). Therefore, the location of the cancer tissue was not considered in the comparison of parameters be- tween the cancer tissue and normal tissue and the mean value of all cancer tissues represented each parameter.
Kep and Kel were significantly greater in prostate can- cer tissue than in non-cancerous tissue-range, 0.02-0.50 sec-1 for Kep and -0.00196-0.00634 sec-1for Kel for;
prostate cancer tissue; range, 0.00-0.09 sec-1 for Kep and -0.00424-0.00634 sec-1 for Kel in the central gland; range, 0.00-0.50 sec-1 for Kep and -0.00203- 0.008710 sec-1for Kel in the peripheral zone (p < 0.05) (Fig. 1).
The time of arrival and Ah were similar between prostate cancer tissue and non-cancerous tissue (p >
0.05). All perfusion parameters showed no significant difference between the non-cancerous tissues of the central gland and the peripheral zone (p > 0.05).
Kep for cancerous tissue was greater than Kep of non- cancerous tissue in 37 (84%) of 44 patients and Kel for cancerous tissue was greater than Kel for non-cancerous tissue in 34 (77%) patients. In 28 (64%) patients, both Kep and Kep were greater in cancerous tissue than in non-cancerous tissue. In 43 (98%) patients, either Kep or Kel was greater in the cancerous tissue than in the non- cancerous tissue.
The ROC curves analysis to determine the diagnostic performance of Kep and Kel in differentiating prostate cancer from each of the non-cancerous tissues is demon- strated in Figure 2. The area under the ROC curve for differentiating prostate cancer from non-cancerous tis- sue was 0.850 (95% CI, 0.778-0.906) for Kep and 0.814 (95% CI, 0.737-0.876) for Kel. The area under the
A B
Fig. 1. A 63-year-old male patient with prostate cancer. Histological step sections at the level of mid-gland (A) shows prostate can- cer (dotted lines, arrows). (B) By referring to the histological map and transverse T2-weighted fast spin echo images (TR/TE, 4310 msec/90msec; echo train length, 15) at the same levels, ROIs were drawn in the prostate cancer tissue (PCa) and non-cancerous tis- sue of the peripheral zone (Pz) and central gland (Tz) using an in-house software. Kep was 0.18 sec-1in the cancer tissue, 0.06 sec-1 in the non-cancerous tissue of the central gland, and 0.03 sec-1in the non-cancerous tissue of the peripheral zone. Kel was 1.36 × 10⁻³sec-1in the cancer tissue, 0.42 × 10⁻³sec-1in the non-cancerous tissue of the central gland, and 0.19 × 10⁻³sec-1in the non- cancerous tissue of the peripheral zone.
Fig. 2. Receiver operating characteristics curve for differentiat- ing prostate cancer tissue from non-cancerous tissue. The area under the curve is 0.850 for Kep and 0.814 for Kel, respective- ly.
curve was similar between Kep and Kel (p = 0.455).
The area under the ROC curve for Kep was 0.830 (95% CI, 0.735-0.902) for differentiating prostate can- cer from non-cancerous, central gland-zone tissue and 0.870 (95% CI, 0.780-0.932) for differentiating cancer- ous from non-cancerous, peripheral-zone tissue. The area under the curve for Kel was 0.830 (95% CI, 0.733- 0.903) for differentiating prostate cancer from non-can- cerous, central gland-zone tissue and 0.768 (95% CI, 0.663-0.854) for differentiating cancerous from non- cancerous, peripheral-zone tissue.
The cut-off values from the ROC analysis, which showed the greatest positive likelihood ratio when dif- ferentiating prostate cancer from non-cancerous tissue, included 0.035 sec-1for Kep and 0.00090 sec-1for Kel.
The corresponding sensitivity and specificity were 86%
and 71% for Kep and 84% and 76% Kel, respectively.
The sensitivity and specificity were not significantly dif- ferent between Kep and Kel (p > 0.05).
With these thresholds, the sensitivity and specificity for differentiating cancerous tissue from non-cancerous, central gland tissue were 86% and 66% for Kep and 82%
and 82% for Kel, respectively. The sensitivity and speci- ficity for differentiating cancerous tissue from non-can- cerous, peripheral zone tissue were 86% and 75% for Kep and 84% and 73% for Kel, respectively.
Discussion
The two compartment model was introduced in the late 1990s and has been widely used for the evaluation of perfusion characteristics in various organs. This method is based on the concept that intravenous contrast materi- al transfers between the two compartments in the body, i.e. intravascular and extravascular/extracellular com- partments, according to the concentration gradient of the contrast material (10-13). Based on this concept, various perfusion parameters can be extracted, such as velocity of contrast transfer (Kep and Kel in this study), the area of extravascular/extracellular space, and the time of ar- rival. Therefore, this method seems to be adequate in evaluating a disease that alters tissue perfusion.
This study applied the two compartment model pro- posed by Brix. In comparison with other two compart- ment models, i.e. the Toft model and Larsson model, the Brix model does not require the acquisition of arterial in- put function, which is accompanied with a complex process and longer scan times (10-13). Furthermore, in comparison with a simple analysis of the time intensity
curve on DCE MR, the Brix model provides more de- tailed information on the transfer route of contrast mate- rial, using parameters such as Kep and Kel.
In this study, the Kep and Kel were significantly greater in prostate cancer tissue than in non-cancerous tissue, and the diagnostic performance of these two per- fusion parameters were satisfactory as the area under the ROC curve was 0.814-0.850. Therefore, our results suggest that Kep and Kel may be useful parameters for prostate cancer detection and localization.
The theoretical background of the pharmacokinetic model utilizing DCE MR imaging is based on tumor an- giogenesis. In cancer tissue, gene mutation leads to pro- duction and release of angiogenic factors, such as the vascular permeability factor or vascular endothelial growth factor. Under these circumstances, the number of vessels increases in the cancer tissue; the tumor ves- sels have greater permeability relative to normal vessels due to weak integrity of the vessel wall (22-24).
Kep is the elimination rate of contrast material from the interstitial space to the plasma, thereby representing permeability in a tissue. Therefore, our results that showed a greater value for Kep in cancerous tissue than in non-cancerous tissue correspond well to the fact that permeability is increased in the cancerous tissue (25- 27).
Kel is the elimination rate of contrast material from the plasma to renal excretion, thereby being related to the circulation rate of plasma in the tissue. Due to in- creased microvessel density, there is an increased circu- lation rate through the plasma in the cancer tissue.
Therefore, our results that showed a greater value for Kel in cancerous tissue than in non-cancerous tissue re- flects the circulation environment of the cancer tissue.
Our results correspond to those of previous experi- mental studies, in which the mean transit time, blood flow, permeability surface area and interstitial volume were significantly greater in cancer tissue than in nor- mal tissue (25-27). Engelbrecht et al. (26) showed the usefulness of relative peak enhancement and the wash- out rate for prostate cancer detection and localization.
From an ROC analysis in their study, the relative peak enhancement was the most accurate parameter for can- cer detection in the peripheral zone and central gland.
Kim et al. (27) demonstrated that parametric imaging of the wash-in rate was more accurate than T2WI alone for peripheral zone cancer detection. In their study, the sen- sitivity and specificity of peripheral zone cancer detec- tion were 96% and 97% by parametric imaging of the
wash-in rate but 75% and 53% on T2WI (P < 0.05).
According to the results of previous and current stud- ies, it is obvious that the enhancement characteristics are different between the cancerous and non-cancerous tis- sue. There are many perfusion parameters that are use- ful for differentiating prostate cancer from non-cancer- ous tissue, and furthermore, various pharmacokinetic models have been introduced. However, these various parameters and pharmacokinetic models have been sep- arately evaluated in each study. Therefore, it is necessary to perform a comprehensive evaluation of the many per- fusion parameters and to determine the advantages and disadvantages of each pharmacokinetic model.
There are several limitations in this study. First, this study measured perfusion parameters in ROIs of can- cerous and non-cancerous tissue in a retrospective fash- ion. However, an ROI study has an inherent weakness in that the value from the ROI is not representative of the entire tissue in any zone. Therefore, in order to eval- uate the actual usefulness of the perfusion parameters in prostate cancer detection and localization, a prospective systematized study with a pixel-by-pixel analysis should be conducted.
Second, there has been no agreement concerning the MR acquisition protocol and the optimal perfusion para- meters for differentiating cancer tissue from normal tis- sue. Because the value of the perfusion parameters may be influenced by various factors, such as the temporal resolution of the DCE MR imaging and the dose and in- jection rate of contrast material, it is necessary to stan- dardize the protocol for MR imaging acquisition.
Third, this study divided the prostate into only cancer- ous and non-cancerous tissue and compared the perfu- sion parameters between the types. However, there may be various non-cancerous conditions that could al- ter the perfusion environment, such as benign prostate hyperplasia, prostatitis, or atrophy. As Kep and Kel are not cancer-specific parameters and just reflect the trans- fer velocity of contrast material in a certain tissue, vari- ous conditions that can alter the perfusion environment can also change these parameters. Therefore, the diag- nostic performance based simply on the ROI measure- ment may be exaggerated, and the actual diagnostic ac- curacy may vary according to the presence or absence of benign prostatic disease.
Lastly, this study included only patients with prostate cancer tissue large enough to allow drawing of a ROI.
Therefore, our results for differentiating prostate cancer from non-cancerous tissue cannot suggest the successful
diagnostic performance in detecting small prostate can- cers.
In conclusion, determination of Kep and Kel based on DCE MR imaging may be useful parameters for prostate cancer detection and localization. Given the merits of this method, the performance of MR imaging may be improved.
Acknowledgements
This work was supported by the Korea Science and Engineering Foundation (KOSEF) with a grant funded by the Korean government (MOST) (No. R01-2006-000- 10998-0) and by a grant (2006-369) from the Asan Institute for Life Sciences, Seoul, Korea.
References
1. Parker SL, Tong T, Bolden S, Wingo PA. Cancer statistics. 1996.
CA Cancer J Clin 1996;46:5-27
2. Quint LE, Van Erp JS, Bland PH, Del Buono EA, Mandell SH, Grossman HB, et al. Prostate cancer: correlation of MR images with tissue optical density at pathologic examination. Radiology 1991;179:837-842
3. Lovett K, Rifkin MD, McCue PA, Choi H. MR imaging characteris- tics of noncancerous lesions of the prostate. J Magn Reson Imaging 1992;2:35-39
4. Tempany CM, Zhou X, Zerhouni EA, Rifkin MD, Quint LE, Piccoli CW, et al. Staging of prostate cancer: results of radiology di- agnostic oncology group project comparison of three MR imaging techniques. Radiology 1994;192:47-54
5. Langlotz C, Schnall M, Pollack H. Staging of prostatic cancer: accu- racy of MR imaging. Radiology 1995;194:645-646
6. Quinn SF, Franzini DA, Demlow TA, Rosencrantz DR, Kim J, Hanna RM, et al. MR imaging of prostate cancer with an endorec- tal surface coil technique: correlation with whole-mount speci- mens. Radiology 1994;190:323-327
7. Perrotti M, Kaufman RP Jr, Jennings TA, Thaler HT, Soloway SM, Rifkin MD, et al. Endorectal coil magnetic resonance imaging in clinically localized prostate cancer: is it accurate? J Urol 1996;156:106-109
8. Kier R, Wain S, Troiano R. Fast spin-echo MR images of the pelvis obtained with a phased-array coil: value in localizing and staging prostatic carcinoma. AJR Am J Roentgenol 1993;161:601-606 9. Jager GJ, Severens JL, Thornbury JR, de La Rosette J, Ruijs SH,
Barentsz JO. Prostate cancer staging: should MR imaging be used-- A decision analytic approach. Radiology 2000;215:445-451 10. Brix G, Lucht R, Griebel J. Tracer kinetic analysis of signal time se-
ries from dynamic contrast-enhanced MR imaging. Biomed Tech 2006;51:325-330
11. Hoffmann U, Brix G, Knopp MV, Hess T, Lorenz WJ.
Pharmacokinetic mapping of the breast: a new method for dynam- ic MR-mammography. Magn Reson Med 1995;33:506-514 12. Hawighorst H, Knopp MV, Debus J, Hoffmann U, Grandy M,
Griebel J, et al. Pharmacokinetic MRI for assessment of malignant glioma response to stereotactic radiotherapy: initial results. J Magn Reson Imaging 1998;8:783-788
13. Port RE, Knopp MV, Hoffmann U, Milker-Zabel S, Brix G.
Multicompartment analysis of gadolinium chelate kinetics: blood-
tissue exchange in mammary tumors as monitored by dynamic MR imaging. J Magn Reson Imaging 1999;10:233-241
14. Boetes C, Barentsz JO, Mus RD, van der Sluis RF, van Erning LJ, Hendriks JH, et al. MR characterization of suspicious breast le- sions with a gadolinium-enhanced TurboFLASH subtraction tech- nique. Radiology 1994;193:777-781
15. Kuhl CK, Mielcareck P, Klaschik S, Leutner C, Wardelmann E, Gieseke J, et al. Dynamic breast MR imaging: are signal intensity time course data useful for differential diagnosis of enhancing le- sions? Radiology 1999;211:101-110
16. Egmont-Petersen M, Hogendoorn PC, van der Geest RJ, Vrooman HA, van der Woude H, Janssen JP, et al. Detection of areas with viable remnant tumor in postchemotherapy patients with Ewing’s sarcoma by dynamic contrast-enhanced MRI using pharmacoki- netic modeling. Magn Reson Imaging 2000;18:525-535
17. Belli P, Costantini M, Romani M, Marano P, Pastore G. Magnetic resonance imaging in breast cancer recurrence. Breast Caner Res Treat 2002;73:223-235
18. Toyoda H, Nishizawa S, Shiozaki T, Ueno M, Konishi J. A simpli- fied double-injection method to quantify cerebral blood flow and vascular reserve using iodine-123 IMP-SPECT. Ann Nucl Med 2002;16:127-135
19. Preziosi P, di Giambattista G, di Renzi P. Endorectal-coil magnetic resonance imaging with dynamic subtraction technique in prostate cancer: evaluation of tumoral tissue behavior with the time/signal intensity curve analysis (abstr). Radiology 1998;209(P):259 20. Liney GP, Turnbull LW, Knowles AJ. In vivo magnetic resonance
spectroscopy and dynamic contrast enhanced imaging of the prostate gland. NMR Biomed 1999;12:39-44
21. Brix G, Semmler W, Port R, Schad LR, Layer G, Lorenz WJ, et al.
Pharmacokinetic parameters in CNS Gd-DTPA enhanced MR imaging. J Comput Assist Tomogr 1991; 15:621-628
22. Weidner N, Carroll PR, Flax J, Blumenfeld W, Folkman J. Tumor angiogenesis correlates with metastasis in invasive prostate carci- noma. Am J Pathol 1993;143:401-409
23. Brawer MK, Deering RE, Brown M, Prestone SD, Bigler SA.
Predictors of pathologic stage in prostatic carcinoma. The role of neovascularity. Cancer 1994;73:678-687
24. Siegal JA, Yu E, Brawer MK. Topography of neovascularity in hu- man prostate carcinoma. Cancer 1995;75:2545-2551
25. Buckley DL, Roberts C, Parker GJ, Logue JP, Hutchinson CE.
Prostate cancer: evaluation of vascular characteristics with dynam- ic contrast-enhanced T1-weighted MR imaging—initial experience.
Radiology 2004;233:709-715
26. Engelbrecht MR, Huisman HJ, Laheij RJ, Jager GJ, van Leenders GJ, Hulsbergen-Van De Kaa CA. Discrimination of prostate cancer from normal peripheral zone and central gland tissue by using dy- namic contrast-enhanced MR imaging. Radiology 2003;229:248- 254
27. Kim JK, Hong SS, Choi YJ, Park SH, Ahn H, Kim CS, et al. Wash- in rate on the basis of dynamic constrast-enhanced MRI: useful- ness for prostate cancer detection and localization. J Magn Reson Imaging 2005;22:639-646
대한영상의학회지 2007;57:159-165
역동적 조영증강 자기공명영상에 기반한 약동학적 모델의 전립선암의 발견과 위치화에 대한 유용성
11울산대학병원 영상의학과
2울산의대 서울아산병원 영상의학과
정애경・김정곤2・조경식2
목적: 전립선암의 발견과 위치화에 있어 역동적 조영증강 자기공명영상에 기반한 약동학적 모델의 유용성을 분석하 고자 하였다.
대상과 방법: 전립선암에 대해 전치적 절제술과 역동적 조영증강 자기공명영상을(절편두께, 4 mm; 각 영상세트의 획득 시간, 5초) 시행한 44명의 환자가 연구에 포함되었다. 약동학적 모델로부터, time of arrival, Ah, Kep 그리고 Kel을 추출한 후 이들을 종양조직과, 이행대 및 변연대의 비종양 조직간에 비교하였다. 각 파라미터의 전립선암과 비종양조직간의 감별에 대한 진단능을 수신기작동특성곡선(receiver-operating-characteristics) 기법을 통해 분석 하였다.
결과: Kep와 Kel이 암조직에서(0.13 sec-1± 0.14 and 1.59 × 10⁻³sec-1± 1.35 × 10⁻³), 중심선(0.03 sec-1 ± 0.02 and 0.26 × 10⁻³ sec-1± 1.24 × 10⁻³)과 변연대의(0.04 sec-1± 0.07 and 0.58 × 10⁻³sec-1 ± 1.98 × 10⁻³) (p < 0.05) 비종양조직보다 의미 있게 컸다 (p < 0.05). 전립선암 조직과 비종양 조직간의 감별에 대한 ROC 곡선의 면적은 Kep에서 0.850(95% CI, 0.778-0.876)이었고 Kel에서 0.814(95% CI, 0.737-0.876) 이었다.
결론: Kep와 Kel은 전립선암과 비종양조직의 감별에 있어 유용한 관류 파라미터이다.