Characterization of Fe-ACF/TiO 2 composite Photocatalysts Effect Via Degradation of MB Solution
Kan Zhang, Ze-Da Meng, Weon-Bae Ko*, and Won-Chun Oh †
Department of Advanced Materials & Science Engineering, Hanseo University, Chungnam 356-706, Korea
*Department of Chemistry, Sahmyook University, Seoul 139-742, Korea (Received July 14, 2009, Revised & Accepted August 17, 2009)
Fe-ACF/TiO 2 복합체의 특성과 MB용액의 분해에서 포토-펜톤 효과
장 간 ․ 맹 칙 달 ․ 고 원 배
* ․ 오 원 춘 † 한서대학교 신소재공학과, * 삼육대학교 화학과 (2009년 7월 14일 접수, 2009년 8월 17일 수정 및 채택)
ABSTRACT:In this paper, the Fe-activated carbon fiber (ACF)/TiO 2 composite catalysts were prepared by a sol-gel method.
The synthesized photocatalysts were used for the photo degradation of Methylene blue solution under UV light. From Brunauer-Emmett-Teller measurements (BET) data, it was shown the blocking of the micropores on the surface of ACF by treatment of Fe and Ti compound. As shown in SEM images, the ferric compounds and titanium dioxides were fixed onto the ACF surfaces. The result of X-ray powder diffraction showed that the crystal phase contained a mixing anatase and rutile structure and the 'FeO+TiO 2 ' from the composites. The EDX spectra for the elemental analysis showed the presence of C, O, and Ti with Fe peaks. Degradation activity of MB could be attributed to ‧OH radicals derived from electron/hole pair's reactions due to photolysis of TiO 2 and photo-Fenton effect of Fe.
요 약:본 논문에서 Fe-활성탄소 섬유(ACF)/TiO 2 복합체 광촉매를 졸-겔 방법에 의하여 제조하였다. 합성된 광촉 매는 UV조사하에서 MB용액의 광분해에 사용되었다. BET 데이터는 Fe와 Ti의 여러 가지 농도를 가지고 처리된 ACF의 표면에서 흡착 특성을 보여준다. SEM 사진에서 보여지는 것처럼, 철 혼합물과 TiO 2 는 ACF 표면에 활착되어 있음을 나타내었다. X선 분말 회절법으로부터 얻어진 결과는 복합체로부터 FeO+TiO 2 , Anatase 및 Rutile 구조의 결정상을 나타내었다. 원소분석을 위한 EDX spectra는 Fe와 함께 C, O, Ti의 peak들이 존재함을 나타내었다. MB 분해에 대한 활성은 TiO 2 의 광분해와 Fe의 photo-Fenton 효과로 인해 전자/hole쌍 반응으로부터 파생된 ‧OH 라디 칼들에 의한 것으로 여겨진다.
Keywords:Activated carbon fiber; Fe; Methylene blue; photo-Fenton; SEM.
† Corresponding Author. E-mail: [email protected]
Ⅰ. Introduction
In the past decades, the photocatalytic oxidation of organic dyes and pollutants in the waste water by semiconductor pho- tocatalyst TiO 2 has been extensively studied. 1-5 It has been con- sidered a promising material for environmental treatment, be- cause it is stable, non-toxic, antioptical corrosion, complete mineralization, and no secondary pollution. 6-8 But the photo- catalytic activity of TiO 2 has high electron/hole pairs recombi- nation rate and low interface area. Rapid recombination of electron/hole pairs can be reduced to hv reaction, and product of electron/hole pairs were decreased by low interface area.
TiO 2 + hv → h vb + + e -
h vb + + H 2 O → ‧OH + H +
So many reports have focused on adding some transition metal elements in TiO 2 in order to amend above defects. In recent years, metallic components such as Ni, 9-13 Zn, 14-15 Zr 16-17 and Fe 18 have been successfully treated with TiO 2 for obtaining good photocatalytic effect. Among these researches, enhance- ment of photocatalytic efficiency of Fe doped TiO 2 has been proved, because it can reduce recombination rate of elec- tron/hole pair and produce photo-Fenton reaction. by pho- to-Fenton process producing ‧OH radicals.
Fe 3+ + OH - + hv → Fe 2+ + ‧OH
Thus, iron widely has been applied in photo catalytic reac-
tion. But it was reported that the larger amounts of containing
Fe 3+ can inhibit the photocatalytic activity, 19-20 which was con-
sidered that electron/hole pairs were digested by different spe-
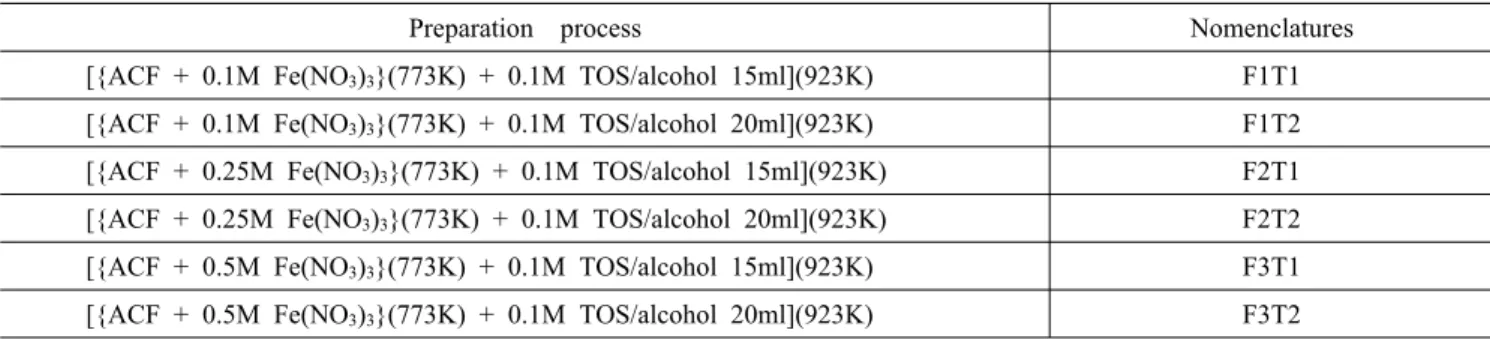
Table 2. Nomenclatures of Fe-ACF/TiO 2 composites prepared with different concentrations of Fe (NO 3 ) 3 and different volume TOS.
Preparation process Nomenclatures
[{ACF + 0.1M Fe(NO 3 ) 3 }(773K) + 0.1M TOS/alcohol 15ml](923K) F1T1 [{ACF + 0.1M Fe(NO 3 ) 3 }(773K) + 0.1M TOS/alcohol 20ml](923K) F1T2 [{ACF + 0.25M Fe(NO 3 ) 3 }(773K) + 0.1M TOS/alcohol 15ml](923K) F2T1 [{ACF + 0.25M Fe(NO 3 ) 3 }(773K) + 0.1M TOS/alcohol 20ml](923K) F2T2 [{ACF + 0.5M Fe(NO 3 ) 3 }(773K) + 0.1M TOS/alcohol 15ml](923K) F3T1 [{ACF + 0.5M Fe(NO 3 ) 3 }(773K) + 0.1M TOS/alcohol 20ml](923K) F3T2 cies of iron ion Therefore, appropriate amount of Fe added
into composite catalysts can enhance the photocatalytic activity.
Moreover, activated carbon fiber (ACF) is highly microporous, having a high surface area, a larger pore volume and a uniform microspore size distribution. TiO 2 particle could be easily fixed on ACF surface and thus have improved defects at low inter- face area. Thus, ACF/TiO 2 composites are typically used to obtain the combined effects of the photo activity. Therefore, combination of ACF and TiO 2 with Fe could remarkably in- crease the photocatalytic activity.
In this study, Fe-ACF/TiO 2 composite was obtained by po- rous ACF, the TiO 2 was derived from titanium (IV) oxysulfate hydrate (TiOSO 4 . xH 2 O (TOS), Sigma-Aldrich, Germany), and Fe (NO 3 ) 3 solution employed a sol-gel method. The prepared composites were characterized by BET, X-ray diffraction (XRD), scanning electron microscope (SEM), energy dispersive X-ray (EDX). Then, it was suggested that the experimental preparations of Fe-ACF/TiO 2 composites were based on the control of amounts of Fe and Ti. The degradation effects of MB dye under UV light were investigated using the prepared Fe-ACF/TiO 2 composites.
Ⅱ . Experimental
1. Materials
ACFs were obtained from EAST ASIS Carbon Fibers Co., (Ltd, AnShan, China) and their properties are shown in Table 1. Ten grams of ACFs were added into 50 ml of 0.1, 0.25 and 0.5 M Fe (NO 3 ) 3 solutions, respectively, and stirred for 24 h at room temperature. The Fe (NO 3 ) 3 . 9H 2 O was purchased from Duksan Pure Chemical Co. (99+%, ACS reagent, Korea).
Five grams of Fe-ACF composites heated at 773K for 1 h were added into different volume (15 ml, 20 ml) of 0.1 M TOS solutions and stirred for 5 h in air atmosphere. The mix- tures were vaporized at 373 K, and then heated at 923 K for 1h. After cooling, the Fe-ACF/TiO 2 composites were obtained.
The nomenclatures and preparation procedures of the samples
Table 1. The properties of ACFs.
Physical properties Units
Density 1.23~1.91 g/mL
Electrical Resistivity 5.2×10 -3 ~6.8×10 -3 Ω·cm
Diameter 12~15 µ
Tensile Strength 4~6×10 8 Pa Tensile Modulus 3×10 10 ~4×10 10 Pa Elemental carbon ≥ 95 wt%
are listed in Table 2.
2. Characterization and investigation for the samples
To characterize the Fe-ACF/TiO 2 prepared, the BET surface area by N 2 adsorption method was measured at 77 K using a BET analyzer (MONOSORB, USA). The surface and struc- ture of the Fe-ACF/TiO 2 composites were observed using a SEM (JSM-5200, Japan). The crystalline phases were analyzed using XRD (Shimadz XD-D1, Japan) with Cu Kα radiation.
For the elemental analysis of the Fe-ACF/TiO 2 composites, EDX spectra were also obtained. For the measurement of pho- to-degradation effects, MB was degraded via the following procedure. A Fe-ACF/TiO 2 powdered sample of 0.03 g was added into a concentration of 1.0 × 10 -5 mol/L in a dark atmos- phere at room temperature. Each concentration was measured as a function of UV irradiation time. Results were recorded using a Genspec III (Hitachi, Japan) spectrometer.
3. Photocatalytic activity
Fe-ACF/TiO 2 photocatalysts was used to degrade MB in
aqueous media under ultraviolet light irradiation. For UV irra-
diation, the reaction tube was placed in the darkness box. The
UV lamp was located at the distance of 100 mm from the
solution in darkness box. After irradiation at 10 min, 30 min,
60 min, 90 min, and 120 min, the samples were extracted
from the reactor and removal of dispersed powders through centrifuge. The concentration of MB in the solution was de- termined as a function of irradiation time from the absorbance change at a UV wavelength line of 220 and 800 nm.
Ⅲ . Results and discussion
1. The surface characteristics
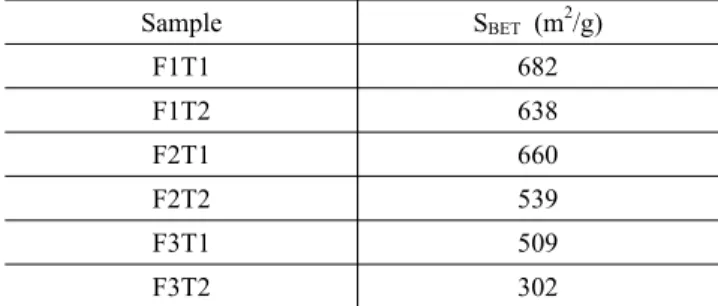
The Fe-ACF/TiO 2 catalysts prepared with different concen- trations of Fe and different volumes of TOS solution were named as F1T1, F1T2; F2T1, F2T2 and F3T1, F3T2. These BET surface areas are summarized in Table 3. From the results shown, it can be clearly seen that the specific surface area was gradually decreased by increasing the Fe and Ti contents into Fe-ACF/TiO 2 composites. Generally, the BET surface area is considered to be decreased due to the blocking of the micro- spores by surface complexes introduced through the formation of the Fe-ACF/TiO 2 composites. 18 The variation of surface pa- rameters is attributed to the increase of the amount of TiO 2
and Fe components. The similar phenomena has also been ob- served in the references. 21-22
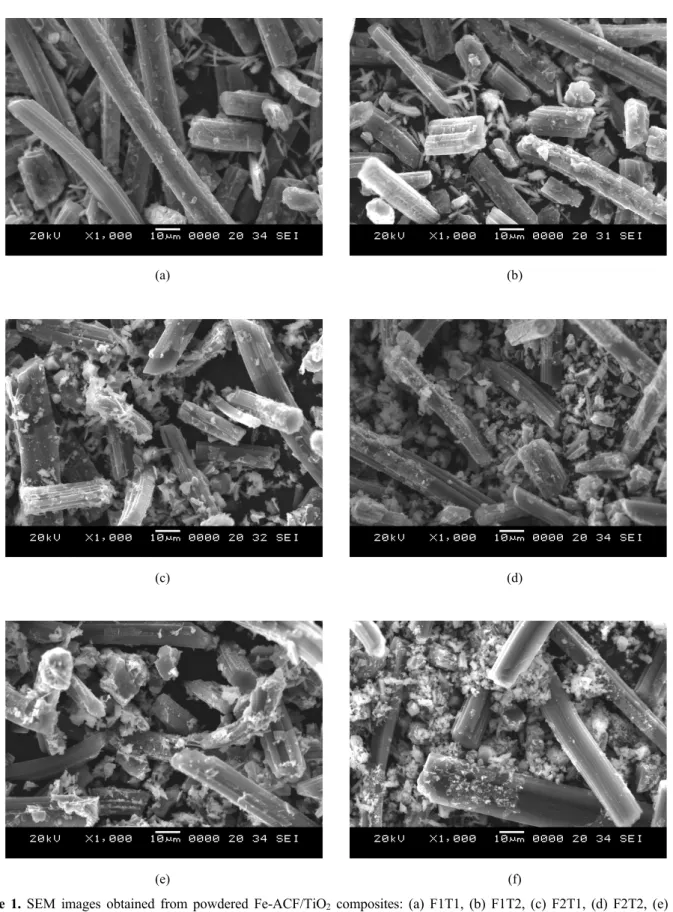
The SEM images of Fe-ACF/TiO 2 composites are shown in Figure 1. The TiO 2 particles are fixed on the surface of ACF from Figure 1 observations, although the particles were partially agglomerated. In comparison of the amounts of Fe and Ti in all samples, we can find same results. Generally, it is considered that good dispersion of particles can produce high photocatalytic activity. In previous studies, 23-24 ACF/TiO 2
composites were prepared with nitric acid in order to enhance the homogenous and uniform distribution of TiO 2 particles.
The SEM images showed that the TiO 2 particles on the Fe-ACF surfaces are not evenly distributed in all types of the Fe- ACF/TiO 2 composites. Although we could not clearly find out Fe particles in SEM images of Fe-ACF/TiO 2 composites, maybe the size of the Fe particle was estimated very small, but it was confirmed in XRD and EDX results.
2. Crystal structure and elemental analysis
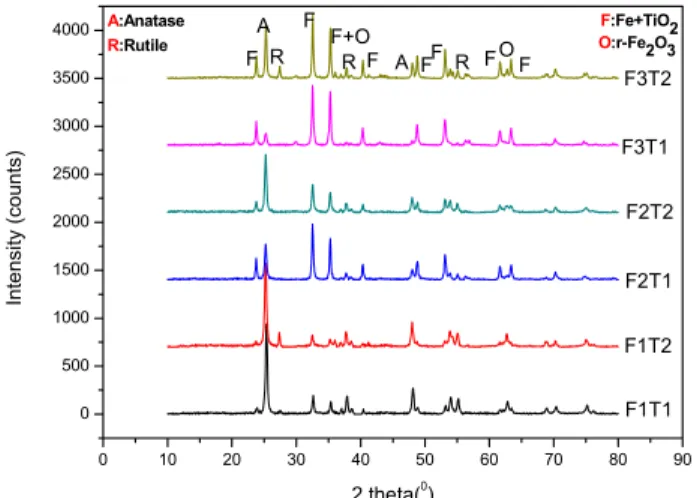
Figure 2 shows the XRD results of Fe-ACF/TiO 2 . Diffrac- tion peaks corresponding to anatase and rutile phase are marked with 'A' and 'R'. And, the diffraction peaks correspond- ing to 'FeO+TiO 2 ' and 'γ-Fe 2 O 3 ' phase are marked with 'F' and 'O', respectively. XRD patterns of the composites pre- sented that the Fe-ACF/TiO 2 composites consisted of a mixed phases as anatase and rutile phase. The anatase phase was ob- tained after heat treatment at 773k. The main diffraction peaks at 25.3, 37.8, 48.0, 53.8 and 62.5 are diffractions of (101), (004), (200), (105) and (204) planes of anatase. However, the diffraction peaks of rutile phase were minorly appeared in this
figs, the phase transition can be attributed to formation of pure oxides due to high temperature at 973 ~1173 K. 25 But phase transition temperature has been shown to depend on impurity contents, particle size and surface area. 26-28 The similar phe- nomena has also been observed in the references. 29-30 Moreover, we can clearly find the peaks of 'FeO+TiO 2 ' for all of these samples in the XRD patterns. It is noteworthy that the 'FeO+TiO 2 ' peaks in F3T1 and F3T2 show very higher than that of other samples. As expected, the intensity of 'FeO+TiO 2 ''peaks increased with an increase of concentration of Fe source in the solution. diffraction peaks of 'γ-Fe 2 O 3 ' are only found in F3T1 and F3T2, the main diffraction peaks have characteristic reflections of (110), (210), and (211). 31 These nanocrystallites were produced by solvothermal reaction and heat treatment at 773-1173 K. 32
Figure 3 shows the element analysis of Fe-ACF/TiO 2 . From the spectra, all of the Fe-ACF/TiO 2 composites show the main peaks of O, Ti and Fe, The numerical results are listed in the Table 4. The amounts of Fe and Ti element were clearly affected on the different samples. As expected, the contents of Fe element in the composites increased with the increase of Fe (NO 3 ) 3 concentrations. Similarly, the contents of Ti ele- ment in the composites increased with the volume of TOS solution increased. However, the amount of Ti element is greatly different values among F1T2, F2T2 and F3T2. It can be explained that the Fe and TiO 2 particles on the complexes were partially agglomerated on ACF surface from their SEM images.
Table 3. Specific BET surface areas of Fe-ACF/TiO 2 compo- site samples.
Sample S BET (m 2 /g)
F1T1 682
F1T2 638
F2T1 660
F2T2 539
F3T1 509
F3T2 302
Table 4. EDX elemental microanalysis of Fe-ACF/TiO 2 com- posites.
Sample (wt. %) C O Ti Fe
F1T1 67.45 19.08 9.16 2.04
F1T2 66.53 19.09 9.69 2.58
F2T1 63.16 22.23 7.59 4.72
F2T2 59.45 19.03 11.63 6.33
F3T1 59.78 19.37 8.16 9.57
F3T2 46.98 26.23 15.29 8.71
(a) (b)
(c) (d)
(e) (f)
Figure 1. SEM images obtained from powdered Fe-ACF/TiO 2 composites: (a) F1T1, (b) F1T2, (c) F2T1, (d) F2T2, (e) F3T1
and (f) F3T2
(a) (b)
(c) (d)
(e) (f)
Figure 3. Typical EDX microanalyses for the Fe-ACF/TiO 2 composites: (a) F1T1, (b) F1T2, (c) F2T1, (d) F2T2, (e) F3T1 and (f) F3T2
0 10 20 30 40 50 60 70 80 90
0 500 1000 1500 2000 2500 3000 3500 4000
Inte nsi ty (c oun ts)
2 theta(
0)
F1T1 F1T2 F2T1 F2T2 F3T1 F F3T2
A R
F F+O
R F A F F R FO F
A:AnataseR:Rutile
F:Fe+TiO2 O:r-Fe2O3
Figure 2. XRD patterns of powdered Fe-ACF/TiO 2 composites.
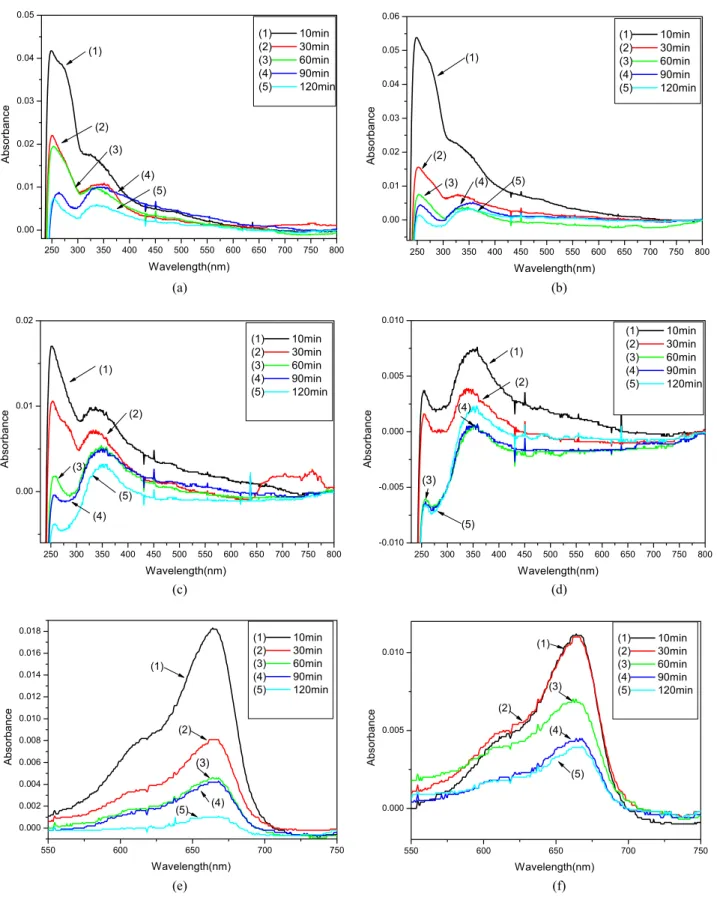
3. The photocatalytic activity of Fe-ACF/TiO