Optimal Range of Triglyceride Values to Estimate Serum Low Density Lipoprotein Cholesterol Concentration in Korean Adults:
the Korea National Health and Nutrition Examination Survey, 2009
The aims of this study were to investigate the validity of Friedewald’s formula and to propose a range of triglyceride values over which the formula can be used without significant error. This was a cross-sectional analysis of 1,929 subjects (946 males and 983 females) aged 20 yr and older using data of the Korea National Health and Nutrition Examination Survey in 2009. Estimated total number was considered to be 10,633,655 (5,846,384 males and 4,787,271 females). Calculated and directly-measured low density lipoprotein cholesterol (LDL-C) values were highly correlated (r = 0.96); however,
significant differences were observed between the directly-measured and calculated LDL-C concentrations. Subjects in the underestimated group (10.5%) had higher dysmetabolic profiles than those in the overestimated group (11.4%). Although serum triglyceride level showed the greatest independent association with differences between the calculated and directly-measured LDL-C concentrations, no statistically significant differences were noted when triglyceride concentration was between 36 and 298 mg/dL (93.2%). In conclusion, Friedewald’s formula accurately estimates directly-measured serum LDL-C concentration in Korean adults. However, the formula can be applied to subjects with serum triglyceride concentrations from 36 to 298 mg/dL without significant error.
Key Words: Friedewald’s Formula; Cholesterol, LDL; Validation; Triglycerides; Korean You-Cheol Hwang1, Hong-Yup Ahn2,
In-Kyung Jeong1, Kyu Jeung Ahn1, and Ho Yeon Chung1
1Division of Endocrinology and Metabolism, Department of Medicine, Kyung Hee Hospital at Gangdong, Kyung Hee University School of Medicine, Seoul; 2Department of Statistics, Dongguk University-Seoul, Seoul, Korea
Received: 20 June 2012 Accepted: 3 October 2012 Address for Correspondence:
You-Cheol Hwang, MD
Division of Endocrinology and Metabolism, Department of Medicine, Kyung Hee University Hospital at Gangdong, Kyung Hee University School of Medicine, 892 Dongnam-ro, Gangdong-gu, Seoul 134-727, Korea
Tel: +82.2-440-6283, Fax: +82.2-440-6296 E-mail: [email protected]
This research was supported by a grant from the Kyung Hee University in 2011 (KHU-20111760).
http://dx.doi.org/10.3346/jkms.2012.27.12.1530 • J Korean Med Sci 2012; 27: 1530-1535 Endocrinology, Nutrition & Metabolism
INTRODUCTION
Elevated serum low density lipoprotein cholesterol (LDL-C) con- centration is known to be associated with the development of cardiovascular disease (CVD) in observational epidemiologic studies and interventional clinical trials (1-3). Based on this es- tablished relationship, the US National Cholesterol Education Program Adult Treatment Panel III (NCEP ATP-III) has recom- mended the reduction of LDL-C level as the primary target of lipid-lowering therapy (4).
Although the β-quantification is a reference method to mea- sure serum LDL-C concentration, the method has been seldom used because ultracentrifugation is not available in most clini- cal laboratories (5). Recently, a new generation of homogeneous assay has been introduced as an alternative to the β-quantifi- cation method to measure serum LDL-C concentration, and these techniques have been certified by the Cholesterol Refer- ence Methods Laboratory Network (CRMLN) (6, 7). In actual clinical practice, instead of measuring LDL-C level directly, se- rum LDL-C concentration has been frequently estimated with Friedewald’s formula using total cholesterol, high density lipo-
protein cholesterol (HDL-C) and triglyceride concentrations (8).
However, Friedewald’s formula cannot be used when triglycer- ide concentration is ≥ 400 mg/dL (8), and if there is some dis- agreement between calculated and measured LDL-C concen- trations (9-13). For example, it has been reported that the agree- ment between calculated and measured LDL-C levels decreases as serum triglyceride concentration increases, even when plas- ma triglyceride concentration is < 400 mg/dL. In the Framing- ham offspring study, the proportion of estimated LDL-C levels within 10% of the LDL-C value determined by β-quantification decreased to 59% when triglyceride concentration was between 301-400 mg/dL (14).
To date, the validity of Friedewald’s formula to estimate serum LDL-C concentration has not been determined in a general Ko- rean population. Therefore, the aims of this study were to inves- tigate the validity of Friedewald’s formula in estimating serum LDL-C concentration and to propose a triglyceride range with- in which Friedewald’s formula can be used to estimate directly- measured serum LDL-C concentration without significant er- ror, according to nationally-representative population data from the Korea National Health and Nutrition Examination Survey
(KNHANES)-IV conducted in 2009.
MATERIALS AND METHODS KNHANES IV
The KNHANES is a nationwide, population-based, cross-sec- tional health survey that was first performed in 1998. KNHANES IV was conducted from July 2007 to December 2009. The sub- ject population included all households recorded by the 2005 Population and Housing Census in Korea. The entire nation was divided into 29 ranks based upon administrative district and housing type. Relevant households from 200 districts were ran- domly selected through stratified and multistage probability sampling. As rolling survey methods were used for sampling, the sample for each year was a probability sample representing all parts of the country, and each rolling sample had homoge- nous and independent characteristics.
The KNHANES IV questionnaire was composed of a health interview, health examination, and nutrition survey. Of a total of 31,705 KNHANES IV subjects selected to participate in the health interview and health examination survey, and 23,632 (74.5%) subjects completed the surveys. Of a total of 27,050 sub- jects selected to participate in the nutrition survey, 22,137 (81.8%) completed the survey. All included participants provided writ- ten informed consent (15).
Study subjects
This study utilized data from KNHANES IV-3, which was con- ducted in 2009. Of the 12,722 individuals that were sampled, 10,533 participated in the nutrition survey. Among those who participated in the survey, 1,992 subjects aged 20 yr and older who had measured total cholesterol, HDL-C, triglyceride, and directly-measured LDL-C values were enrolled. Additionally, 63 subjects with a triglyceride concentration greater than 400 mg/dL were excluded from the analysis. Finally, 1,929 subjects (946 males and 983 females) were enrolled in the current study.
Study methods
Body mass index (BMI) was calculated as weight in kilograms divided by the square of height in meters. Blood samples were collected from all subjects after at least 8 hr of fasting. Specimens were immediately centrifuged, aliquoted, frozen at -70°C, and sent to a central laboratory (NeoDIN Medical Institute, Seoul, Korea) where they were analyzed within 24 hr. Fasting plasma glucose concentration was measured using an automated ana- lyzer (Hitachi Automatic Analyzer 7600, Hitachi, Tokyo, Japan) with an enzymatic assay. Serum insulin concentration was mea- sured using a gamma counter with an immunoradiometric as- say (Biosource, Nivelles, Belgium). To estimate insulin sensitiv- ity, the updated computer model HOMA2-IR was used, which is based on fasting glucose and insulin concentrations (16). Se-
rum lipid concentrations, including total cholesterol (Pureauto S CHO-N; Daiichi, Tokyo, Japan), HDL-C (Cholestest N HDL;
Daiichi), and triglycerides (Pureauto S TG-N; Daiichi), were measured by enzymatic method using an automated analyzer (Hitachi Automatic Analyzer 7600, Hitachi), and estimated LDL- C concentration was calculated using Friedewald’s formula. Se- rum LDL-C concentration was directly measured by an enzy- matic homogenous assay with Cholestest-LDL (Sekisui Medi- cal, Tokyo, Japan). Since, in the case of HDL-C, the domestic laboratory involved in measurement changed during the sec- ond year of the survey periods, and the two institutes used dif- ferent analyzing methods and devices, some differences existed with respect to the HDL-C measurement results. Commutable frozen serum samples were prepared and sent to the Lipid Ref- erence Laboratory, Centers for Disease Control in the USA. These data were compared with those from both domestic laboratory institutes, and a conversion equation to adjust for the differenc- es was formulated to obtain the true HDL-C value. The total co- efficient of variation (CVs) for total cholesterol was 1.0%-2.8%
at level 1 (mean 104 mg/dL) and 1.0%-2.8% at level 2 (mean 269 mg/dL). Total CV for HDL-C was 0.9%-2.0% at level 1 (mean 35 mg/dL) and 1.6%-3.2% at level 2 (mean 74 mg/dL). Total CV for triglycerides was 0.9%-3.1% at level 1 (mean 79 mg/dL) and 0.9%- 2.6% at level 2 (mean 204 mg/dL). In the case of directly-mea- sured LDL-C, the total CV was 1.1%-5.8% at level 1 (mean 56 mg/dL) and 1.5%-6.3% at level 2 (mean 132 mg/dL).
The presence of CVD (stroke or coronary heart disease) was assessed according to the answers each subject provided dur- ing the health interview. Hyperlipidemia was defined by the presence of one of the followings: 1) total cholesterol ≥ 240 mg/
dL or triglyceride level ≥ 200 mg/dL (1); 2) currently taking lip- id-lowering agents; or 3) a self-reported history of hyperlipid- emia. Similarly, hypertension was defined by the presence of one of the followings: 1) systolic or diastolic blood pressure ≥ 140/
90 mmHg; 2) currently taking anti-hypertensive medications;
or 3) a self-reported history of hypertension. Diabetes mellitus was defined by the presence of one of the followings: 1) fasting glucose concentration ≥ 126 mg/dL (≥ 7.0 mM/L); 2) currently taking glucose lowering agents; 3) a self-reported history of dia- betes; or 4) HbA1c level ≥ 6.5% (measured using high perfor- mance liquid chromatography from BIO-RAD VARIANTM II, BIO-RAD, Hercules, CA, USA) (17). Current treatment for hy- perlipidemia or hypertension was defined as medication inges- tion more than 20 days per month. In terms of treatment for di- abetes, both insulin and oral agents were included.
Statistical analysis
All data are presented as mean ± SD or proportion. To compare the differences between two groups, Student’s t-test and the chi- squared test were used. Multiple linear regression analysis was used to determine the independent associations between dis-
crepancies in LDL-C concentrations and clinical or laboratory measurements, where the discrepancies were termed “delta%”
and were determined using the equation delta%. In this study, we defined a significant difference in LDL-C concentration as a delta% value greater than 10%. To determine the serum triglyc- eride cutoffs above/below which the difference between the estimated LDL-C and directly-measured LDL-C concentrations begin to differ statistically, polynomial regression models were used. KNHANES IV-3 used a complex sampling design and con- structed sample weights to adjust for non-response according to demographic factors after the surveys were completed. Anal- yses for complex survey data were performed using STATA (ver- sion 10.1; StataCorp, College Station, TX, USA), and figures were prepared with R (version 2.14.0; http://www.r-project-org). P values < 0.05 were considered significant.
Ethics statement
This study was approved by the institutional review board of the Kyung Hee University Hospital at Gangdong (KHNMC IRB 2012- 067). After approval of study proposal, KNHANES dataset was available on the request of investigator. Because the dataset did not include any personal information and participant’s consent was already taken in the process of KNHANES, informed con-
sent was exempted by the board.
RESULTS
Table 1 shows the clinical characteristics of the study popula- tion. The mean age was 42.0 yr and 45.0% of the subjects were female. Of the total 10,633,655 study subjects, 2,433,916 (22.8%) were diagnosed with hyperlipidemia and 288,227 subjects (2.7%) were taking lipid-lowering medications.
Pearson’s correlation analysis showed good correlation be- tween estimated LDL-C and directly-measured LDL-C values (r = 0.96); however, there was a statistically significant difference between directly-measured LDL-C concentration and estimat- ed LDL-C concentration (111.5 ± 31.3 mg/dL in direct LDL-C vs 111.7 ± 31.9 mg/dL in estimated LDL-C, 95% CI; 0.990-0.998, P < 0.001) in linear regression analysis (data not shown). We compared the clinical characteristics of the subjects between the underestimated group (n = 1,118,661, 10.5%) and overesti- mated group (n = 1,209,047, 11.4%). Compared to the subjects in the overestimated group, those in the underestimated group were more obese, insulin resistant, more likely to smoke, and
Table 1. Characteristics of the study population
Variables Study population (n = 10,633,655)
Age (yr) 42.0 ± 14.7
Female (%) 4,787,271 (45.0)
BMI (kg/m2) 23.6 ± 3.3
Waist circumference (cm) 80.5 ± 9.8
Fasting plasma glucose (mg/dL) 95.3 ± 18.7 Fasting serum insulin (µIU/mL) 9.8 ± 5.8
HOMA2-IR 1.28 ± 0.76
Systolic blood pressure (mmHg) 115.0 ± 16.1 Diastolic blood pressure (mmHg) 75.4 ± 10.5
Total cholesterol (mg/dL) 184.8 ± 35.7
Triglyceride (mg/dL) 123.6 ± 74.4
HDL cholesterol (mg/dL) 48.4 ± 10.7
Direct LDL cholesterol (mg/dL) 111.5 ± 31.3 Estimated LDL cholesterol (mg/dL) 111.7 ± 31.9
Non-HDL cholesterol (mg/dL) 136.4 ± 36.0
Diabetes (%) 742,985 (7.0)
Hypertension (%) 2,175,579 (20.4)
Hyperlipidemia (%) 2,433,916 (22.8)
Cardiovascular disease (%) 190,016 (1.8)
Current smoking (%) 3,059,904 (28.8)
Drug treatment Diabetes (%) Hypertension (%) Hyperlipidemia (%)
444,083 (4.2) 1,136,192 (10.7)
288,227 (2.7)
Data are expressed as mean ± SD or frequency (%). To convert glucose level to mil- limoles per liter, multiply by 0.0555. To convert insulin level to picomoles per liter, multiply by 6.945. To convert total, LDL, HDL, and non-HDL cholesterol levels to milli- moles per liter, multiply by 0.0259. To convert triglyceride level to millimoles per liter, multiply by 0.0113. BMI, body mass index; HOMA2-IR, homeostasis model assess- ment 2-insulin resistance; HDL, high density lipoprotein; LDL, low density lipoprotein.
Table 2. Comparisons between the LDL cholesterol underestimation group and over- estimation group
Variables Underestimated
group (n = 1,118,265)
Overestimated group (n = 1,208,543)
P value
Age (yr) 40.7 ± 13.0 40.9 ± 16.2 0.89
Female (%) 220,075 (19.7) 769,117 (63.6) < 0.001
BMI 24.6 ± 3.1 22.1 ± 2.9 < 0.001
Waist circumference (cm) 84.9 ± 8.4 75.6 ± 9.5 < 0.001 Fasting plasma glucose (mg/dL) 101.8 ± 25.4 91.2 ± 13.0 < 0.001 Fasting serum insulin (µIU/mL) 11.8 ± 10.4 8.1 ± 3.2 < 0.001
HOMA2-IR 1.55 ± 1.43 1.05 ± 0.41 < 0.001
Systolic blood pressure (mmHg) 120.1 ± 15.5 113.3 ± 17.9 < 0.001 Diastolic blood pressure (mmHg) 80.0 ± 10.5 73.9 ± 11.7 < 0.001 Total cholesterol (mg/dL) 177.1 ± 30.4 175.8 ± 37.2 0.76 Triglyceride (mg/dL) 239.0 ± 83.9 77.7 ± 61.3 < 0.001 HDL cholesterol (mg/dL) 41.4 ± 8.2 59.2 ± 13.1 < 0.001 Direct LDL cholesterol (mg/dL) 103.8 ± 27.2 87.9 ± 30.2 < 0.001 Estimated LDL cholesterol (mg/dL) 87.9 ± 25.0 101.1 ± 33.2 < 0.001 Non-HDL cholesterol (mg/dL) 135.7 ± 28.7 116.6 ± 37.9 < 0.001
Diabetes (%) 154,279 (13.9) 48,100 (4.0) 0.001
Hypertension (%) 361,432 (32.5) 192,279 (15.9) < 0.001 Hyperlipidemia (%) 750,247 (67.4) 128,710 (10.7) < 0.001 Cardiovascular disease (%) 16,140 (1.5) 15,711 (1.3) 0.88 Current smoking (%) 554,359 (50.0) 236,564 (19.8) < 0.001 Drug treatment
Diabetes (%) Hypertension (%) Hyperlipidemia (%)
85,599 (7.7) 161,231 (14.6)
64,227 (5.8)
42,903 (3.6) 89,674 (7.4) 25,742 (2.1)
0.09 0.034 0.09 Data are expressed as mean ± SD or frequency (%). To convert glucose level to mil- limoles per liter, multiply by 0.0555. To convert insulin level to picomoles per liter, mul- tiply by 6.945. To convert total, LDL, HDL, and non-HDL cholesterol levels to millimoles per liter, multiply by 0.0259. To convert triglyceride level to millimoles per liter, multi- ply by 0.0113. BMI, body mass index; HOMA2-IR, homeostasis model assessment 2-insulin resistance; HDL, high density lipoprotein; LDL, low density lipoprotein.
more likely to be diagnosed with diabetes or hypertension. In terms of lipid profiles, the subjects in the underestimated group had more atherogenic dyslipidemic lipid profiles (Table 2). In addition, when we defined subjects in the over- and underesti- mated groups whether the subjects fall into the same LDL-C category of the NCEP ATP-III guidelines or not, 8,668,556 sub- jects (81.5%) showed concordant results, 989,993 subjects (9.3%) fell into the underestimated group, and 975,106 subjects (9.2%) fell into the overestimated group (data not shown).
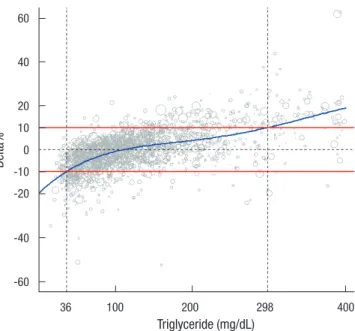
We next determined the clinical parameters that may affect the difference between the directly-measured and estimated LDL-C concentrations. Of all clinical parameters, serum triglyc- eride concentration showed the greatest independent associa- tion (standard β-value of 5.990); as serum triglyceride concen- tration increased, the difference between the two LDL-C values increased. That is, Friedewald’s formula appears to underesti- mate directly-measured LDL-C concentration (Table 3). To es- timate the triglyceride cutoffs that produce a statistical differ- ence, defined as delta% more than 10% between directly-mea- sured and estimated LDL-C concentrations, nonlinear and lin- ear quartile regression models were used. As a result, Friede- wald’s formula overestimated directly-measured LDL-C level when triglyceride concentration was less than 36 mg/dL (n = 283,919, 2.7%) and underestimated LDL-C level when triglycer- ide concentration was greater than 298 mg/dL (n = 439,170, 4.1%). However, in the majority of cases (n = 9,910,566, 93.2%), when serum triglyceride concentration ranged from 36 to 298 mg/dL, Friedewald’s formula accurately estimated serum LDL- C level (Fig. 1).
DISCUSSION
After being first introduced in 1972 (8), Friedewald’s formula has been widely used to estimate serum LDL-C concentration in clinical practice due to its simplicity and lack of additional cost. However, clinical utility of the formula has been reported to be limited in specific subject groups, including those with di- abetes, and renal and liver disease (9-13). In addition, the accu-
racy of Friedewald’s formula appears to be critically affected by a variety of clinical parameters, especially serum triglyceride concentration (10, 14, 18-22). To date, numerous studies have investigated the validity of Friedewald’s formula in the estima- tion of serum LDL-C concentration (18, 19, 23, 24). The majori- ty of these studies have shown that Friedewald’s formula under- estimates directly-measured serum LDL-C concentration. In one example, it was reported that calculated and directly-mea- sured LDL-C concentrations were significantly different, and directly-measured LDL-C value exceeded calculated LDL-C value in 93% of cases. As a result, concordant results using NCEP ATP-III risk categories were present in only 48.1% of the sample.
In addition, the discrepancy between the two LDL-C concentra- tions increased linearly as triglyceride concentration increased, and discrepancies in excess of 10% occurred in 24.6% of sub- jects with serum triglyceride concentration ≤ 1.13 mM/L and in 46.0% with serum triglyceride concentration ≤ 2.26 mM/L (18). Another report by Tanno et al. (19) also showed that dis- cordance between the two LDL-C concentrations in the NCEP group was most significantly associated with higher triglyceride concentration. In addition, although the two LDL-C concentra- tions were similar when triglyceride concentration was ≤ 1.69 mM/L, Friedewald’s formula significantly underestimated di- rectly-measured LDL-C concentration when triglyceride con- centration exceeded this cutoff (19).
In the present study, we investigated the accuracy of Friede- wald’s formula in estimating directly-measured LDL-C concen- tration. The results show that, when we define a significant dif- ference in the two LDL-C concentrations as a delta% ≥ 10%, the majority of subjects (78.1%, n = 8,305,947) show concordant re- sults between directly-measured and calculated LDL-C concen- Table 3. Multiple linear regression analysis for delta%
Variables Standard β-values* P value
Age -1.531 < 0.001
Female -1.255 0.005
Body mass index 0.372 0.046
Fasting plasma glucose -0.149 0.555
Total cholesterol -1.578 < 0.001
HDL cholesterol -5.320 < 0.001
Triglyceride 5.990 < 0.001
Diabetes 0.641 0.622
Current smoking 0.524 0.216
HOMA2-IR 0.446 0.080
A survey regression model was used. *Continuous predictors were standardized with their mean and SD.
Fig. 1. Difference between directly-measured LDL cholesterol and estimated LDL cho- lesterol values according to serum triglyceride concentration.
Delta%
Triglyceride (mg/dL)
36 100 200 298 400
60
20 40
10 0 -10 -20 -40 -60
trations, and only a small portion of the subjects show discon- cordant results between the two LDL-C concentrations. That is, 10.5% of subjects (n = 1,118,661) were categorized in an under- estimated group and 11.4% (n = 1,209,047) were overestimated.
In addition, we investigated the concordance between estimat- ed LDL-C value with respect to directly-measured LDL-C level at established NCEP cutoffs. Overall, 81.5% (n = 8,668,556) of subjects showed concordant results; 9.3% (n = 989,993) of sub- jects were categorized as underestimated, and 9.2% (n = 975,106) were categorized as overestimated (data not shown).
We next determined the clinical parameters that may affect the difference between the directly-measured and estimated LDL-C concentrations. In agreement with the results of previ- ous studies, serum triglyceride concentration appears to be the most powerful clinical parameter in determining the difference between directly-measured LDL-C and estimated LDL-C levels using Friedewald’s formula. However, contrary to previous stud- ies, Friedewald’s formula either underestimated or overestimat- ed directly-measured LDL-C concentration according to triglyc- eride concentration. That is, directly-measured LDL-C level be- gan to exceed estimated LDL-C level calculated with Friede- wald’s formula at triglyceride values greater than 111 mg/dL.
Conversely, estimated LDL-C level began to exceed directly- measured LDL-C value at triglyceride values less than 111 mg/
dL. Therefore, Friedewald’s formula did not uniformly underes- timate serum LDL-C concentration, rather it would either un- derestimate or overestimate directly-measured LDL-C value, especially according to serum triglyceride concentration.
Based on the finding that serum triglyceride concentration was the most powerful determinant in minimizing the differ- ence between directly-measured and estimated LDL-C concen- trations, we next investigated the range of serum triglyceride concentrations over which no statistically significant difference between the two LDL-C concentrations existed. When we de- fined a significant difference as greater than 10%, most of the subjects (n = 9,910,566, 93.2%) showed no significant difference in the two LDL-C concentrations when triglyceride concentra- tion ranged from 36 mg/dL to 298 mg/dL, using nonlinear and linear quartile regression models. That is, in most cases, Friede- wald’s formula can be used to accurately estimate serum LDL-C concentration. However, if serum triglyceride concentration is outside of this range (36-298 mg/dL), it might be recommend- ed to not use Friedewald’s formula to estimate LDL-C concen- tration and instead to directly measure serum LDL-C concen- tration. In accordance with our results, when triglyceride level was < 200 mg/dL, > 90% of the estimated LDL-C values were acceptable, that is, within ± 10% of the measured values. At tri- glyceride concentrations of 200-400 mg/dL, 72% of the estimat- ed values were acceptable (25). In addition, a study involving 9,477 subjects in Quebec City showed that the mean absolute error and the mean percentage of bias in plasma LDL-C con-
centration found using Friedewald’s formula, according to tri- glyceride quartiles of ≤ 4.5 mM/L, were less than 0.14 mM/L and 3.1%, respectively (20).
Similarly, we investigated triglyceride cutoff values in sub- jects with diabetes within whom Friedewald’s formula can be used without significant error. As a result, the Friedewald’s for- mula underestimated directly-measured LDL-C level when tri- glyceride concentration was greater than 276 mg/dL; however, the formula can be used with triglyceride levels less than 276 mg/dL without significant error (data not shown). In addition, no significant differences between the two LDL-C concentra- tions were noted when triglyceride concentration ranged from 63 mg/dL to 360 mg/dL in subjects taking lipid-lowering medi- cations (data not shown). Compared to subjects in the overesti- mated group, subjects in the underestimated group were more obese, insulin resistant, more likely to smoke, and more likely to be diagnosed with diabetes or hypertension. In terms of lipid profiles, the subjects in the underestimated group had more atherogenic dyslipidemic lipid profiles (Table 2). Consequently, using Friedewald’s formula, subjects in the underestimated group were likely to be under-treated despite relatively deranged metabolic profiles. On the other hand, subjects in the overesti- mated group were likely to be over-treated despite their relative- ly healthy metabolic profiles.
This study has several limitations. First, although the new gen- eration homogenous enzymatic method used in this study is accurate for directly determining LDL-C, we did not measure LDL-C level using β-quantification, which is the reference meth- od to directly measure LDL-C concentration. Second, although we defined a significant difference in the two LDL-C concen- trations as a delta% ≥ 10%, as is the case in most studies, this definition is somewhat arbitrary. Despite these limitations, this study was conducted with nationally representative, Korean population data and demonstrates that, contrary to most previ- ous reports, Friedewald’s formula does not uniformly underes- timate serum directly-measured LDL-C concentration but rath- er could either underestimate or overestimate LDL-C value, es- pecially according to serum triglyceride concentration. In addi- tion, we suggested a range of triglyceride concentration over which Friedewald’s formula can be used to estimate LDL-C con- centration with acceptable error.
In conclusion, Friedewald’s formula accurately estimates di- rectly-measured serum LDL-C concentration in Korean adults.
However, the formula can be applied to subjects with serum tri- glyceride concentrations from 36 to 298 mg/dL without signifi- cant error.
ACKNOWLEDGMENTS
This study was performed using raw data from the Fourth Korea National Health and Nutrition Examination Survey (KNHANES
IV), which was conducted by the Korean Centres for Disease Control and Prevention.
REFERENCES
1. National Cholesterol Education Program (NCEP) Expert Panel on De- tection, Evaluation, and Treatment of High Blood Cholesterol in Adults (Adult Treatment Panel III. Third Report of the National Cholesterol Ed- ucation Program (NCEP) Expert Panel on Detection, Evaluation, and Treatment of High Blood Cholesterol in Adults (Adult Treatment Panel III) final report. Circulation 2002; 106: 3143-421.
2. Reiner Z, Catapano AL, De Backer G, Graham I, Taskinen MR, Wiklund O, Agewall S, Alegria E, Chapman MJ, Durrington P, et al. ESC/EAS Guidelines for the management of dyslipidaemias: the Task Force for the management of dyslipidaemias of the European Society of Cardiology (ESC) and the European Atherosclerosis Society (EAS). Eur Heart J 2011;
32: 1769-818.
3. Scandinavian Simvastatin Survival Study Group. Randomised trial of cholesterol lowering in 4444 patients with coronary heart disease: the Scandinavian Simvastatin Survival Study (4S). Lancet 1994; 344: 1383-9.
4. Expert Panel on Detection, Evaluation, and Treatment of High Blood Cholesterol in Adults. Executive Summary of The Third Report of The National Cholesterol Education Program (NCEP) Expert Panel on De- tection, Evaluation, and Treatment of High Blood Cholesterol In Adults (Adult Treatment Panel III). JAMA 2001; 285: 2486-97.
5. Havel RJ, Eder HA, Bragdon JH. The distribution and chemical composi- tion of ultracentrifugally separated lipoproteins in human serum. J Clin Invest 1955; 34: 1345-53.
6. Bachorik PS, Ross JW. National Cholesterol Education Program recom- mendations for measurement of low-density lipoprotein cholesterol: ex- ecutive summary. The National Cholesterol Education Program Work- ing Group on Lipoprotein Measurement. Clin Chem 1995; 41: 1414-20.
7. Nauck M, Warnick GR, Rifai N. Methods for measurement of LDL-cho- lesterol: a critical assessment of direct measurement by homogeneous as- says versus calculation. Clin Chem 2002; 48: 236-54.
8. Friedewald WT, Levy RI, Fredrickson DS. Estimation of the concentra- tion of low-density lipoprotein cholesterol in plasma, without use of the preparative ultracentrifuge. Clin Chem 1972; 18: 499-502.
9. Rubiés-Prat J, Reverter JL, Senti M, Pedro-Botet J, Salinas I, Lucas A, Nogués X, Sanmartí A. Calculated low-density lipoprotein cholesterol should not be used for management of lipoprotein abnormalities in pa- tients with diabetes mellitus. Diabetes Care 1993; 16: 1081-6.
10. Hirany S, Li D, Jialal I. A more valid measurement of low-density lipo- protein cholesterol in diabetic patients. Am J Med 1997; 102: 48-53.
11. Johnson R, McNutt P, MacMahon S, Robson R. Use of the Friedewald formula to estimate LDL-cholesterol in patients with chronic renal fail- ure on dialysis. Clin Chem 1997; 43: 2183-4.
12. Matas C, Cabré M, La Ville A, Prats E, Joven J, Turner PR, Masana L, Camps J. Limitations of the Friedewald formula for estimating low-den-
sity lipoprotein cholesterol in alcoholics with liver disease. Clin Chem 1994; 40: 404-6.
13. Branchi A, Rovellini A, Torri A, Sommariva D. Accuracy of calculated serum low-density lipoprotein cholesterol for the assessment of coronary heart disease risk in NIDDM patients. Diabetes Care 1998; 21: 1397-402.
14. McNamara JR, Cohn JS, Wilson PW, Schaefer EJ. Calculated values for low-density lipoprotein cholesterol in the assessment of lipid abnormali- ties and coronary disease risk. Clin Chem 1990; 36: 36-42.
15. Korea Centers for Disease Control and Prevention. The Fourth Korea National Health and Nutrition Examination Survey (KNHANES IV).
Available at http://knhanes.cdc.go.kr/
16. Available at: http://www.dtu.ox.ac.uk/homa/index [accession on 27 January 2012].
17. American Diabetes Association. Standards of medical care in diabetes:
2010. Diabetes Care 2010; 33: S11-61.
18. Tighe DA, Ockene IS, Reed G, Nicolosi R. Calculated low density lipo- protein cholesterol levels frequently underestimate directly measured low density lipoprotein cholesterol determinations in patients with serum triglyceride levels < or =4.52 mmol/l: an analysis comparing the LipiDi- rect magnetic LDL assay with the Friedewald calculation. Clin Chim Acta 2006; 365: 236-42.
19. Tanno K, Okamura T, Ohsawa M, Onoda T, Itai K, Sakata K, Nakamura M, Ogawa A, Kawamura K, Okayama A. Comparison of low-density li- poprotein cholesterol concentrations measured by a direct homogeneous assay and by the Friedewald formula in a large community population.
Clin Chim Acta 2010; 411: 1774-80.
20. Tremblay AJ, Morrissette H, Gagné JM, Bergeron J, Gagné C, Couture P.
Validation of the Friedewald formula for the determination of low-den- sity lipoprotein cholesterol compared with beta-quantification in a large population. Clin Biochem 2004; 37: 785-90.
21. Marniemi J, Mäki J, Maatela J, Järvisalo J, Impivaara O. Poor applicabili- ty of the Friedewald formula in the assessment of serum LDL cholesterol for clinical purposes. Clin Biochem 1995; 28: 285-9.
22. DeLong DM, DeLong ER, Wood PD, Lippel K, Rifkind BM. A compari- son of methods for the estimation of plasma low- and very low-density lipoprotein cholesterol. The Lipid Research Clinics Prevalence Study.
JAMA 1986; 256: 2372-7.
23. Choi SY, Park HE, Kim MK, Shin CS, Cho SH, Oh BH. Difference between calculated and direct-measured low-density lipoprotein cholesterol in subjects with diabetes mellitus or taking lipid-lowering medications. J Clin Lipidol 2012; 6: 114-20.
24. Jun KR, Park HI, Chun S, Park H, Min WK. Effects of total cholesterol and triglyceride on the percentage difference between the low-density lipo- protein cholesterol concentration measured directly and calculated us- ing the Friedewald formula. Clin Chem Lab Med 2008; 46: 371-5.
25. Warnick GR, Knopp RH, Fitzpatrick V, Branson L. Estimating low-den- sity lipoprotein cholesterol by the Friedewald equation is adequate for classifying patients on the basis of nationally recommended cutpoints.
Clin Chem 1990; 36: 15-9.