ISSN 1225-1534 (Print) http://dx.doi.org/10.5303/PKAS.2012.27.4.213 Publications of the Korean Astronomical Society
27: 213 ∼ 216, 2012 September
° 2012. The Korean Astronomical Society. All Rights Reserved. c
AKARI MID- TO FAR-INFRARED OBSERVATIONS OF DIFFUSE GALACTIC EMISSION
I. Sakon
1, T. Onaka
1, T. I. Mori
1, R. Ohsawa
1, Y. Doi
2, Y. Okada
3, H. Kaneda
4, and T. Ootsubo
51
Department of Astronomy, Graduate School of Science, University of Tokyo, Japan
2
Department of Earth Science and Astronomy, Graduate School of Arts and Sciences, University of Tokyo, Japan
3
Universit¨at zu K¨oln, I. Physikalisches Institut, Germany
4
Graduate School of Science, Nagoya University, Japan
5
Astronomical Institute, Graduate School of Science, Tohoku University, Japan E-mail: [email protected]
(Received July 01, 2012; Accepted August 12, 2012)
ABSTRACT
We have collected dozens of mid-infrared spectra showing UIR bands from diffuse Galactic emitting regions with the AKARI’s Infrared Camera (IRC) onboard AKARI, as part of the ISMGN Mission Program. The datasets cover various directions in the inner Galactic Plane (|l| < 70 deg), in the outer Galactic Plane (|l| > 70 deg), and in the off-Plane (|b| > 2 deg). The variations in the UIR band ratios are examined in terms of the radiation environments judged from the far-infrared (50–170 µm) spectral energy distribution (SED) made with AKARI/FIS All Sky Survey data at each slit position where mid-IR spectra were obtained. We have found that the band ratios of 6.2 µm/11.2 µm and 7.7 µm/11.2 µm toward the inner Galaxy are systematically higher than those toward the outer Galaxy and off the Galactic plane. Likely causes of the variations in properties of UIR bands in diffuse emission on a Galactic scale are discussed in this paper.
key words: dust, extinction; infrared: ISM; ISM: lines and bands
1. INTRODUCTION
Unidentified Infrared (UIR) bands have been observed not only in the infrared spectra of celestial objects (see Tokunaga, 1997 for a review) but also in the diffuse Galactic emission (Onaka et al., 1996; Mattila et al., 1996). Although the exact nature of their carriers is not fully understood, the UIR bands appear to be ubiq- uitous throughout the interstellar medium and are be- lieved to predominatly be made up of polycyclic aro- matic hydrocarbons (PAHs; Duley & Williams, 1981;
Allamandola et al., 1989) and PAH-like molecular groups (e.g., amorphous organic solids with a mixed aromatic-aliphatic structure; Kwok & Zhang, 2011).
They are supposed to be formed mainly around the evolved late-type stars and to be physically and chem- ically modified during their ejection into interstellar
space. So far, several attempts to investigate differ- ences in the properties of the UIR bands in the dif- fuse Galactic emission on a Galactic scale have been made, which have aimed to demonstrate the evolution scenario of these carriers within the Milky Way. Ka- hanp¨a¨a et al. (2003) have presented ISOPHT-S spectra of diffuse emission between 5.5-12 µm at 29 positions on the Galactic plane for |l| < 60 deg and have found no systematic variations in the relative band strengths among their datasets. We note, however, that their analysis did not cover the outer Galactic plane, where interstellar conditions are expected to be different from those in the inner Galactic plane, in particular the aver- age interstellar radiation field strengths, metallicity etc.
Sakon et al. (2004) have made a first comparison of the properties of the UIR bands in diffuse Galactic emis-
http://pkas.kas.org 213
214 SAKON ET AL.
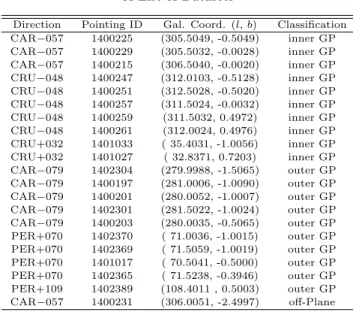
Table 1.
A List of Datasets
Direction Pointing ID Gal. Coord. (l, b) Classification CAR−057 1400225 (305.5049, -0.5049) inner GP CAR−057 1400229 (305.5032, -0.0028) inner GP CAR−057 1400215 (306.5040, -0.0020) inner GP CRU−048 1400247 (312.0103, -0.5128) inner GP CRU−048 1400251 (312.5028, -0.5020) inner GP CRU−048 1400257 (311.5024, -0.0032) inner GP CRU−048 1400259 (311.5032, 0.4972) inner GP CRU−048 1400261 (312.0024, 0.4976) inner GP CRU+032 1401033 ( 35.4031, -1.0056) inner GP CRU+032 1401027 ( 32.8371, 0.7203) inner GP CAR−079 1402304 (279.9988, -1.5065) outer GP CAR−079 1400197 (281.0006, -1.0090) outer GP CAR−079 1400201 (280.0052, -1.0007) outer GP CAR−079 1402301 (281.5022, -1.0024) outer GP CAR−079 1400203 (280.0035, -0.5065) outer GP PER+070 1402370 ( 71.0036, -1.0015) outer GP PER+070 1402369 ( 71.5059, -1.0019) outer GP PER+070 1401017 ( 70.5041, -0.5000) outer GP PER+070 1402365 ( 71.5238, -0.3946) outer GP PER+109 1402389 (108.4011 , 0.5003) outer GP CAR−057 1400231 (306.0051, -2.4997) off-Plane
sion between the inner Galaxy and the outer Galaxy based on the analysis of data collected with the Mid- Infrared Spectrometer (MIRS) on the Infrared Tele- scope in Space (IRTS; Murakami et al., 1996). They reported that the band ratios for 6.2 µm/11.2 µm and 7.7 µm/11.2 µm were systematically larger in the inner Galaxy than in the outer Galaxy. The difference in the ionisation fraction of the carriers due to the difference in average radiation field strengths between the inner and outer Galaxy is proposed as a plausible explanation for this, but definite conclusion has not yet been given only from their datasets. In this paper, we focus on the variation in the properties of the UIR bands in the diffuse Galactic emission on a Galactic scale based on observations with the AKARI Infrared Camera (IRC;
Onaka et al., 2007) and examine whether it can be explained by the difference in radiation field proper- ties constrained from the Far-Infrared Spectral Energy Distribution (SED) analyses using AKARI Far-Infrared All Sky Survey Data (Doi et al., 2009).
2. OBSERVATION
The mid-infrared Spectra of diffuse Galactic emission were collected with AKARI/IRC as part of the AKARI Mission Program ISMGN (Kaneda et al., 2009). The center position of the slit for each pointed observation was defined by a comparison between the N3 image, which is taken during each pointed observation, and the 2MASS data. The data reduction procedures ba-
0 2e-17 4e-17 6e-17 8e-17 1e-16 1.2e-16 1.4e-16
5 6 7 8 9 10 11 12 13
0 2e-17 4e-17 6e-17 8e-17 1e-16
5 6 7 8 9 10 11 12 13
0 2e-16 4e-16 6e-16 8e-16 1e-15 1.2e-15 1.4e-15 1.6e-15
5 6 7 8 9 10 11 12 13
Wavelength (micron)
Fλ [W cm-2
-2 μ-1-1F [W cmmpix]λ μ-1-1-2mpix]F [W cmλ
μ-1-1mpix]
(a)
(b)
(c)
Fig. 1. The resultant AKARI/IRC MIR-S spectra (a) collected at (l,b)=(311.5032, 0.4972) (Pointing ID. 1400259) as a representative spectrum of the inner Galactic Plane, (b) collected at (l,b)=(280.0035, −0.5065) (Pointing ID.
1400203) as a representative spectrum of the outer Galactic Plane, (c) collected at (l,b)=(306.0051, −2.4997) (Pointing ID. 1400231) as a representative spectrum of the off-Plane.
The zodiacal light has been subtracted from each spectrum by choosing other observation data collected at similar eclip- tic latitude β and with a Galactic longitude |b| higher than 30 deg from the archive. Extinction has not been corrected for in these plots.
sically follow those described by Sakon et al. (2007;
2008). Ten pointed observations were assigned to ob-
tain the spectra of the diffuse Galactic emission in the
inner Galactic plane (within the 8.5 kpc galactocentric
circle), another ten pointed observations were made to
obtain those in the outer Galactic plane (outside the
8.5kpc galactocentric solar circle), and one pointed ob-
servation to obtain an off-Plane reference (|b| ∼ 2.5
◦)
(see Table 1).
UIR BANDS IN DIFFUSE GALACTIC EMISSION 215
0.1 1 10 100 1000
10 100
Surface Brightness (MJy/sr)
Wavelength (micron)
5 20 50 200
AKARI/FIS All Sky Survey Data IRAS Sky Survey Atlas Data
Model (corrected for System Spectral Response)
2 components model curve 60K component 18K component
AKARI/IRC/MRS-S Spectroscopic Data
Fig. 2. An example of a SED made with AKARI FIS data at (l,b)=(32.8371,0.7203) (i.e., Pointing ID. 1401027).
The IRAS Sky Survey Atlas (ISSA) 12 µm and 25 µm band data calibrated with COBE/DIRBE Zodi-Subtracted Mis- sion Average (ZSMA) data to correct for the zero level un- certainty and the flux scale (Wheelock et al., 1994) are also used for the fit. The FIS data are shown with black squares and the ISSA data with gray squares. The best-fit two com- ponents model curve is shown with solid line. 18 K and 60 K components are also shown with long dashed short dashed line and broken line, respectively.
3. Galactic-Scale Variations of UIR Bands
The mid-infrared spectra of diffuse Galactic emission obtained with AKARI/IRC are dominated by UIR band features (see Fig. 1). In order to correct for extinction effects to the UIR band strengths, empirical relations of τ
6.2µm= 4.8τ
100µm, τ
7.7µm= 3.8τ
100µm, τ
8.6µm= 6.1τ
100µm, and τ
11.2µm= 4.3τ
100µm(Sakon et al., 2004) were adopted. The intrinsic UIR band ra- tios obtained from the spectrum at each position are summarised in Table 2. We find that the average val- ues of the UIR 6.2 µm/11.2 µm and UIR7.7 µm/11.2 µm ratios in the inner Galactic Plane (1.5 ± 0.3 and 3.5 ± 0.5) are systematically larger than those observed toward the outer Galactic Plane (1.1±0.3 and 2.6±0.5) and off the Galactic Plane (0.9±0.3 and 2.9±0.8). This is consistent with the results obtained by our previous IRTS/MIRS observation (Sakon et al., 2004). Since the ionisation of PAHs is balanced by the photo-ionisation and recombination of ambient electrons, PAHs in the photo-dissociation (PDR) region tend to be positively charged. Therefore, the higher UIR 6.2 µm/11.2 µm and UIR 7.7 µm/11.2 µm ratios in the inner Galactic Plane should indicate more dominant contributions of PDR regions within a beam in the line of sight in the in- ner Galactic Plane than in the outer Galactic Plane and
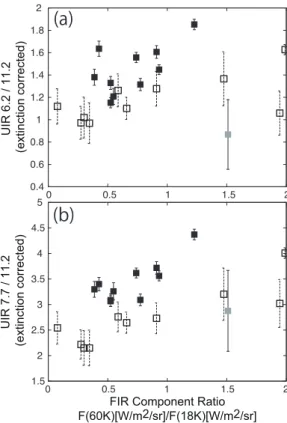
0.4 0.6 0.8 1 1.2 1.4 1.6 1.8 2
0 0.5 1 1.5 2
UIR 6.2 / 11.2 (extinction corrected)
1.5 2 2.5
3 3.5
4 4.5
5
0 0.5 1 1.5 2
UIR 7.7 / 11.2 (extinction corrected)
FIR Component Ratio F(60K)[W/m2/sr]/F(18K)[W/m2/sr]
(a)
(b)
Fig. 3. Plots of 6.2 µm/11.2 µm and 7.7 µm/11.2 µm as a function of the 60 K to 18 K components ratio, F (60 K)/F (18 K). The solid black squares correspond to the inner Galaxy data, the open black squares correspond to the outer Galaxy data, and the gray solid square corre- sponds to the off-Plane data.
in the off-Plane. Since the properties of the interstellar radiation field (ISRF) cannot be constrained only from the MIR datasets, however, we used the AKARI FIR All Sky Survey data (Doi et al., 2009) to characterize the ISRF properties at the slit position.
The mid- to far-infrared SED constructed from the
AKARI FIS All Sky Survey data and the ISSA 25
µm band data are fitted with a two temperature emis-
sion model (see Fig. 2). The temperatures of these
components are fixed to 18 K and 60 K. The 18 K
component represents the dust emission illuminated
by ISRF that is as strong as that of our vicinity
(U ∼1; Mathis et al., 1983), while 60 K compo-
nent represents the dust emission illuminated by ISRF
that is 1,000 times stronger than that of our vicinity
(U ∼1, 000). Therefore, the total flux ratio of 60 K
to 18 K components, F (60 K)/F (18 K), should indi-
cate the fraction of PDR-like regions within a beam
in the line of sight. In Fig. 3, the UIR 6.2 µm/11.2
µm and UIR 7.7 µm/11.2 µm are plotted against
216 SAKON ET AL.
Table 2.
Intrinsic UIR Band Ratios
Direction ID UIR6.2/11.2 UIR 7.7/11.2 CAR−057 1400225 1.380 ± 0.072 3.297 ± 0.155 CAR−057 1400229 1.606 ± 0.057 3.717 ± 0.122 CAR−057 1400215 1.635 ± 0.068 3.400 ± 0.132 CRU−048 1400247 1.329 ± 0.058 3.085 ± 0.121 CRU−048 1400251 1.315 ± 0.055 3.090 ± 0.115 CRU−048 1400257 1.557 ± 0.046 3.617 ± 0.097 CRU−048 1400259 1.852 ± 0.047 4.370 ± 0.104 CRU−048 1400261 1.448 ± 0.044 3.560 ± 0.098 CRU+032 1401033 1.208 ± 0.072 3.258 ± 0.168 CRU+032 1401027 1.152 ± 0.046 3.065 ± 0.106 CAR−079 1402304 0.972 ± 0.147 2.217 ± 0.287 CAR−079 1400197 1.262 ± 0.147 2.758 ± 0.291 CAR−079 1400201 0.969 ± 0.182 2.149 ± 0.349 CAR−079 1402301 1.101 ± 0.099 2.645 ± 0.206 CAR−079 1400203 1.019 ± 0.183 2.149 ± 0.341 PER+070 1402307 1.059 ± 0.198 3.020 ± 0.470 PER+070 1402369 1.366 ± 0.241 3.202 ± 0.512 PER+070 1401017 1.277 ± 0.155 2.730 ± 0.301 PER+070 1402365 1.627 ± 0.046 4.008 ± 0.104 PER+109 1402389 1.119 ± 0.158 2.542 ± 0.317 CAR−057 1400231 0.868 ± 0.312 2.875 ± 0.792