Carbon and Nitrogen Responses of Litterfall Components by NPK and PK Fertilizers in a Red Pine (Pinus densiflora S. et Z.) Stand
Seong-Wan Park1, Gyeongwon Baek1, Seongjun Kim2, A-Ram Yang3 and Choonsig Kim 1*
1Department of Forest Resource, Gyeongnam National University of Science and Technology, Jinju 52725, Korea
2Institute of Life Science and Natural Resources, Korea University, Seoul 02841, Korea
3Forest Technology and Management Research Center, National Institute of Forest Science, Pocheon 11186, Korea
Abstract: This study was conducted to determine the carbon (C) and nitrogen (N) response of litterfall components as affected by N addition in compound fertilizer in a Korean red pine (Pinus densiflora S. et Z.) stand in southern Korea. Litterfall in a mature red pine stand was collected for two years following compound fertilizer application (N3P4K1; P4K1) and no fertilization (control). The C concentration of litterfall components was not significantly (P > 0.05) different between the N3P4K1 and the control plots, whereas the N concentration of the litterfall components was significantly higher in the N3P4K1 plot than in the control plot. The N3P4K1 and P4K1 additions induced a lower C/N ratio of litterfall components compared with the control plot. Annual C and N fluxes via litterfall components were not affected by the N3P4K1 addition over the study period, except for reproduction litter. Annual N fluxes via reproduction litter were significantly higher in the N3P4K1 plot than in the control plot. Thus, the N3P4K1 and P4K1 additions could modify differently nutrient distribution of the forest floor and mineral soils in a red pine stand. These results indicate that N concentration and C/N ratio in litterfall components are more susceptible to fertilizer application than the C response in litterfall components.
Key words: carbon cycling; nitrogen cycling; fertilization; litterfall; nitrogen addition
Introduction1)
Nutrient returns via litterfall represent an important parameter for assessing nutrient cycling in forest stands (Berg and Laskowski, 2006). However, nutrient returns vai litterfall on a small local scale depend on forest man- agement activities, such as fertilization (Smaill et al., 2008; Kim et al., 2013a) and thinning (Kim et al., 2009).
For example, fertilization can change the nutrient proc- esses of litterfall because the nutrient concentration and content in litterfall can change with the shift in nutrient availability induced by fertilizer (Lee and Son, 2006;
Kim et al., 2013b; Huang et al., 2016). However, pre- vious fertilization studies related to the nutrient responses of litterfall have focused mainly on nitrogen (N) or phosphorus (P) fertilizer alone (Lee and Son, 2006; Mayor
* Corresponding author E-mail: [email protected] ORCID
Choonsig Kim https://orcid.org/0000-0002-3263-1187
et al., 2014; Huang et al., 2016), since N or P are com- monly known to be limiting elements for forest productivity (Mayor et al., 2014; Sardans et al., 2017). Such studies found that foliar N and P concentrations increased by P fer- tilization because of increased N-uptake capacity due to en- hanced P availability, whereas N fertilization led to in- creased N concentration in foliage (Sardans et al., 2017).
Despite the previous findings, the nutrient responses of litterfall to the combined application of N and P fertilizers are still unclear. They may be different with the response following N addition in compound fertilizer because the nutrient dynamics of litterfall could be affected by different soil nutrient availability induced by compound fertilizer types. In addition, it is necessary to investigate the effects of N or P fertilizer on the nutrient response of litterfall because nutrient deficiency commonly occurs in many forest stands (Weetman and Wells, 1990; Kim et al., 2014; Kim et al., 2015).
Korean red pine (Pinus densiflora S. et Z.) is the most dominant conifer tree distributed throughout the country
JOURNAL OFKOREANSOCIETY OFFORESTSCIENCE ISSN 2586-6613(Print), ISSN 2586-6621(Online) http://e-journal.kfs21.or.kr https://doi.org/10.14578/jkfs.2019.108.1.21
21
(Kim et al., 2014). However, many studies have reported multi-nutrient deficiency problems in red pine stands through needle nutrient analysis (Joo et al., 1983; Kim et al., 2013b; Kim et al., 2014). Thus, compound fertilizer was recommended to increase annual tree growth in most Korean red pine forest stands (Kim et al., 2014). Although the nutrient dynamics in the litterfall may be a factor in determining the response to fertilizers (Smaill et al., 2008;
Kim et al., 2013b; Baek et al., 2018), little is known about the behavior of nutrient dynamics of litterfall components following the additions of NPK and PK. Additionally, previous studies mainly focused on the nutrient dynamics of needle litter (Vose and Allen, 1991; Sariyildiz and Anderson, 2005; Yang et al., 2017), whereas they rarely involved the nutrient dynamics of litterfall components such as bark, branches, reproduction and miscellaneous litter as affected by fertilizer.
The objective of this study was to measure the C and N response of litterfall components following NPK and PK additions in a red pine stand. The hypothesis of this study was that the application of fertilizer would alter C and N dynamics in litterfall by improving soil nutrient availability. To address this hypothesis, two different types of fertilizers (N3P4K1 and P4K1) were applied experimentally to a Korean red pine stand, which has been monitored for approximately two years.
Materials and Methods
The study site was located in a matured red pine stands (about 40 years old) with low forest productivity (site index, 8-10) in the Wola National Experimental Forest (35o12'32"N, 128o10'23"E, 180 m; 35o12'26"N; 128o10'25"E,
195 m), in Jinju, Korea. The annual average precipitation and temperature during two study years are 1,635 mm yr-1 and 13.15 C, respectively (Figure 1). The forest soil type is a slightly dry, dark-brown forest soil that corresponds to Inceptisols in USDA soil taxonomy. Total 18 plots [(three treatments (NPK, PK, Control) × two blocks × three replicated plots)] were established and each block was divided into nine 10 m × 10 m plots with a 5 m buffer zone.
The applied fertilizer types (urea, fused superphosphate and potassium chloride fertilizers) included a compound fertilizer following the fertilization guideline (N3P4K1=113:150:37 kg ha-1) in Korea forests (Joo et al., 1983) and that without N component (P4K1=150:37 kg ha-1) to determine N fertilizer effects in compound fertilizer. More information in the study site can be found in other studies (Kim et al., 2017; Baek et al., 2018).
Three circular litter traps (with a surface area of 0.25 m2) were installed at each treatment plot (for a total of 54 litter traps) to measure C and N fluxes via litterfall com- ponents. Litter was collected at monthly intervals and oven- dried at 65 oC for 48 hours in a laboratory. All dried samples were separated into litterfall components (needle,
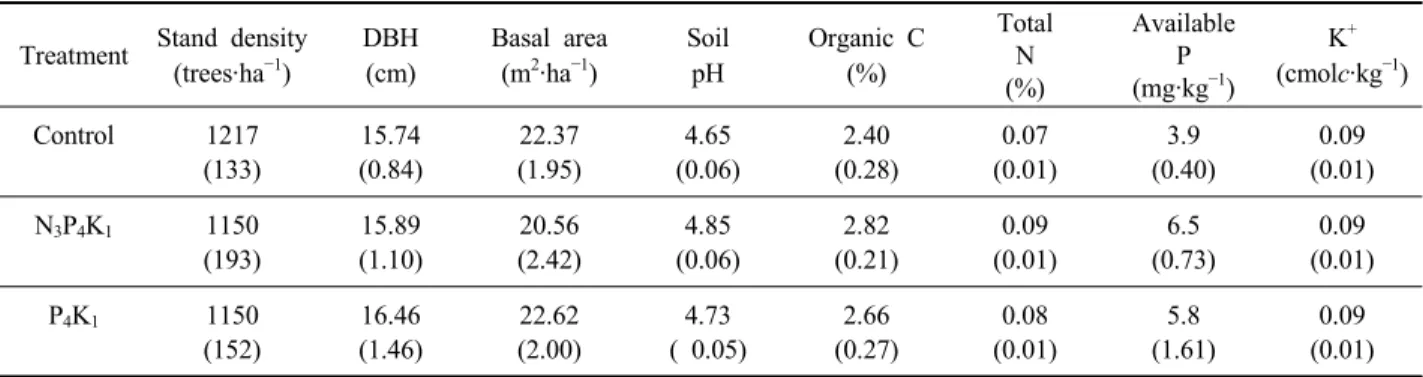
Treatment Stand density (trees·ha−1)
DBH (cm)
Basal area (m2·ha−1)
Soil pH
Organic C (%)
Total N (%)
Available P (mg·kg−1)
K+ (cmolc·kg−1)
Control 1217
(133)
15.74 (0.84)
22.37 (1.95)
4.65 (0.06)
2.40 (0.28)
0.07 (0.01)
3.9 (0.40)
0.09 (0.01) N3P4K1 1150
(193)
15.89 (1.10)
20.56 (2.42)
4.85 (0.06)
2.82 (0.21)
0.09 (0.01)
6.5 (0.73)
0.09 (0.01) P4K1 1150
(152)
16.46 (1.46)
22.62 (2.00)
4.73 ( 0.05)
2.66 (0.27)
0.08 (0.01)
5.8 (1.61)
0.09 (0.01) Values in parenthesis represent standard errors (n = 6). DBH: diameter at breast height at 1.2 m.
Table 1. General stand and soil characteristics of the study site before fertilizer application.
0 200 400 600 800
0 8 16 24 32 40
May 2011 Jun. Jul. Aug. Sep. Oct. Nov. Dec. Jan. 2012 Feb. Mar. Apr. May. Jun. Jul. Aug. Sep. Oct. Nov. Dec. Jan. 2013 Feb. Mar. Apr. Precipitation (mm)
Temperature (oC)
Month
Temperature Precipitation
Figure 1. Monthly temperature and precipitation of the study site.
bark, branches, reproduction and miscellaneous) and was weighed. The litterfall component samples collected for each sampling month between May 2011 and April 2013 were composited with three seasonal sampling times of heavy litterfall season (October-November), winter season (December-March) and two growing seasons (early growing season: April- June; late growing season: July-September).
The composited litter samples were ground in a Wiley mill for C and N analysis. Carbon and N concentrations from the ground materials were determined using an elemental analyzer (Thermo Scientific, Flash 2000, Italy). Annual C and N fluxes via litterfall components were calculated by multi- plying the litterfall weight by C and N concentrations of litterfall components. After KCl extracting of a 5-gram of fresh mineral soil by a mechanical vacuum extractor (Model 24VE, SampleTek, Science Hill, KY, USA), ammonium (NH4+-N) and nitrate (NO3--N) concentrations from the soil solution following fertilization were determined using an auto analyzer (AQ2 Discrete Analyzer, UK).
Three-way analysis of variance (ANOVA) was used to determine the significance of main effects [fertilizer treatment (F), sampling month (M), litterfall components (C)] and their interactions (F × M, M × C, F × C, F × M × C) at P < 0.05 by the GLM procedure in SAS (SAS Institute, 2003). All post-hoc analysis for mean separations was conducted with Tukey's test.
Results and Discussion
1. Carbon and nitrogen concentration of litterfall components
The N addition in compound fertilizer had a significant effect on the inorganic soil N (NH4+-N and NO3-
-N) con-
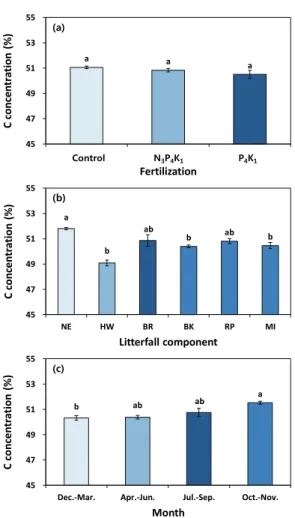
centrations. Inorganic soil N concentration rapidly increased in the N3P4K1 plot compared to the control (Figure 2), whereas soil N availability was not affected by the PK addition. Mean C concentration in litterfall components was slightly lower in the N3P4K1 (50.8 %) and P4K1 (50.5
%) plots than in the control (51.1 %) plot, but the concen- tration was not affected by the N addition in compound fertilizer (Table 2, Figure 3). This result is in line with an- other study reporting that the C concentration of needle lit- ter was a poor indicator of fertilizer response with a similar C concentration between fertilized (53.9 %) and unfertilized (53.8 %) in radiata pine (P. radiata) plantations (Smaill et
Fertilization a a a a a a a
ab b a a a a a a a b b a b b a a a a a a a ab
b a a a a b b a
b b a ab
b a a a a ab
b a a a a a a
a a a
a b b a a a a a a a ab 0 b
80 160 240 320 400
NH4+-N (mg kg-1) Control NPK PK
a a a a a a
a a a a a a a a a a ab
b a a a a a a a a a
a b b a a a
a a a a a a a a a a a a a a a a a a
a b b a b b
a b c a
a a
a b c a b b 0
10 20 30 40 50 60
Apr. May Jun. Jul. Aug. Sep. Oct. Nov. Dec. Jan. Feb. Mar. Apr. May Jun. Jul. Aug. Sep. Oct. Nov. Dec. Jan. Feb. Mar.
2011 2012 2013
NO3--N (mg kg-1)
Month
Control NPK PK
Fertilization
Control N3P4K1 P4K1
Control N3P4K1 P4K1 Fertilization
Fertilization
Figure 2. Monthly variation of soil NH4+-N and NO3--N concentration (n=6) following fertilizer applications in a red pine stand. Vertical bars represent standard error. Different letters on the bars in dicate significant difference between fertilizer treatment and control plots at P < 0.05.
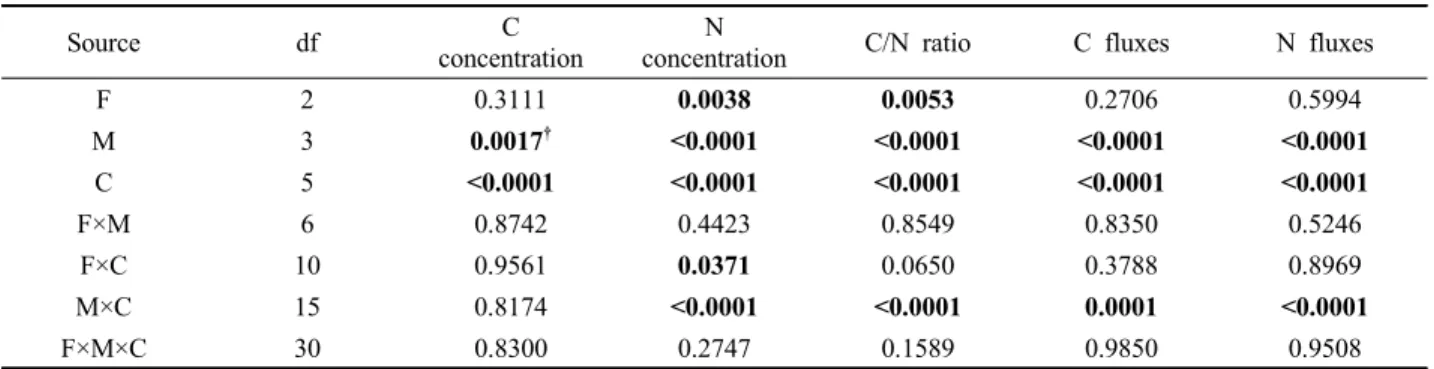
Source df C
concentration N
concentration C/N ratio C fluxes N fluxes
F 2 0.3111 0.0038 0.0053 0.2706 0.5994
M 3 0.0017† <0.0001 <0.0001 <0.0001 <0.0001
C 5 <0.0001 <0.0001 <0.0001 <0.0001 <0.0001
F×M 6 0.8742 0.4423 0.8549 0.8350 0.5246
F×C 10 0.9561 0.0371 0.0650 0.3788 0.8969
M×C 15 0.8174 <0.0001 <0.0001 0.0001 <0.0001
F×M×C 30 0.8300 0.2747 0.1589 0.9850 0.9508
†Bold values denote a significance at P < 0.05.
Table 2. Results of ANOVA on the effects of compound fertilizer types (F), sampling month (M), and litterfall component (C) on litterfall C and N dynamics following compound fertilizer application in a red pine stand.
al., 2008). Regardless of fertilization, the difference in C concentration of litterfall components in this red pine stand could occur be the result of genetic and environmental fac- tors such as litterfall components and sampling month. For example, the lower C concentration (49.1 %) in hardwood litter compared with needle litter (51.8 %) could be due to the high N concentration (1.01 %) of hardwood litter com- pared with the needle litter (0.63 %). Also, the higher C concentration (51.5 %) of the litterfall components in the heavy litter season compared with C concentration (50.3- 50.7 %) in other sampling months. This result could be at- tributed to nutrient resorption before needle abscission (P oorter and De Jong, 1999; Baek et al., 2018).
The N concentration of litterfall components showed
significant two-factor interactions (F × C; M × C) (Table 2).
The N concentration in the needle litter appeared to be unaffected by the N addition in compound fertilizer. In the previous study, the N concentration of leaf litterfall in oak stands appeared to exert no discernible effect with various rates of compound fertilizer (Kim et al., 2013a) because the N concentration in the leaf litter is controlled by various combinations of factors, including fertilization, tree growth status, climatic factors, nutrient dilution effect by increased needle production and N resorption rates (Berg and Laskowski, 2006; Baek et al., 2018). In contrast to this finding, the N concentration of needle litter in radiata pine was significantly higher in fertilized (0.84 %) than in unfertilized (0.79 %) stands (Smaill et al., 2008) because soil N availability increased by fertilization tends to produce high N concentrations in needle litter (Sariyildiz and Anderson, 2005; Baek et al., 2018). Although N con- centration in needle litter was not affected by N addition, mean N concentration over all litterfall components increased in the N3P4K1 (0.71 %) and P4K1 (0.68 %) plots com- pared with the control (0.63 %) plots. This increase in N concentrations in all litterfall components could be attributed to the reproduction and miscellaneous litter parts which were highly N responsive in N3P4K1 plots (Figure 5). In addition, N concentration in the reproduction litter in the P4K1 plot might be affected by P fertilization as well, which can enhance soil N availability by increasing the activity of free living N2-fixing soil microbes (Sardans et al., 2017).
The N concentration in the litterfall components was af- fected by the sampling month (Table 2). The N concen- tration in needle litter was significantly higher in the grow- ing season than the other seasons (Figure 4). Kim et al.(2013b) reported that the high N concentration in needle litter during the growing season could be due to the high proportion of green foliage fluxes. Meanwhile, the C/N ra- tio of litterfall components was significantly lower in the N3P4K1 and P4K1 plot than in the control plot. This result suggests that the N3P4K1 and P4K1 additions were related to a change in the C/N ratio by producing increased N concentrations in the litterfall components. Furthermore, the C/N ratio among litterfall components was significantly high- er in the bark litter than in the other litterfall components be- cause of significantly low N concentration compared with other litterfall components (Figure 5).
a a a
45 47 49 51 53 55
Control N3P4K1 P4K1
C concentration (%)
Fertilization
a
b
ab b ab b
45 47 49 51 53 55
NE HW BR BK RP MI
C concentration (%)
Litterfall component
b ab ab a
45 47 49 51 53 55
Dec.-Mar. Apr.-Jun. Jul.-Sep. Oct.-Nov.
C concentration (%)
Month (b)
(a)
(c)
Control N3P4K1 P4K1
Figure 3. Carbon concentration of fertilizer treatment (a), litterfall component (b, NE: needle; HW: hardwood leaf; BR: branches;
BK: bark; RP: reproduction; MI: miscellaneous) and sample months (c) following compound fertilizer application in a red pine stand. Vertical bars represent standard error. Different letter on the bars represents a significant difference between fertilizer treatments (a), litterfall components (b), or months (c) at P <
0.05.
bc bc bc
a a a
bc c bc
d d d
bc
b bc
ab
a
a
0.0 0.3 0.6 0.9 1.2 1.5 1.8
Control N3P4K1 P4K1
N concentration (%)
Fertilization
NE HW BR BK RP MI
d
c
d
d c
a
d d d cd
e e e e
c
d d d
b b
c
0.0 0.6 1.2 1.8 2.4 3.0
Dec.-Mar. Apr.-Jun. Jul.-Sep. Oct.-Nov.
N concentration (%)
Month
NE HW BR BK RP MI
Control N3P4K1 P4K1
(a)
(b)
Figure 4. Nitrogen concentration and litterfall component with fertilizer treatment (a) and sampling month (b, NE: needle, HW:
hardwood leaves; BR: branches; BK: bark; RP: reproduction;
MI: miscellaneous) following compound fertilizer application in a red pine stand. Vertical bars represent standard error.
Different letter on the bars represents a significant difference between fertilizer treatments (a) or months (b) at P < 0.05.
(a)
(b)
a b b
0 30 60 90 120 150
Control N3P4K1 P4K1
C/N ratio
Fertilization
c
cd c
b
cd
d
cd c c cdc
a a a
a
cd
c
b bc
d d
cd
0 70 140 210 280 350
Dec.-Mar. Apr.-Jun. Jul.-Sep. Oct.-Nov.
C/N ratio
Month
NE HW BR BK RP MI
Control N3P4K1 P4K1
Figure 5. C/N ratio by fertilizer treatment (a) and sampling month (b, NE: needle, HW: hardwood leaves; BR; branches; BK: bark;
RP: reproduction; MI: miscellaneous). Vertical bars represent standard error. Different letter on the bars represent a significant difference between fertilizer treatments (a) or months (b) at P
< 0.05.
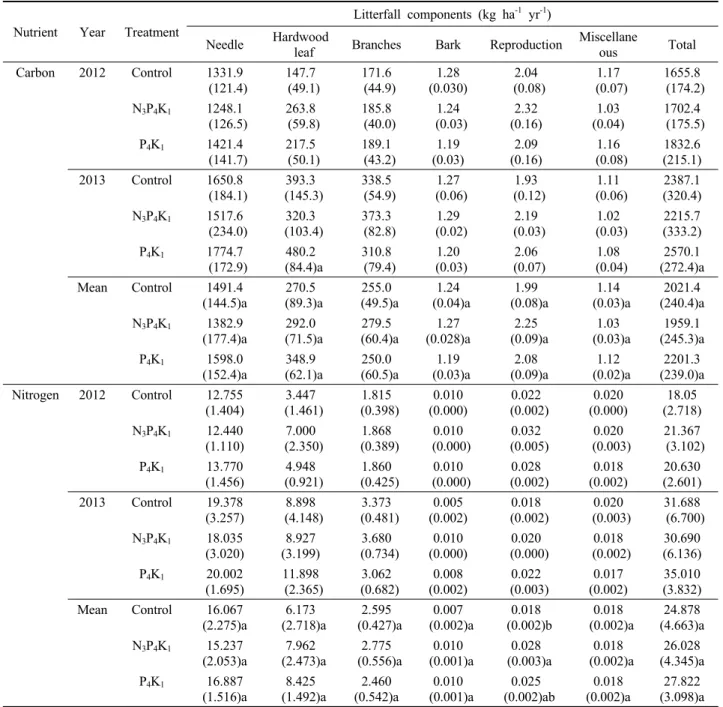
2. Carbon and nitrogen fluxes via litterfall components Total mean C and N fluxes via litterfall components for the study periods were not significantly different between
the fertilizer treatment (N3P4K1, P4K1) plots and the control plot over the two years, except for the N fluxes via reproduction litter in the N3P4K1 plot (Table 3). The similar C and N fluxes via litterfall components between the fertilizer plots and the control plot could be due to the short period of the fertilization trials for two years (Lee and Son, 2006) or to the closed canopy of the mature pine stands. Another study reported that there was no needle litterfall response to the combined fertilization of N and P sources in loblolly pine stands on a high soil N availability (Vose and Allen, 1991). In contrast to the other litterfall components, the N fluxes via reproduction litter such as male strobili significantly increased by the N addition in compound fertilizer (Table 3). Total mean C and N fluxes were 2,021 kg C ha-1 year-1 and 24.878 kg N ha-1 year-1 for the control, 1,959 kg C ha-1 year-1 and 26.078 kg N ha-1 year-1 for the N3P4K1 and 2,201 kg C ha-1 year-1 and 27.822 kg N ha-1 year-1 for the P4K1 plots, respectively.
Total C fluxes in these study fall within the range reported for other red pine forests (2,020-2,800 kg C ha-1 year-1) in Korea (Kim et al., 2009), but are slightly lower than the global mean value (about 2,500 kg C ha-1 year-1) of coniferous forests in a warm-temperate climate (Bray and Gorham, 1964).
b
b b
a
d d
c
d c c d
eee eee eee deee
0 200 400 600 800 1000
C flux (kg ha-1 yr-1) NE HW BR BK RP MI(a)
(b)
b
a ab a
c c
a
c d
c c
eee eee eee deee
0 2 4 6 8
Dec.-Mar. Apr.-Jun. Jul.-Sep. Oct.-Nov.
N flux (kg ha-1yr-1)
Month
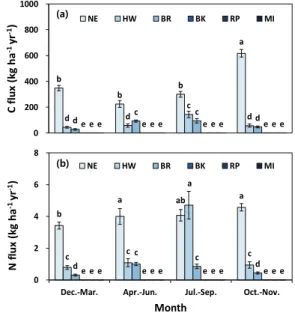
NE HW BR BK RP MI
Figure 6. Carbon (a) and nitrogen fluxes (b) by sampling month and via litterfall components (NE: needle, HW: hardwood leaves; BR: branches; BK: bark; RP: reproduction; MI:
miscellaneous) following fertilizer application in a red pine stand. Vertical bars represent standard error. Different letters on the bars indicate a significant difference in carbon flux (a) and nitrogen flux (b) between months (c) at P < 0.05.
Nutrient Year Treatment
Litterfall components (kg ha-1 yr-1) Needle Hardwood
leaf Branches Bark Reproduction Miscellane
ous Total
Carbon 2012 Control 1331.9 (121.4)
147.7 (49.1)
171.6 (44.9)
1.28 (0.030)
2.04 (0.08)
1.17 (0.07)
1655.8 (174.2) N3P4K1 1248.1
(126.5)
263.8 (59.8)
185.8 (40.0)
1.24 (0.03)
2.32 (0.16)
1.03 (0.04)
1702.4 (175.5) P4K1 1421.4
(141.7)
217.5 (50.1)
189.1 (43.2)
1.19 (0.03)
2.09 (0.16)
1.16 (0.08)
1832.6 (215.1) 2013 Control 1650.8
(184.1) 393.3
(145.3) 338.5
(54.9) 1.27
(0.06) 1.93
(0.12) 1.11
(0.06) 2387.1 (320.4) N3P4K1 1517.6
(234.0) 320.3
(103.4) 373.3
(82.8) 1.29
(0.02) 2.19
(0.03) 1.02
(0.03) 2215.7 (333.2) P4K1 1774.7
(172.9)
480.2 (84.4)a
310.8 (79.4)
1.20 (0.03)
2.06 (0.07)
1.08 (0.04)
2570.1 (272.4)a Mean Control 1491.4
(144.5)a
270.5 (89.3)a
255.0 (49.5)a
1.24 (0.04)a
1.99 (0.08)a
1.14 (0.03)a
2021.4 (240.4)a N3P4K1 1382.9
(177.4)a
292.0 (71.5)a
279.5 (60.4)a
1.27 (0.028)a
2.25 (0.09)a
1.03 (0.03)a
1959.1 (245.3)a P4K1 1598.0
(152.4)a
348.9 (62.1)a
250.0 (60.5)a
1.19 (0.03)a
2.08 (0.09)a
1.12 (0.02)a
2201.3 (239.0)a Nitrogen 2012 Control 12.755
(1.404) 3.447
(1.461) 1.815
(0.398) 0.010
(0.000) 0.022
(0.002) 0.020
(0.000) 18.05 (2.718) N3P4K1 12.440
(1.110) 7.000
(2.350) 1.868
(0.389) 0.010
(0.000) 0.032
(0.005) 0.020
(0.003) 21.367 (3.102) P4K1 13.770
(1.456)
4.948 (0.921)
1.860 (0.425)
0.010 (0.000)
0.028 (0.002)
0.018 (0.002)
20.630 (2.601) 2013 Control 19.378
(3.257)
8.898 (4.148)
3.373 (0.481)
0.005 (0.002)
0.018 (0.002)
0.020 (0.003)
31.688 (6.700) N3P4K1 18.035
(3.020)
8.927 (3.199)
3.680 (0.734)
0.010 (0.000)
0.020 (0.000)
0.018 (0.002)
30.690 (6.136) P4K1 20.002
(1.695) 11.898
(2.365) 3.062
(0.682) 0.008
(0.002) 0.022
(0.003) 0.017
(0.002) 35.010 (3.832) Mean Control 16.067
(2.275)a 6.173
(2.718)a 2.595
(0.427)a 0.007
(0.002)a 0.018
(0.002)b 0.018
(0.002)a 24.878 (4.663)a N3P4K1 15.237
(2.053)a 7.962
(2.473)a 2.775
(0.556)a 0.010
(0.001)a 0.028
(0.003)a 0.018
(0.002)a 26.028 (4.345)a P4K1 16.887
(1.516)a
8.425 (1.492)a
2.460 (0.542)a
0.010 (0.001)a
0.025 (0.002)ab
0.018 (0.002)a
27.822 (3.098)a Values in parentheses represent standard error. Different letter among treatments represent a significant difference between the fertilizer treatments at P < 0.05.
Table 3. Carbon and nitrogen fluxes via litterfall components by compound fertilizer types.
The C and N fluxes via litterfall components demonstrated a significant two-factor interaction (M × C) (Table 2). The seasonal C and N fluxes via needle litter showed maximum values in heavy litterfall season compared with the other seasons (Figure 6). This pattern fits into the findings from many studies for coniferous tree species because of the natural senescence of temperate forests (Kim et al., 2005).
In contrast to needle litter, C and N fluxes via hardwood leaf litter were highest in the late growing season (Figure
6). However, seasonal patterns of C and N fluxes via woody and miscellaneous litter were irregular throughout the year because the flux patterns of this litter type were attributed to forest disturbance factors (Sato, 2004).
Conclusions
The C concentration of litterfall components was not affected by the N3P4K1 and P4K1 additions, whereas N
concentration of litterfall components increased with N3P4K1
compared with the control. The C/N ratio of litterfall components was easily influenced by N3P4K1 and P4K1
additions with a lower C/N ratio compared with the control treatments. However, the C and N fluxes via litterfall com- ponents were not related to the N3P4K1 and P4K1 additions over the study period, except for reproduction litter, which was most sensitive to the N3P4K1 additions among litterfall components. The results indicated that the C response of litterfall components could have a minimal impact on N3P4K1
addition, whereas N responses could differ considerably by N addition in a red pine stand.
Acknowledgments
This work was supported by Gyeongnam National University of Science and Technology Grant (2018).
References
Baek, G., Yang, A.R. and Kim, C. 2018. Carbon and nitrogen resorption of needles as affected by compound fertilizer in a red pine stand. Forest Science and Technology 12:
126-131.
Berg, B. and Laskowski, R. 2006. Litter decomposition; A guide to carbon and nutrient turnover. Advances in Ecological Research 38: 20-71.
Bray, J.R. and Gorham, E. 1964. Litter production in forests of the world. Advances in Ecological Research 2: 101-157.
Huang, X., Cui, J., Yu, X., Tao, X. and Xu, X. 2016. Litterfall response to nitrogen and phosphorus fertilization in subtropical evergreen broad-leaved forest of 80-year-old.
Bangladesh Journal of Botany 45: 1035-1042.
Jeong, J., Jo, C.G., Baek, G.W., Park, J.H., Ma, H.S., Yoo, B.O. and Kim, C. 2017. Soil and the foliage nutrient status following soil amendment applications in a Japanese cypress (Chamaecyparis obtuse Endlicher) plantation.
Journal of Sustainable Forestry 36: 289-303.
Joo, J.S., Lee, W.K., Kim, T.H., Lee, C.Y., Jin, I.S., Park, S.K. and Oh, M.Y. 1983. Studies on fertilization in pruning and thinning stands. The Research Report of Forest Research Institute 30: 155-189.
Kim, C., Koo, K.S. and Byun, J.K. 2005. Litterfall and nutrient dynamics in pine (Pinus rigida) and larch (Larix leptolepis) plantations. Journal of Korean Forest Society 94: 302-306.
Kim, C., Son, Y., Lee W.K., Jeong, J. and Noh, N.J. 2009.
Influence of forest tending works on carbon distribution and cycling in a Pinus densiflora S et. Z. stands in Korea.
Forest Ecology and Management 257: 1420-1426.
Kim, C., Byun, J.K., Park, J.H. and Ma, H.S. 2013a. Litter fall and nutrient status of green leaves and leaf litter at various compound ratios of fertilizer in sawtooth oak stands, Korea. Annals of Forest Research 56: 339-350.
Kim, C., Jeong, J. and Kim, J.S. 2013b. Carbon and nitrogen inputs by litter fall in fertilized and unfertilized larch plantations. Forest Science and Technology 7: 17-22.
Kim, Y., Byun, J.K., Kim, C., Park, B.B., Kim, Y.K. and Bae, S.W. 2014. Growth response of Pinus densiflora seedlings to different fertilizer compound ratios in a recently burned area in the eastern coast of Korea. Landscape and Ecological Engineering 2014: 241-247.
Kim, C., Jeong, J., Park, J.H. and Ma, H.S. 2015. Growth and nutrient status of foliage as affected by tree species and fertilization in a fire-disturbed urban forest. Forests 6:
2199-2213.
Kim, C., Baek, G., Park, S.W. and Kim, S. 2017. Inorganic nitrogen dynamics of throughfall following fertilization in a red pine stand. Forest Science and Technology 13:
187-191.
Lee, I.K. and Son Y. 2006. Effects of nitrogen and phosphorus fertilization on nutrient dynamics and litterfall production of Pinus rigida and Larix kaempferi. Journal of Ecology and Field Biology 29: 205-212.
Mayor, J.R., Wright, S.J. and Turner, B.L. 2014. Species-specific responses of foliar nutrients to long-term nitrogen and phosphorus additions in a lowland tropical forest. Journal of Ecology 102: 36-44.
Poorter, H. and De Jong, R. 1999. A comparison of specific leaf area, chemical composition and leaf construction costs of field plants from 15 habitats differing in productivity.
New Phytologist 143: 163-176.
Sariyildiz, T. and Anderson, J.M. 2005. Variation in the chemical composition of green leaves and leaf litters from three deciduous tree species growing on different soil types.
Forest Ecology and Manageent 210: 303-319.
SAS Institute Inc. 2003. SAS/STAT Statistical software.
Version 9.1. SAS publishing Cary, NC.
Sardans, J., Frau, O., Chen, H.Y.H., Hanssens, I.A., Ciais, P., Piao, S. and Peñuelas, J. 2017. Changes in nutrient concentrations of leaves and roots in response to global change factors. Global Change Biology 23: 3849-3856.
Sato, T. 2004. Litterfall dynamics after a typhoon disturbance in a Castanopsis cuspidata coppice, southwestern Japan.
Annals of Forest Science 61: 431-438.
Smaill, S.J., Clinton, P.W. and Greenfield, L.G. 2008. Nitrogen fertiliser effects on litter fall, FH layer and mineral soil characteristics in New Zealand Pinus radiata plantations.
Forest Ecology and Management 256: 564-569.
Weetman, G.F. and Wells, C.G. 1990. Plant Analyses as an Aid in Fertilizing Forests. pp. 659-690. In : R.L. Westerman.
(Ed). 3rd Ed. In soil testing and plant analysis. SSSA, Wisconsin, USA.
Vose, J.M. and Allen, H L. 1991. Quantity and timing of needlefall in N and P fertilized loblolly pine stands. Forest
Ecology and Management 41: 205-219.
Yang, Y., Yanai, R.D., See, C.R. and Arthur, M.A. 2017.
Sampling effort and uncertainty in leaf litterfall mass and nutrient flux in northern hardwood forests. Ecosphere 8:
e01999.
Manuscript Received : January 25, 2019 First Revision : March 4, 2019 Accepted : March 5, 2019