NCAM-LAMP를 이용한 고해상도 일단위 기상기후 DB 구축:
일조시간 자료를 중심으로
이수정
1
, 이승재1
*, 구자섭2
1)1
국가농림기상센터,2
㈜제이비티(2020년 9월 1일 접수; 2020년 9월 26일 수정; 2020년 9월 28일 수락)
Database Construction of High-resolution Daily Meteorological and Climatological Data Using NCAM-LAMP: Sunshine Hour Data
Su-Jung Lee
1
, Seung-Jae Lee1*
, Ja-seob Koo2
1
National Center for Agro-Meteorology, Seoul, Korea2
JB Technology Co., Ltd., Seoul, Korea(Received September 1, 2020; Revised September 26, 2020; Accepted September 28, 2020)
ABSTRACT
Shortwave radiation and sunshine hours (SHOUR) are important variables having many applications, including crop growth. However, observational data for these variables have low horizontal resolution, rendering its application to related research and decision making on f arming practices challenging. In the present study, hourly solar radiation data were physically generated using the Land-Atmosphere Modeling Package (LAMP) at the National Center f or Agro- Meteorology, and then daily SHOUR fields were calculated through statistical downscaling. After data quality evaluation, including case studies, the SHOUR data were added to the existing publically accessible LAMP daily database. The LAMP daily dataset, newly updated with SHOUR, has been provided operationally as input data to the “Gyeonggi-do Agricultural Drought Prediction System,” which predicts agricultural weather disasters and field crop growth status.
Key words: Shortwave radiation, Sunshine hour, Statistical downscaling, LAMP
I. 서 론
태양 복사 중 지표면에 도달하는 양과 시간은 지표 면 에너지 수지에 있어서 근원적인 에너지로서 현열과 잠열 및 지중열 등으로 분산되어 흩어지는 가운데 지 표면 식생 등의 생물권에 지대한 영향을 미친다. 일사 량과 일조시간은 작물의 수확량과 품질에 큰 영향을 주는 중요한 기상 및 기후변수로서 생육 모델 등에 필수 인자로 고려되고 있으며(Chung et al., 2013;
Kim and Yun, 2015; Song et al., 2009; Teh, 2006), 최근에는 탈원전 산업과 관련하여 태양광 시설 부지를 결정하고 운영하는 데에도 사용된다(Jo et al., 2011; Jo et al., 2012; Shin et al., 2017; L ee et al., 2020). 지표에 닿는 태양 복사는 지형의 특성은 물론 안개, 운량 및 운형이나 운정 고도(Jung et al., 2011; Matuszko, 2012), 오염물질의 농도(Chang and Park, 2004; Liu et al., 2016; Pandithurai et al., 2008; Park et al., 2005) 등 대기에 의해 큰 영향을 받기 때문에, 일조시
* Corresponding Author : Seung-Jae Lee ([email protected])
ⓒ Author(s) 2020. CC Attribution 3.0 License.
간의 변동이나 일조 부족이 일어나는 양상은 임의적인 성격을 띠며 일사를 측정하거나 계산하는 도구에 대개 의존한다.
국내에서 일사량 변수를 측정하는 관측망은 기상청 의 종관기상관측(ASOS), 농업기상관측(AAOS), 농촌 진흥청의 기상관측 지점으로 이루어져 있는데(Zo et al., 2010; Choi et al., 2015; Shim et al., 2015) 기온, 바람 등의 변수를 측정하는 관측 지점 개수에 비하여 수평 해상도가 상대적으로 낮아서 일조시간 관측공백 지역에서의 영농 활용에 어려움이 있다. 일부 연구자 들은 위성 자료로부터 일조 시간을 도출하는 방법을 고안하였고(Good, 2010; Journée et al., 2013;
Kandirmaz, 2006; Kothe et al., 2013; Yu et al., 2016), Kim and Yun(2015)은 기상청 동네예보의 하늘상태 자료로부터 운량, 일사량과 일조시간을 추정하는 관계
식을 대안으로 제시하였다. 그러나 위성 관측 자료를 이용한 추정은 시간 지연이 발생하고(Kim and Yun, 2015), 동네예보는 수평 해상도가 5km 수준에 불과하 며 예보 기간도 2∼3일로 짧기 때문에 국지 지역의 일조시간 정보를 충분히 사전에 이용하기에는 다소 어 려움이 있다. 따라서 일사 관측공백 지역에 대해서는 고해상도 수치모델 자료를 활용하는 것이 한 대안이 된다.
우리나라의 경우 남한 지역 농림업 지원을 위하여 1km 미만의 고해상도로 일조시간 정보를 정기적으로 제공하는 시스템의 개발은 미진한 실정이다. 근래에 국가농림기상센터는 수요자 맞춤형 농림기상 지원을 위하여 농림생태계 지역에서의 중⋅장기적인 기상/기 후 정보 뿐만 아니라, 응용 모델과 효과적으로 결합되 어 대상 지역에 대한 고해상도 의사결정 정보를 지자
(a)
(b)
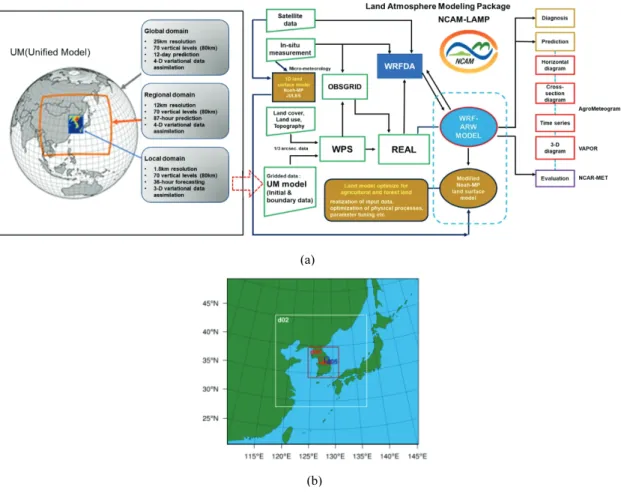
Fig. 1. (a) Framework of the National Center for AgroMeteorology-Land-Atmosphere Modeling Package (NCAM-LAMP) using UM global data. (b) Nested domain configuration used in the NCAM-LAMP (v1.6) medium-range prediction system.
체와 개별 농가들에게 제공해 줄 수 있는 지면대기모 델링패키지인 LAMP (Land-Atmosphere Modeling Package) 를 구축하였다(Lee et al., 2016). 본 연구에 서는 기상청 전지구 통합 수치예보모델(UM; Unified Model)을 기반으로 LAMP에서 고해상도 시간단위 일 사 자료를 생산하고, 이를 바탕으로 경기도 지역 일단 위 일조시간을 산출 및 DB화하여 농업 가뭄 및 밭 작물 생육 예측에 적용한 사례를 소개하고자 한다.
II. 자료 및 방법
2.1. LAMP 시간단위 자료
LAMP 안에는 수요자 맞춤형 영농영림 지원 전용 의 ‘810m 고해상도 수치모델링시스템’이 하나의 큰 축으로 들어가 있으며, 국가농림기상센터가 2016년에 처음 구축한 이후 현재까지 지속적으로 개선되고 있는 현업 운영 시스템이다. LAMP의 결과물은 농림지 물 사용 예측(Shin et al., 2017), 산사태 예측(Kwak et al., 2018) 등 농림업 분야의 연구와 교육 및 서비스 개발에 활용되고 있다. LAMP의 고해상도 중기예측은 WRF v3.6.1을 기반으로 하며, 지면모델은 식생의 이 산화탄소의 역학을 고려하는 Noah-MP (Niu et al., 2011)를 채택하고 있다(Fig. 1a). LAMP는 30초 해상 도의 USGS (United States Geological Survey) 지형 및 토지피복 자료와 1/3초 해상도의 환경부 토지피복 자료를 장착하고 있고, 전지구 및 지역 격자모델 예측
자료를 초기 및 경계자료로 사용하며, 다중 양방향둥 지격자 기반의 도메인을 구성하고 있다(Lee et al., 2016). Fig. 1b에서, d04, d05 등 810m 해상도 도메인 은 연구 및 서비스 대상지에 대해 추가적으로 생성되 어 왔으며, 중기예측의 경우 기상변수, 토양변수, 식생 변수 등을 최장 12일까지 1시간 단위로 표출하고 있다.
2.2. L AMP 일단위 자료산출
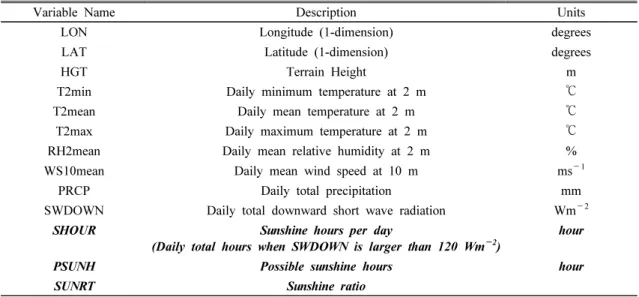
작물 모델 등 농림업 분야의 응용 모델들은 1일 단 위의 기상 입력 자료 형태를 요구하는 경우가 많다 (Ban et al., 2017; Cho and Yun, 1999; Jones et al., 2003; Seo et al., 2012). 최근에 Hong et al. (2020)은 미국 기상청의 FNL 자료를 기반으로 한 LAMP의 일 단위 순복사, 강수, 최저/최고/평균 기온, 풍속, 상대습 도 자료를 이용하여 농장 규모의 농업 가뭄을 특정 짓는데 사용한 바 있다. 본 연구에서는 한국 기상청의 UM 자료를 기반으로 한 LAMP를 이용하여 경기도 지역을 전체적으로 포함할 수 있는 d03 자료로부터 Hong et al. (2020)에 응용된 기상 변수에 대한 일단위 자료는 물론, 추가적으로 일조시간(sunshine hour), 가 조시간(possible sunshine hour), 일조율(sunshine ratio) 자료를 810m 수준 해상도로 생성하였다.
LAMP 중기예측 d03 자료는 1시간 간격의 시간해 상도와 2430m의 공간 해상도로 이루어져 있다. 일단 위 기상 변수 및 일조시간 자료는 LAMP v1.6 업데이 트 이후인 2017년 9월부터 현재까지 준실시간으로 생
Variable Name Description Units
LON Longitude (1-dimension) degrees
LAT Latitude (1-dimension) degrees
HGT Terrain Height m
T2min Daily minimum temperature at 2 m ℃
T2mean Daily mean temperature at 2 m ℃
T2max Daily maximum temperature at 2 m ℃
RH2mean Daily mean relative humidity at 2 m %
WS10mean Daily mean wind speed at 10 m ms
-1
PRCP Daily total precipitation mm
SWDOWN Daily total downward short wave radiation Wm
-2
SHOUR Sunshine hours per day
(Daily total hours when SWDOWN is larger than 120 Wm
-2
) hourPSUNH Possible sunshine hours hour
SUNRT Sunshine ratio
Table 1. Description of variables in LAMP daily dataset
성되고 있다. LAMP d03 결과는 ARWpost 프로그램 을 이용하여 격자 형식 데이터로 변환 후, Grid Analysis and Display System (GrADS)의 regrid 보간 기법을 이용하여 810m 수준의 해상도로 통계적 다운 스케일링 되었다. 경기도를 커버하는 지역은 위도 36.883˚∼38.285˚N, 경도 126.366˚∼127.85˚E로 설정 하였다.
WMO에 따르면, 1981년 이전에는 일조시간의 임 계값이 210Wm
-2
였으나 그 해 WMO의 기상측기 및 관측법위원회(CIMO)에서 120Wm-2
로 변경되었다 (Iqbal, 2012; Michalsky, 1992). 따라서 본 연구에서 일조시간은 하루 중 정시 하향단파복사가 120Wm-2
을 초과하는 시간을 계산하여 추출 및 일 자료로 가공하 였다(Fita et al., 2019; WMO, 1996). 가조시간은 오전 부터 오후까지 정시 하향단파복사가 나타나는 총 시 간, 그리고 일조율은 가조시간에 대한 일조시간의 비 율로 정의되었으며, 제공되는 변수들의 단위 및 설명 은 Table 1에 정리하였다. Fig. 2는 정시 일사량으로부 터 계산된 경기도 지역의 일일 일사량 예측 분포 예시 이며, Fig. 3은 일일 일조시간 예측 분포 예시를 나타 낸다.III. DB 접근, 품질관리 및 활용
3.1. 파일 제공
현재 LAMP의 중기예측 모델은 주 2회 화요일과 토요일에 구동되기 시작하며, 결과물의 1차 가공 자료 는 각각 목요일과 월요일에 생성되어 국가농림기상센 터의 전산 시스템 서버 내에 LAMP 초기 시각 별 디렉 토리(yyyymmdd)로 저장된다. LAMP는 국제 표준시 (UTC)를 기준으로 초기시각으로부터 12일 예측을 하 고 있으나, 디렉토리 내 제공되는 자료는 한국 표준시 (KST)를 기준으로 하므로, 두 기준의 시간차를 고려하 여 11일치 예측 자료를 제공한다. 파일명은 공통적으 로 ncam_lamp_fcst_810m_GGD_daily_${yyyy}-${mm}-
${dd}를 따른다. 하나의 디렉토리 당 11개의 일단위 예측 자료가 존재하고, 각 파일마다 가공된 기상 변수 를 포함하고 있다. 제공되는 자료는 NetCDF 형식의 binary 파일이며, 파일 내 변수는 2차원(LAT 192 x LON 162)의 double 형식 격자 자료다. 이 자료는 [email protected]로 자료 요청 이메일을 보내거 나, LAMP 홈페이지(http://df.ncam.kr/lamp/index.do) 의 ‘자료 신청’ 메뉴에서 신청 양식을 제출하면 접근하
여 다운로드 받을 수 있다.
3.2. 품질 평가
Fig. 4a는 강수 시스템이 두 차례 나타난 사례의 경 기도 이천 지역 예측 강수량, 일사량, 일조시간과 기상 청 ASOS에서 관측된 강수량을 표현한다. 5월 9일의 강수는 LAMP 예측 강수량과 관측값이 거의 유사했으
Fig. 3. Same as Fig. 2 except for sunshine hours.
Fig. 2. Daily total incoming shortwave radiation (Wm
-2
) from the NCAM-LAMP 11-day prediction dataset.나, 5월 15일의 강수는 LAMP가 하루 일찍 예측한 것 으로 나타났다. 사례 기간 동안 LAMP의 일단위 일사 량은 강수량과 음의 상관관계(-0.936)가 존재하며, 강 수 사례의 일사량 감소가 일조시간에도 영향을 주는 것으로 나타났다. 모델의 일조시간은 관측에 비해 길 게 나타났으며(Fig. 4b), 이는 LAMP 자료의 시간 간 격이 1시간 단위인 반면, 기상청 지상관측대 일조계로 계산된 일조 누적 시간은 분 단위 이하까지 반영하는 데에서 주로 발생한 차이로 분석된다(KMA, 2016). 강 수량 결과와 마찬가지로 5월 14-15일 기간의 일조시 간 또한 LAMP와 관측 사이의 시간 지연이 발생하며, 그 이전까지는 일조시간 변동에 대한 LAMP 예측 결 과와 관측 결과의 경향이 비슷하게 나타나는 것을 알
수 있다.
LAMP가 주 2회 구동되며 누적된 일 자료들을 초기 시각을 기준으로 이어가면 한 달, 일 년 등의 연속된 데이터를 생성할 수 있다. Fig. 5는 경기도 이천 지역 에 대한 2019년 1년치 LAMP 자료의 월 평균 가조시 간, 일조시간, 일조율, 일사량과 월 누적 강수량을 나 타낸다. 일조시간은 6월(12월)에 최장(최단)값을 보이 며, 가조시간에 비해 2∼3시간 가량 짧게 나타났다.
일조율은 0.8 주변에서 연중 진동하며, 최대와 최소는 일조시간과 마찬가지로 6월과 12월에 각각 나타났다 (Fig. 5a). 강수와 구름의 영향이 많은 기간(예를 들어, 장마, 태풍 기간 등)에 일조율이 감소하는 경향도 잘 보인다. Kwon et al. (2010)는 한국의 평년(1971∼
Fig. 4. (a) Sunshine hours (black), daily shortwave radiation (orange), and daily precipitation (blue bar) from NCAM-LAMP prediction and daily precipitation (red bar) from ASOS observation at Icheon, Gyeonggi, Korea.
(b) Comparison of sunshine hours between NCAM-LAMP and ASOS observation.
2000) 일사량이 장마 기간과 태풍 시즌에 상당히 감소 하는 것을 보였는데, 본 자료에서도 5월부터 8월까지 의 긴 가조시간에 비해 7월의 일사량은 현저히 낮은 모습을 보이며 9월에도 많은 강수량으로 인해 일사량 이 감소하였다(Fig. 5b).
이상의 결과들을 볼 때, LAMP의 일단위 일사 자료 및 일조시간 가공자료는 일사 관측공백 지역에 대한 대체 자료로 사용될 수 있을 것으로 사료되며, 추후 모델 운량의 고려와 일조시간 문턱값 보정 등에 대한 품질관리 기법 개발을 통해 자료 정확도 개선을 지속
적으로 수행해 나갈 계획이다.
3.3. 활용 사례
경기도는 도내 31개 시군의 가뭄을 예측하고 농업 가뭄 관련 통합 정보를 제공하는 ‘경기도 농업가뭄 정 보시스템(https://insight.gg.go.kr/drought/)’을 현재 서 비스로 운영 중이다. 기상청, 농촌진흥청, 농어촌공사, 수자원공사, 국가농림기상센터 등 15개 기관에서 수 집된 기상자료, 토양, 작물, 수자원 시설 등 농업 가뭄 관련 66종의 빅데이터를 활용하여 각종 기상정보, 시 Fig. 5. (a) Monthly averaged possible sunshine hours (blue bar), sunshine
hours (yellow bar), and sunshine ratio (black line). (b) Monthly averaged downward shortwave radiation (red line) and monthly total precipitation (black bar) from the NCAM-LAMP prediction for Icheon, Gyeonggi, Korea, in 2019.
설물 정보, 토양 정보, 가뭄 분석 결과 등을 필지별로 시각화하여 제공한다. 이 서비스는 과학기술정보통신 부 사업결과 평가회에서 ‘최우수’로 선정되었다.
Fig. 6은 LAMP로부터 계산된 일단위 최저/최고 기 온, 풍속, 강수, 일조시간 등의 데이터가 이 시스템의 기상입력 자료로 제공되고 있는 모습을 보여주는 그림 이다. 당시 태풍 마이삭에 의해 우리나라가 영향을 받 으면서 경기도 지역이 2020년 9월 3일을 중심으로 바 람과 강수량이 증가하고 기온이 하강하며 일조시간이 줄어드는 상황을 예측하고 있다. 해당 시스템은 작물 별로 저온해 및 고온해 등 시기별 대비해야 할 기상재 해 정보도 제공하고 있으며, 농민이 자신의 경작지와 작물을 등록하면 기상재해 분석을 통한 가뭄 분석 결 과와 기상 정보를 확인할 수 있다.
LAMP에서 생산된 고해상도 격자형 일단위 기상자 료를 농업, 임업, 축산 분야 등의 각종 모델들과 연결 함으로써, 국민과 지자체를 대상으로 하는 더욱 더 다 양한 빅데이터 응용 연구와 서비스가 앞으로 가능할 것이다.
적 요
단파 복사와 일조시간은 농작물 재배에 중요한 변 수들이다. 그러나 국내에서 제공되는 일사 관측 자료 는 수평 해상도가 높지 않아 농업 현장에 활용하기 어렵다. 본 연구에서는 지면대기모델링패키지(LAMP) 를 이용하여 시간단위 일사 자료를 물리역학적으로 생 산하고, 통계적 다운스케일링을 통해 고해상도 일단위 기상기후 DB를 구축하였다. 현재 이 DB는 품질 평가 를 거쳐 농업가뭄 재해와 밭작물의 생육 현황을 진단 하고 예측하는 ‘경기도 농업가뭄 예측시스템’의 공식 빅데이터 입력 자료로 활용되고 있다.
감사의 글
본 연구는 한국정보화진흥원 데이터 플래그십 사업, 농촌진흥청 연구사업 ‘미세먼지에 의한 농작물 생산피 해 예측 및 평가기술 개발’ (세부과제번호: PJ014189 032019),농림식품기술기획평가원 농촌현안해결 리빙 Fig. 6. Operational use of LAMP daily dataset in the Gyeonggi-do Agricultural
Drought Prediction System (https://insight.gg.go.kr/drought) in Korea
랩 프로젝트 사업(120099-03)의 지원들을 받아 이루 어진 것입니다.
REFERENCES
Ban, H.-Y., D.-H. Choi, J.-B. Ahn, and B.-W. Lee, 2017: Predicting regional soybean yield using crop growth simulation model. Korean Journal of Remote Sensing 33(5_2) 699-708.
Chang, L.-S., and S.-U. Park, 2004: Direct radiative forcing due to anthropogenic aerosols in East Asia during April 2001. Atmospheric Environment 38(27), 4467-4482.
Cho, K. S., and J.-I. Yun, 1999: Regional crop evaluation and yield forecast of paddy rice based on daily weather observation. Korean Journal of Agricultural and Forest Meteorology 1(1), 12-19.
Choi, S. W, S.-J. Lee, J. Kim, B. L. Lee, K. R.
Kim, and B. C. Choi, 2015: Agrometeorological observation environment and periodic report of Korea Meteorological Administration: Current status and suggestions. Korean Journal of Agricultural and Forest Meteorology 17(2), 144-155.
Chung, N., C. Kim, T. Oh, C. Hong, and W. Jang, 2013: Development of a knowledge-based crop recommendation model for precision agriculture.
The Journal of the Korean Society of International Agriculture.
Fita, L., J. Polcher, T. M. Giannaros, T. Lorenz, J.
Milovac, G. Sofladis, E. Katragkou, and S. Bastin, 2019: CORDEX-WRF v1. 3: development of a module for the Weather Research and Forecasting (WRF) model to support the CORDEX community.
Good, E., 2010: Estimating daily sunshine duration over the UK from geostationary satellite data.
Weather 65(12), 324-328.
Hong, M., S. H. Lee, S.-J. Lee, and J.-Y. Choi, 2020: Application of high-resolution meteorological data from NCAM-WRF to characterize agricultural drought in small-scale farmlands based on soil moisture deficit. Agricultural Water Management.
Iqbal, M., 2012: An introduction to solar radiation.
Elsevier.
Jo, D.-K., C.-Y. Yun, K.-D. Kim, and Y.-H. Kang, 2011: A detail survey of horizontal global radiation and hours of bright sunshine for the installation of solar photovoltaic system in Korea. Journal of the Korean Solar Energy Society 31(3), 48-56.
Jo, D.-K., C.-Y. Yun, K.-D. Kim, and Y.-H. Kang, 2012: A study on the estimating solar radiation in
Korea using cloud cover and hours of bright sunshine. Journal of the Korean Solar Energy Society 32(2), 28-34.
Jones, J. W., G. Hoogenboom, C. H. Porter, K. J.
Boote, W. D. Batchelor, L. A. Hunt, P. W. Wilkens, U. Singh, A. J. Gijsman, and J. T. Ritchie, 2003:
The DSSAT cropping system model. European journal of agronomy 18(3-4), 235-265.
Journée, M., C. Demain, and C. Bertrand, 2013:
Sunshine duration climate maps of Belgium and Luxemb ourg b ased on Meteosat and in-situ ob servations.
Advances in Science and Research 10(1), 15-19.
Jung, Y., H. K. Cho, J. Kim, Y. J. Kim, and Y. M.
Kim, 2011: The effects of clouds on enhancing surface solar irradiance. Atmosphere 21(2), 131-142.
Kandirmaz, H., 2006: A model for the estimation of the daily global sunshine duration from meteorological geostationary satellite data. International Journal of Remote Sensing 27(22), 5061-5071.
Kim, S.-O., and J. I. Yun, 2015: Improving the usage of the Korea Meteorological Administration’s digital forecasts in agriculture: IV. Estimation of daily sunshine duration and solar radiation based on ‘Sky Condition’ product. Korean Journal of Agricultural and Forest Meteorology 17(4), 281- 289.
KMA, 2016: Ground weather observation guidelines.
49pp.
Kothe, S., E. Good, A. Obregón, B. Ahrens, and H.
Nitsche, 2013: Satellite-based sunshine duration for Europe. Remote Sensing 5(6), 2943-2972.
Kwak, J. H., M. I. Kim, and S.-J. Lee, 2018:
Landslide susceptibility assessment considering the saturation depth ratio by rainfall change. The Journal of Engineering Geology 28(4), 687-699.
Kwon, H., J. Kim, J. Hong, and J. Lim, 2010:
Influence of the Asian monsoon on net ecosystem carbon exchange in two major ecosystems in Korea. Biogeosciences 7(5), 1493-1504.
Lee, S. I., J. Y. Choi, S. J. Sung, S.-J Lee, J. Lee, and W. Choi, 2020: Simulation and analysis of solar radiation change resulted from solar-sharing for agricultural solar photovoltaic system. Journal of the Korean Society of Agricultural Engineers 62(5), 63-72.
Lee, S.-J., J. Song, and Y.-J. Kim, 2016: The NCAM Land-Atmosphere Modeling Package (LAMP) Version 1: Implementation and evaluation. Korean Journal of Agricultural and Forest Meteorology 18(4), 307-319.
Liu, L., X. Huang, A. Ding, and C. Fu, 2016:
Dust-induced radiative feedbacks in north China:
A dust storm episode modeling study using WRF- Chem. Atmospheric Environment 129, 43-54.
Matuszko, D., 2012: Influence of cloudiness on sunshine duration. International Journal of Climatology 32(10), 1527-1536.
Michalsky, J., 1992: Comparison of a National Weather Service Foster sunshine recorder and the World Meteorological Organization standard for sunshine duration. Solar energy 48(2), 133-141.
Niu, G. Y., Z. L. Yang, K. E. Mitchell, F. chen, M.
B. Ek, M. Barlage, A. Kumar, K. Manning, D.
Niyogi, E. Rosero, M. Tewari, and Y. Xia, 2011:
The community Noah land surface model with multiparameterization options (Noah‐MP): 1. Model description and evaluation with local‐scale measurements.
Journal of Geophysical Research: Atmospheres 116(D12).
Pandithurai, G., S. Dipu, K. K. Dani, S. Tiwari, D.
S. Bisht, P. C. S. Devara, and R. T. Pinker, 2008: Aerosol radiative forcing during dust events over New Delhi, India. Journal of Geophysical Research: Atmospheres 113(D13).
Park, S.-U., L.-S. Chang, and E.-H. Lee, 2005:
Direct radiative forcing due to aerosols in East Asia during a Hwangsa (Asian dust) event observed on 19-23 March 2002 in Korea. Atmospheric Environment 39(14), 2593-2606.
Seo, M.-C., S.-O. Hur, Y.-K. Sonn, H.-S. Cho, W.-T. Jeon, M.-K. Kim, and M.-T. Kim, 2012:
The development of estimation model (AFKAE0.
5) for water balance and soil water content using daily weather data. Korean journal of soil science and fertilizer 45(6), 1203-1210.
Shim, K. M., Y. S. Kim, M. P. Jung, I. T. Choi,
and K. H. So, 2015: Status of agrometeorology monitoring network for weather risk management:
Focused on RDA of Korea. Journal of Climate Change Research 6(1), 55-60.
Shin, D.-H., J.-H. Park, and C.-B. Kim, 2017:
Photovoltaic generation forecasting using weather forecast and predictive sunshine and radiation. The Journal of Advanced Navigation Technology 21(6), 643-650.
Shin, Y. H., J. Y. Choi, S.-J. Lee, and S. H. Lee, 2017: Estimation of irrigation requirements for red pepper using soil moisture model with high resolution meteorological data. Journal of the Korean Society of Agricultural Engineers 59(5), 31-40.
Song, Y.-Y., M.-Y. Park, S.-J. Yang, and D.-H.
SaGong, 2009: Influence of air temperature during midsummer on fruit sunburn occurrence in’Fuji’/M.
9 apple tree. Korean Journal of Agricultural and Forest Meteorology 11(4), 127-134.
Teh, C. B., 2006: Introduction to mathematical modeling of crop growth: How the equations are derived and assembled into a computer model.
Dissertation. com.
WMO, 1996: Guide to meterological instruments and methods of observation. Secretariat of the World Meteorological Organization.
Yu, J. J., J. Park, and D.-H. Jang, 2016: Estimating distribution of sunshine duration using COMS satellite images. Journal of Climate Research 11(4), 343- 356.
Zo, I. S., J. B. Jee, W. H. Lee, K. T. Lee, and Y.
J. Choi, 2010: Distribution of surface solar radiation by radiative model in South Korea.
Climate Change Research 1(2), 147-161.