IEG 환경지질연구정보센터
11
0
0
전체 글
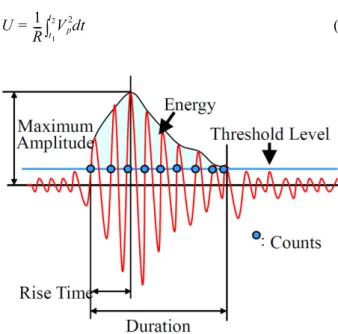
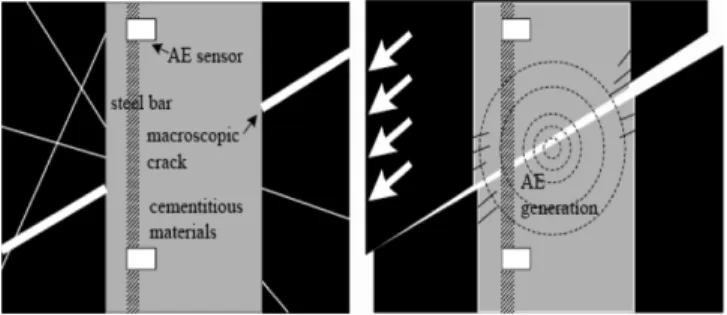
(2) 436. Yo-Seph Byun, Myung Sagong, Suk-Chun Kim, Byung-Sik Chun, Seong-Yong Park, and Hyuk-Sang Jung. Now, most previous studies on the slopes were carried out using geophones or accelerometers instead of AE sensors (Guglielmi et al., 2008; Senfaute et al., 2009; Amitrano et al., 2010; Got et al., 2010). Only a few studies on slopes have been carried out using AE sensors (Koerner, 1978; Nakajima, 1988; Shiotani et al., 2001; Shiotani, 2006; Cheon et al., 2011). This study aims to investigate the application of AE techniques in the field. And to propose a criterion for damage level based on a laboratory test. This criterion was applied to a real rock slope to evaluate its stability during rainfall. 2. BACKGROUND 2.1. AE Signal Parameters An AE signal is analyzed using parameters such as the count, event, amplitude, rise time, duration, and energy. Figure 1 shows AE signal parameters. To evaluate the AE source, the relationship between the number of AE events and the amplitude is statistically represented. The count represents occurrence of cracks, which exceed a threshold and is used for examining the number of AE occurrences. An event is the basic unit of a wave, and it is used for plotting the original position of the AE. The maximum amplitude refers to the maximum value of the signal that indicates the level of cracking. The duration refers to the time required when an AE signal exceeds the threshold. The rise time refers to the time required for an AE signal exceeding the threshold value and reaching to the maximum amplitude. The energy refers to the area of the envelope with AE signal exceeding a threshold level; it can be calculated as follows: 1 t 2 U = --- ∫ t2 V p dt R 1. Fig. 1. AE signal parameters (Tomoda and Ohtsu, 2008).. (1). where R is the electrical noise, Vp is the amplitude of a wave as a function of time, t1 is the starting time of an AE signal, and t2 is the ending time of the AE signal. The improved b-value (Ib-value) and the grade are parameters that are used to identify the failure process of a material. The Ib-value can be used to predict the time when slope failure occurs. In seismology, the b-value can be obtained from seismic data for certain areas and periods. For AE, the b-value can be estimated from the distribution of the amplitude frequency. AE requires much lesser time to estimate the b-value compared to the seismic data. Therefore, it is necessary to generalize the amplitude parameter and range; this requires the use of the Ib-value, which considers the statistical data of the amplitude distribution. The mathematical form of Ib-value is given as follows: log10 N ( w1 ) – log10 N ( w2 ) Ib = -------------------------------------------------------( α1 + α2 )σ. (2). where N(w1) is the accumulated number of AE events in which the amplitude is greater than µ−α1σ, N(w2) is the accumulated number of AE events in which the amplitude is greater than µ + α1σ, µ is the mean amplitude, and σ is the standard deviation. α1 and α2 are empirical constants. The grade is the parameter indicating the early gradient of AE signal in the rock mass, which can be obtained from AE amplitude and the rise time of AE wave. AE parameter evaluating the rock stability and providing the occurrence of tensile and shear failures. These two parameters had been successfully used to evaluate rock slope stability (Shiotani, 2006). 2.2. Concept of Waveguide A waveguide is a slope-monitoring apparatus for measuring undamped AE signals that occur in rocks. In previous studies, a slope-monitoring apparatus that uses a waveguide to reduce damping in AE signal monitoring has been developed (Shiotani et al., 2001; Shiotani, 2006; Dixon & Spriggs, 2007). From the monitored date the AE wave parameters can be calculated and used for assessing the progress of slope failure and the slope stability. The requirements for AE measurements are as follows: AE should be detected without any influence on the cracking in the rocks; the failure inside the rocks has to be evaluated reasonably; and a continuous AE wave ranging from local failures to failures inside the global rock masses has to be detected and evaluated. Shiotani (2006) developed WEAD (Waveguide for AE waves due to Deformation), composed of cementitious materials and reinforced steel, as shown in Figure 2. Reinforces steel bar attaching AE sensors was inserted in a borehole and filled with cementitious material like cement paste to fill the hole. This process provides good contact.
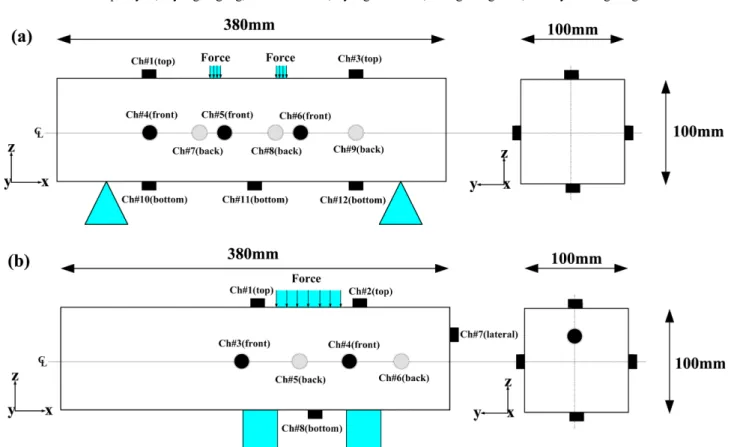
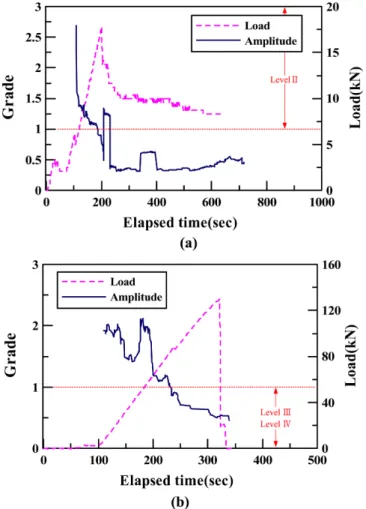
(3) A study on using acoustic emission in rock slope with difficult ground – focused on rainfall. 437. by shear or flexural failure. Therefore, bending and shear tests were carried out on a specimen which has similar bonding characteristics and tensile strength with rock material in the field. From the test the damage levels were determined by analyzing the AE signals when the specimen fails. 3. LABORATORY TESTS 3.1. Specimen and Test Method. Fig. 2. Waveguide in rock (after Shiotani et al., 2001).. with in situ rock mass and AE sensors. When an AE wave is emitted, the filling in the installed WEAD also develops macroscopic cracks. The steel bar was employed to guide the AE signal which generated from the rock masses. The emitted AE wave is detected by the AE sensors installed along the steel bar. The detected AE is the first-dimension AE source, which shows the distribution of cracks in the rocks around the borehole. The 1D source location is then set to estimate the AE source by considering the arrival time difference (∆t) of elastic waves detected by two or more sensors. Assume that an AE occurs between two AE sensors in the 1D source location, the AE source location is x, and the location of the two sensors is x1 and x2. The time required for an AE wave to reach the sensor after the AE occurs is t1 and t2 and the arrival time difference between sensors is ∆t12 = t1 – t2. The mathematical form of the source location can be represented in Equation (3). Therefore, if the AE source and sensor location are given identification of the AE source location x is possible. C∆t12 = x – x1 – x – x2. (3). where C is the velocity of the P-wave. In this study, we develop a monitoring apparatus similar to that developed by Shiotani (2006), and apply it for filed monitoring. The main advantage of this apparatus is that it allows determination of the AE sources location and it calculates the time to final failure by analyzing the shape of stress (bending or shear) at that point. 2.3. Assessment Method for Damage Levels Once an AE signal is monitored with generation of a crack inside rock mass, the failure mechanism can be evaluated through an AE analysis. At this time, it is necessary to identify the number of AE event and to relate it to slope failure, which is called the damage level. The damage level parameter is AE parameters the criteria for classifying fracture states and this damage level is from the laboratory test such as four points bending and shear tests. The cracking in a rock slope is results of complex process. It may caused. A laboratory test was carried out to set the criteria of the damage level which can be applicable for in situ monitoring. The damage levels were determined from the AE signals which were generated during the bending and shear tests. Specimens with dimensions of 100×100×380 mm were made of cement paste (water to cement ratio of 50%) containing a steel bar down the center. The bending test and shear test were carried out after 28-days of water curing. The sounds occurring during the failure process were recorded, and the characteristics at each failure stage were classified. The bending test used 12 AE sensors while the shear test used 8 sensors. The sensor arrangement on the specimen is shown in Figure 3. 3.2. Test Results 3.2.1. Count Figure 4 shows the AE signal count and load obtained from a bending test and a shear test. In the bending test, the load curve gradually increased until sample failure occurred at approximately 110 s. At this time, the value of the count is 35, and a count below 35 indicated an early stage of flexural failure, which was classified as damage level I. A count between 35 and 65 was the range in which a flexural failure turns into a shear failure, which was classified as damage level II. A count between 65 and 100 indicates that shear failure was beginning, while a count over 100 indicated that shear failure has occurred. These count values were classified as damage levels III and IV, respectively. 3.2.2. Energy Figure 5 shows the energy and load monitored from a bending test and a shear test. In the bending test, the sensors began to detect energy approximately 110 s into the test. The energy level tended to decline sharply and increase again during the remainder of the bending test. At 110 s, the energy was 50, and therefore, 50 can be classified as the level at which specimen fails. Consequently, energy level 50 can be regarded as the initiation of flexural failure at which cracks could occur. This stage was classified as damage level I. In the bending test, data started to increase sharply at around 240 s when the energy was 150. An.
(4) 438. Yo-Seph Byun, Myung Sagong, Suk-Chun Kim, Byung-Sik Chun, Seong-Yong Park, and Hyuk-Sang Jung. Fig. 3. Specimen and AE sensors arrangement. (a) Bending test; (b) Shear test.. Fig. 4. Load and Counts. (a) Bending Test; (b) Shear Test.. Fig. 5. Load and Energy. (a) Bending Test; (b) Shear Test..
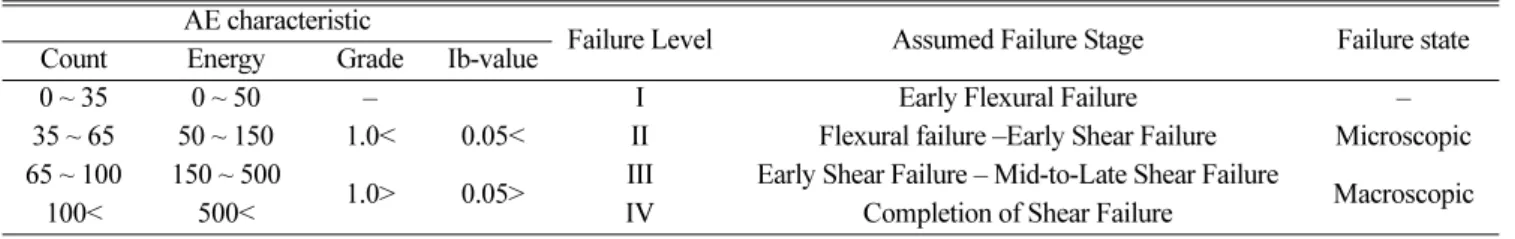
(5) A study on using acoustic emission in rock slope with difficult ground – focused on rainfall. 439. energy level between 50 and 150 indicates a flexural failure turning into a shear failure, and this stage was classified as damage level II. This was the final bending stage, and the incorporation and growth of cracks occurred after the initial crack. This stage was considered the early shearing stage during which the shear plane starts to condense in the specimen. Finally, once the energy level was over 150, the energy continuously increased, indicating a shift from the early phase of shear failure to the middle and late phases of shear failure, which increased until the load reached the maximum. This stage was classified as damage level III, where the cracks that occurred along the shear plane. When the energy level is over 500, shear failure was complete and this stage was classified as damage level IV. At this stage, a large scale of cracks was monitored. 3.2.3. Grade Figure 6 shows the result of the grades. In the bending test, the grade was reduced to 1.0 at 110 s and in the shear test, it was reduced to 1.0 or below at 180 s when shear failure occurred. With such a result, the grade was classified into damage level II and damage levels III and IV based on 1.0 as the boundary. While high grade was. Fig. 7. Load and Ib-value. (a) Bending Test; (b) Shear Test.. observed during the early stage of cracking when tensile cracks occurred, low grade was observed during the final stage when shear cracks occurred. Therefore, the grade can be used to classify the types cracks. 3.2.4. Ib-value Figure 7 shows the Ib-value. In the bending test, the Ibvalue appeared at approximately 0.05 during the failure process. The Ib-value in the shear test was 0.05 or less during shear failure. Therefore, the Ib-value was classified into damage level II and damage levels II and IV considering 0.05 as the boundary. An increase in the Ib-value indicates the cracks resulting from concentrated stresses and the occurrence of significant number of minor cracks; a decrease in the Ib-value indicates stress released condition and the occurrence of significant major cracks. 3.3. Criterion for Damage Levels. Fig. 6. Load and Grade. (a) Bending Test; (b) Shear Test.. Damage levels were suggested by analyzing the AE characteristics such as count, energy, grade and Ib-value, obtained from the laboratory tests. The damage levels at each stage are shown in Table 1. In applying the determined damage level to the field test, a failure level needs.
(6) 440. Yo-Seph Byun, Myung Sagong, Suk-Chun Kim, Byung-Sik Chun, Seong-Yong Park, and Hyuk-Sang Jung. Table 1. Criteria for damage levels Count 0 ~ 35 35 ~ 65 65 ~ 100 100<. AE characteristic Energy Grade 0 ~ 50 – 50 ~ 150 1.0< 150 ~ 500 1.0> 500<. Ib-value 0.05< 0.05>. Failure Level. Assumed Failure Stage. Failure state. I II III IV. Early Flexural Failure Flexural failure –Early Shear Failure Early Shear Failure – Mid-to-Late Shear Failure Completion of Shear Failure. – Microscopic. to be classified by the count and energy value. For example, when the count is 35 or more and the energy is 50 or more, it can be regarded as the initiation of flexural failure. When the Ib-value is 0.05 or more and the grade is 1.0 or less, it is considered to be indicative of microscopic failure. Conversely, when the Ib-value is 0.05 or less and the grade is 1.0 or more, it is considered a macroscopic failure. 4. APPLICATION OF AE MONITORING FOR ROCK SLOPE FAILURE AT IN SITU 4.1. Evaluate Field Application A field test was carried out to evaluate the applicability of the AE technique to rock slopes. The AE technique was applied to a slope that had previously collapsed and was. Fig. 8. Geological map of the study area.. Macroscopic. prone to further collapse. By identifying the tendency in a broad range, AE hits and AE events were analyzed; this was followed by an analysis of the AE characteristics in order to identify the tendency in detail. AE hits are AE signals measured at a single sensor, and they indicate the frequency of AE; however, AE hits cannot be compared with AE energy because the hits do not incorporate the scale of the AE wave. An AE event is the value measured for a single hit by two sensors at a time, and it is used for positioning the AE signal. The test site is a cut slope located in Dojik-ri, Okgyemyeon, Gangneung-si, Gangwon-do, Korea. This slope has previous records of collapse and has been partially reinforced; therefore, progressive collapse can occur. The site is categorized into the Pyungan supergroup, which was deposited during the Paleozoic Carboniferous and Permian.
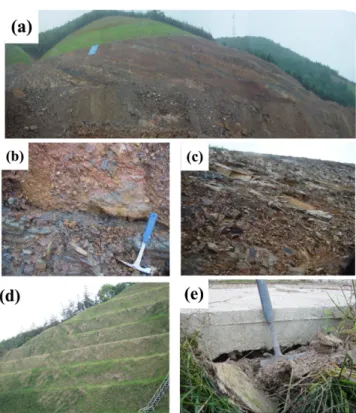
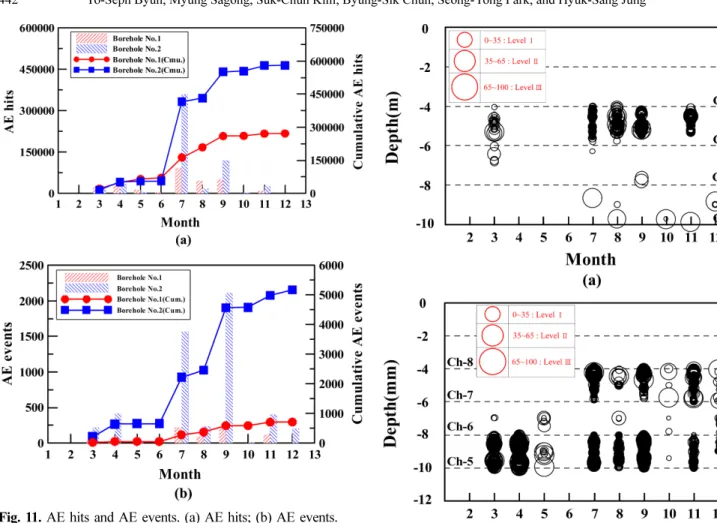
(7) A study on using acoustic emission in rock slope with difficult ground – focused on rainfall. 441. Fig. 10. AE sensor arrangement status.. Fig. 9. Before slope cutting and After slope cutting: (a) Slope view; (b) Coal seam; (c) Joint status; (d) Bulging phenomenon; (e) Differential settlement by bulging.. periods. The Hongjeom Series, Sadong Series, and Gobangsan Series are part of the Pyeongan supergroup, and limestone strata of Seokbyung are unconformably overlain by a Quaternary alluvial layer. Figure 8 shows the geological map of the study area. The slope is approximately 200 m in length and 50 m at the maximum height, and it has an inclination of 1:1.5 in soil areas and of 1:1.0 in ripping rock and blasting rock slope. As shown in Figure 9, there were coal seams or clay layers before the excavation of the slope. This resulted in the development of severe weathering and fractures. Thus, reinforcement was installed using FRP (Fiberglass Reinforced Plastic) reinforcement, and the upper part was resloped at an inclination of 1:1.5. Even after the installation of reinforcements and resloping, the slope surface was observed to bulge in some areas. Gradual collapse of the slope along its weak zones, such as the coal seams was found during the excavation.. sors at each borehole were installed, respectively, below a depth of 4 m. Sand was filled up to a depth of 2 m in order to block noises occurring on the slope surface. The most sensitive issue in AE measurements is related to damping. Therefore, the sensor spacing was set at 2 m interval to reduce damping effects. AE sensors were installed on a total of 8 channels below Ch-4 and Ch-8 at intervals of 2 m, and AE signals over 40 dB were monitored by a remote controller. It is impossible to set up a manned monitoring station on the slope cut at the side of an existing road that is under construction. Therefore, to safely download data obtained from the site and to monitor the situation in real time, wireless Internet was employed (using an AP device) to allow the monitoring of the site through the Web. The waterproofing AE sensors of PAC (Physical Acoustic Corporation) were employed. The dimension of the sensor is 33 m in diameter and 42 mm in height, and the operating frequency ranges is 35~100 kHz. Signals obtained from the test were measured using a Samos-8 System produced by PAC. Samos-8 is a multichannel computer system that measures AE signals and waves through its AE Win Program and saves and analyzes experimentally obtained AE data. The system consists of sensors, a pre-amplifier, cables, and a desktop PC. AE signals are detected by the AE sensors, converted to electrical signals, amplified by the pre-amplifier, and then measured and saved to the computer. To block noises produced by the power line, a noise cut transformer, which differs from a general transformer, was installed in the system.. 4.2. AE Sensor Arrangement 4.3. Measurement Results and Analysis Figure 10 shows the arrangement of the AE sensors (60 kHz) installed on the slope. There were two boreholes in the slope. They were located at the 20-m berm and the 40m berm from the ground. The depth of the borehole in the former was 10 m whereas that in the latter was 12 m. For the AE sensors in Borehole Nos. 1 and 2, four sen-. 4.3.1. AE signal analysis Figure 11 shows the cumulative number of AE hits and events in 2007. In Borehole No. 1, AE hits were drastically increased from June until September 2007, by approximately 190,000, indicated increasing AE activity during.
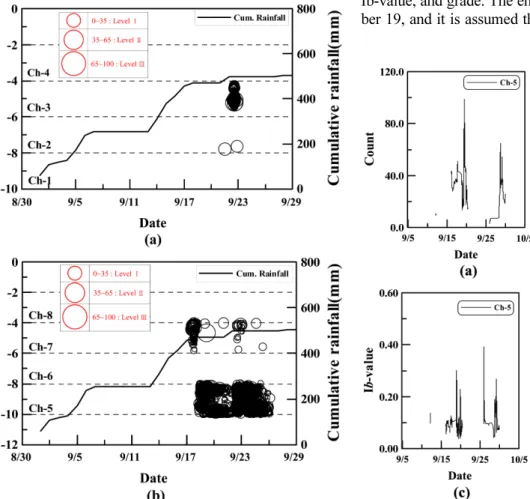
(8) 442. Yo-Seph Byun, Myung Sagong, Suk-Chun Kim, Byung-Sik Chun, Seong-Yong Park, and Hyuk-Sang Jung. Fig. 11. AE hits and AE events. (a) AE hits; (b) AE events.. this period. In Borehole No. 2, the number of AE hits reached as high as 360,000 between June and July, indicating active AE behavior that appeared to be attributable to movement inside the slope. The number of AE events peaked in July and September. In Borehole No. 1, 220 AE hits were recorded in July and in Borehole No. 2, 2,100, during September. When considering the number of AE hits and events, higher values were recorded in Borehole No. 2 than in Borehole No. 1, indicating more active AE behaviors in Borehole No. 2. It is assumed that the deformation occurred inside the slope because of the expansion of a crack due to the generation of surface bulging near the surface. According to 1D AE source locations as shown in Figure 12, a majority of AE events were recorded between Ch-3 and Ch-4 in Borehole No. 1, which is interpreted as a movement on an active slip plane at a depth interval between 4 and 6 m. Because the AE event was recorded by all sensors of Borehole No. 2, it is assumed that the local stress or deformation occurs near Borehole No. 2. The diameter of the circle reflects the scale of the count at the AE source location. Thus, it is assumed that the tensile failure occurring inside the slope is currently being converted to the shear failure because the AE event is of damage level 1 or 2.. Fig. 12. The result of 1D AE source location, where the central point of the circle is the signal occurrence point and the diameter of the circle reflects the scale of the count at the AE source location. (a) Borehole No. 1; (b) Borehole No. 2.. 4.3.2. Effect of rainfall One of the major factors which affect on the slope stability is rainfall. Rainfall infiltrates into soil and increases weight of the soil mass which acts as driving force for slope instability. The monitored slope has a soil layer above the rock masses and increased weight of soil mass can induced fracturing on rock masses (Abramson et al., 1996). In 2007, monthly rainfalls were recorded to exceed 100 mm four times, 300 mm two times, and 500 mm one time. The record high during the year, 503 mm/month, occurred in September. Thus, AE activities in relation to rainfall in September 2007 were further investigated in this study. Figure 13 shows AE hit rate during September in Borehole No. 2. AE hits occurred more than 13,000 times at Ch-5 on September 23 and approximately 16,000 times at Ch-8 on September 17. On September 23, the rainfall was 0.5 mm while the 3-day cumulative rainfall was 27.2 mm. On September 17, the rainfall was 45 mm while the 3-day cumulative rainfall was 158 mm. Based on this fact, it is.
(9) A study on using acoustic emission in rock slope with difficult ground – focused on rainfall. Fig. 13. AE hit rate during September in Borehole No. 2.. assumed that the sudden increase in AE hits was caused by the rainfall, especially by the cumulative rainfall. It is assumed that the accumulation of rainfall caused the formation of a saturated zone, and this affected the slope stability because of the increase in pore water pressure and seepage force. Therefore, the AE hit was verified to be affected by the cumulative rainfall among various rainfall. Fig. 14. The 1st dimension AE source location. (a) Borehole No. 1; (b) Borehole No. 2.. 443. factors that influenced the slope stability, and the cumulative rainfall had a very close relationship with the number of AE hits. Figure 14 shows the number of AE events that occurred and the source location of 1D AE. An AE event occurred when the rainfall continued and cumulated. It occurred 180 times at Borehole No. 1 on September 22 and 389 times at Borehole No. 2 on September 23. The figure also shows that the AE event was affected by the cumulative rainfall. AE events occurred more frequently at Ch-3 and Ch-4 in Borehole No. 1 and at Ch-5 and Ch-6 in Borehole No. 2, which indicated that more cracking was developed at these locations. However, the magnitude of these AE events was in the range from 35 to 65, which is categorized into level II, where no full-scale slope failure is likely developed. Using the detailed failure pattern identified, the failure AE parameters were evaluated by applying the damage level determined in the laboratory tests. It is important to determine the failure progress and the damage level in slope maintenance because these may provide very useful information for predicting slope failure. In the failure evaluation process, the analysis of Ch-5, which had greater number of events than other sensors, was conducted. Figure 15 shows the result of count, energy, Ib-value, and grade. The energy was generated on September 19, and it is assumed that the energy cumulated inside. Fig. 15. The result for the AE parameters. (a) Count; (b) Energy; (c) Ib-value; (d) Grade..
(10) 444. Yo-Seph Byun, Myung Sagong, Suk-Chun Kim, Byung-Sik Chun, Seong-Yong Park, and Hyuk-Sang Jung. the slope until it discharged on September 19. As with the energy, the count increased sharply on September 19, and it seemed to be affected by the discharge of energy. In particular, the result of the count directly shows the frequency of occurrence of the present state inside the slope, and it is assumed that the shear failure progresses inside the slope because the damage level is 3. The analysis result of Ibvalue and grade for determining the progress of slope failure shows that the value, which represented the start of failure, occurred on September 17. This was because 43% of the September rainfall occurred from September 14 to 19, and it caused the growth of tensile failure inside the slope and generated sliding. 5. CONCLUSIONS This study evaluated the applicability of AE techniques to slope failure prediction at actual sites. A slope with a history of collapse was considered. The conclusions obtained from this study are summarized as follows: (1) Damage levels were determined from the relationship between the AE characteristics and failures by conducting laboratory bending and shear tests. Slope behaviors were predicted quantitatively by comparing and analyzing these damage levels for the AE measured at actual sites. This indicates that AE techniques are reasonably applicable to actual sites. (2) Measurements were made after identifying a slope with a history of collapse and a possibility of additional failure. The slope status was checked by reviewing the damage level standard obtained from laboratory tests. Based on the analysis, because the number of AE hits and events correspond to damage level 1 or 2, it is assumed that shear failure already starts to occur inside the slope. (3) The number of AE hits and AE events appears to increase with a pattern similar to that of rainfall. In particular, when the accumulated rainfall became constant, the number of AE hits and AE events converged. Such a result indicated that the slope stability was affected mostly by accumulated rainfall, among other factors, rather than by the rainfall on a given date. (4) Obtaining real-time data through the remote monitoring of AE using the Web would contribute to the reliability of AE measurement. In addition, the prediction of the collapses of slopes at each location would become possible in the future, and the early prediction of failure behaviors in rock slopes would also become possible. (5) To decrease the damage caused by the slope failure of sites that are vulnerable to collapse, it is necessary to identify contributing geological features as well as to implement efficient slope maintenance. For such maintenance, the AE technique would be efficient and useful as a tool for the early prediction of slope failure.. REFERENCES Abramson, L., Lee, T., Sharma, S., and Boyce, G., 1996, Slope stability and stabilization methods. John Wiley & Sons, New York, 629 p. Alcott, J.M., Kaiser, P.K., and Simser, B.P., 1998, Use of microseismic source parameters for rockburst hazard evaluation. Pure and Applied Geophysics, 153, 41–65. Amitrano, D., Arattano, M., Chiarle, M., Mortara, G., Occhiena, C., Pirulli, M., and Scavia, C., 2010, Microseismic activity analysis for the study of the rupture mechanisms in unstable rock masses. Natural Hazards and Earth System Sciences, 10, 831–841. Bieniawski, Z.T., 1989, Engineering rock mass classifications :a complete manual for engineers and geologists in mining, civil, and petroleum engineering. John Wiley, New York, 251 p. Brunsden, D., 1979, Mass movements. In: Embleton, C.E. and Thornes, J.B. (eds.), Progress in Geomorphology. Arnold, 130– 186. Butt, S.D., Mukherjee, C., and Lebans, G., 2000, Evaluation of acoustic attenuation as an indicator of roof stability in advancing headings. International Journal of Rock Mechanics and Mining Sciences, 37, 1123–1131. Cheon, D.S., Jung, Y.B., Park, E.S., Song, W.K., and Jang, H.I., 2011, Evaluation of damage level for rock slopes using acoustic emission technique with waveguides. Engineering Geology, 121, 75–88. Dixon, N. and Spriggs, M., 2007, Quantification of slope displacement rates using acoustic emission monitoring. Canadian Geotechnical Journal, 44, 966–976. Dunegan, H.L. and Harris, D.O., 1969, Acoustic emission a new nondestructive testing tool. Ultrasonics, 7, 160–166. Got, J.L., Mourot, P., and Grangeon, J., 2010. Pre-failure behaviour of an unstable limestone cliff from displacement and seismic data. Natural Hazards and Earth System Sciences, 10, 819–829. Guglielmi, Y., Cappa, F., and Amitrano, D., 2008, High-definition analysis of fluid-induced seismicity related to the mesoscale hydromechanical properties of a fault zone. Geophysical Research Letters, 35, L06306. doi:10.1029/2007GL033087. Hardy, H.R., 1977, Emergence of acoustic emission/microseimic activity as a tool in geomechanics. Proceedings of the 1st Conference on Acoustic Emission/Microseimic Activity in Geologic structures and Materials, Pennsylvania State Unversity, Trean. Tech Publication, 13–31. Kaiser, J., 1953, Erkenntnisse und folgerungen aus der messung von geräuschen bei zugbeanspruchung von me-tallischen werkstoffen, Arch. für das Eisenhüttenwesen, 24, 43–45. Koerner, R.M., 1978, Acoustic emission monitoring of soil stability. Journal of the Geotechnical Engineering Division, Proceeding of the ASCE, 104, 571–582. Maejima, T., Morioka, H., Mori, T., and Aoki, K., 2001, Evaluation of the loosened zone on excavation of the large underground rock cavern. In: Adachi, T. et al. (eds.), Modern Tunnel Science and Technology. Rotterdam, A.A. Balkema, 1033–1038. Nakajima, I., Sato, J., Taira, N., and Kubota, N., 1988, The observation of landslide by the acoustic emission monitoring rod. In: Yamaguchi, K., Kimpara, I., and Higo, Y. (eds.), Program in Acoustic Emission IV. Japanese Society for Nondestructive Inspection, 273–281. Read, R.S. and Martin, C.D., 1996, Technical summary of AECL’s mine-by experiment, phase 1: excavation response. AECL, 169. Senfaute, G., Duperret, A., and Lawrence, J.A., 2009, Micro-seismic precursory cracks prior to rock-fall on coastal chalk cliffs: a case.
(11) A study on using acoustic emission in rock slope with difficult ground – focused on rainfall. study at Mesnil-Val, Normandie, NW France. Natural Hazards and Earth System Sciences, 9, 1625–1641. Shiotani, T., Ohtsu, M., and Ikeda, K., 2001, Detection and evaluation of AE waves due to rock deformation. Construction Building Materials, 15, 235–246. Shiotani, T., 2006, Evaluation of long-term stability for rock slope by means of acoustic emission technique. NDT & E International, 39, 217–228. Terzaghi, K., 1950, Mechanism of landslides. Engineering Geology (Berkey) volume, Geological Society of America, 83–123. Wang, H. and Ge, M., 2008, Acoustic emission/microseismic source. 445. location analysis for a limestone mine exhibiting high horizontal stresses. International Journal of Rock Mechanics and Mining Sciences, 45, 720–728. Tomoda, Y. and Ohtsu, M., 2008, Corrosion process of steel bar in reinforced concrete by acoustic emission, Proceedings of The 19th International Acoustic Emission Symposium, Prog in acoustic emission XIV: The Japanese Society for Non-destructive Inspection, 341–346. Manuscript received October 7, 2011 Manuscript accepted September 7, 2012.
(12)
수치
+5
관련 문서
