ORIGINAL RESEARCH
A phase 4 study of nilotinib in Korean patients with Philadelphia chromosome- positive chronic myeloid leukemia in chronic phase: ENESTKorea
Junghoon Shin 1 , Youngil Koh 1 , Seo Hyun Yoon 2 , Joo-Youn Cho 2 , Dae-Young Kim 3 , Kyoo-Hyung Lee 3 , Hyeong-Joon Kim 4 , Jae-Sook Ahn 4 , Yeo-Kyeoung Kim 4 , Jinny Park 5 , Sang-Kyun Sohn 6 , Joon Ho Moon 6 , Yoo Jin Lee 6 , Seonghae Yoon 7 , Jeong-Ok Lee 8 , June-Won Cheong 9 , Kyoung Ha Kim 10 , Sung-Hyun Kim 11 , Hoon-Gu Kim 12 , Hawk Kim 13 , Seung-Hyun Nam 14 , Young Rok Do 15 , Sang-Gon Park 16 , Seong Kyu Park 17 , Sung Hwa Bae 18 , Hun Ho Song 19 , Dong-Yeop Shin 20 , Doyeun Oh 21 , Min Kyoung Kim 22 , Chul Won Jung 23 , Seonyang Park 1 & Inho Kim 1
1
Department of Internal Medicine, Seoul National University Hospital, Cancer Research Institute, Seoul National University College of Medicine, Seoul, Korea
2
Department of Clinical Pharmacology and Therapeutics, Seoul National University Hospital, Seoul, Korea
3
Department of Internal Medicine, Asan Medical Center, Seoul, Korea
4
Department of Internal Medicine, Chonnam National University Hwasun Hospital, Hwasun, Korea
5
Department of Internal Medicine, Gachon University Gil Medical Center, Incheon, Korea
6
Department of Internal Medicine, Kyungpook National University Hospital, Daegu, Korea
7
Clinical Trials Center, Seoul National University Bundang Hospital, Seongnam, Korea
8
Department of Internal Medicine, Seoul National University Bundang Hospital, Seongnam, Korea
9
Department of Internal Medicine, Severance Hospital, Seoul, Korea
10
Department of Internal Medicine, Soonchunhyang University Seoul Hospital, Seoul, Korea
11
Department of Internal Medicine, Dong-A University Hospital, Busan, Korea
12
Department of Internal Medicine, Gyeongsang National University Hospital, Jinju, Korea
13
Department of Internal Medicine, Ulsan University Hospital, Ulsan, Korea
14
Department of Internal Medicine, VHS Medical Center, Seoul, Korea
15
Department of Internal Medicine, Keimyung University Dongsan Medical Center, Daegu, Korea
16
Department of Internal Medicine, Chosun University Hospital, Gwangju, Korea
17
Department of Internal Medicine, Soonchunhyang University Bucheon Hospital, Bucheon, Korea
18
Department of Internal Medicine, Daegu Catholic University Medical Center, Daegu, Korea
19
Department of Internal Medicine, Kangdong Sacred Heart Hospital, Seoul, Korea
20
Department of Internal Medicine, Korea Cancer Center Hospital, Seoul, Korea
21
Department of Internal Medicine, CHA Bundang Medical Center, Seongnam, Korea
22
Department of Internal Medicine, Yeungnam University Medical Center, Daegu, Korea
23
Department of Internal Medicine, Samsung Medical Center, Seoul, Korea
Keywords
CML, molecular response, nilotinib, prognosis
Correspondence
Inho Kim, Department of Internal Medicine, Seoul National University Hospital, Cancer Research Institute, Seoul National University College of Medicine, 101, Daehak-ro, Jongno-gu, Seoul 03080, Korea.
Tel: +82-2-2072-0834;
Fax: +82-2-764-2199;
E-mail: [email protected]
Funding Information
Novartis Pharmaceuticals Corporation (CAMN107AKR11T).
Abstract
Although nilotinib has improved efficacy compared to imatinib, suboptimal response and intolerable adverse events (AEs) limit its effectiveness in many patients with chronic myeloid leukemia in chronic phase (CML- CP). We investigated the 2- year efficacy and safety of nilotinib and their relationships with plasma nilotinib concentrations (PNCs). In this open- label, multi- institutional phase 4 study, 110 Philadelphia chromosome- positive CML- CP patients were treated with nilotinib at a starting dose of 300 mg twice daily.
Molecular responses (MRs) and AEs were monitored for up to 24 months. The 24- month cumulative MR
4.5rate was evaluated as the primary endpoint. Plasma samples were collected from 94 patients to determine PNCs, and the per- patient mean was used to categorize them into four mean PNC (MPNC) groups.
Cumulative MR rates and safety were compared between groups. With a median follow- up of 22.2 months, the 24- month cumulative MR
4.5rate was 56.2%
Cancer Medicine
Open Access
Introduction
Chronic myeloid leukemia (CML) is a clonal hematopoietic stem cell disorder caused by a reciprocal balanced trans- location between the ABL1 locus and the BCR regions in the long arms of chromosome 9 and 22, respectively, which results in the formation of the BCR-ABL1 fusion gene. The unregulated kinase activity of the BCR-ABL1 oncoprotein mediates autophosphorylation and activation of multiple downstream signaling pathways and results in the uncontrolled proliferation and reduced apoptosis of CML cells [1]. With the introduction of imatinib, the first- generation tyrosine kinase inhibitor (TKI), the prog- nosis was revolutionized, with the 10- year survival reaching
~85% and 10- year relative survival over 90% [2, 3].
Nilotinib is a second- generation TKI with improved efficacy in terms of an earlier and deeper molecular response, lower rates of progression to accelerated or blast phase, fewer CML- related deaths, and fewer treatment- emergent BCR-ABL1 mutations, when compared to imatinib [4–6]. Based on the promising results of the landmark phase 3 trial, along with risks of adverse events (AEs) comparable with imatinib, its use was approved for the treatment of newly diagnosed CML in chronic phase (CML- CP) and imatinib- resistant or imatinib- intolerant CML in chronic or accelerated phase [4].
However, even with this highly effective agent, there are still many patients for whom the therapeutic response is inadequate, or toxicity is limiting the treatment [7].
Therefore, there is room for further optimization of the current CML therapy.
Increasing the dose of nilotinib is associated with a dose- proportional increase in steady- state serum levels, and the major AEs of nilotinib are known to occur in a dose- dependent manner [8]. Despite the administration of a uniform dosage, considerable interpatient variability in the serum concentration of nilotinib has been observed, implying that drug exposure may differ substantially
between patients even when taking identical doses [9].
Serum concentration of nilotinib was shown to affect time to response and progression, making it a surrogate marker for prognosis and the severity of certain AEs [9, 10].
Based on these observations, we hypothesized that the optimal plasma level of nilotinib that is sufficient to achieve adequate clinical response while not generating major AEs could be elucidated by the analysis of combined clinical and pharmacokinetic data. Here, we report the results of Evaluating Nilotinib Efficacy and Safety in Clinical Trials- Korea (ENESTKorea) which evaluated the 2- year efficacy and safety of nilotinib treatment, and the relationship between the plasma nilotinib concentration (PNC) and clinical outcomes using prospectively collected patient data and plasma samples of CML- CP patients treated with nilotinib in South Korea.
Patients and Methods
Patient eligibility
ENESTKorea was a phase 4, multi- institutional, single- arm, open- label study investigating the efficacy and safety of nilotinib at the currently approved dose (300 mg twice daily) in adult patients diagnosed as Philadelphia chromo- some (Ph)- positive CML- CP. The diagnosis was confirmed by cytogenetic analysis of at least 20 bone marrow meta- phase cells, performed locally using standard methods, within the 6 months before enrollment. See supporting information for a list of exclusion criteria (Data S1).
Treatment and assessment
Eligible patients were enrolled within 14 days of screening and followed for up to 24 months. Patients were treated with nilotinib at a starting dose of 300 mg twice daily, with a 12- h interval. Transient interruption of treatment was recommended at the occurrence of grade 3 or 4 (95% confidence interval, 44.0%–8.3%), and the median time to MR
4.5was 23.3 months. There were no significant differences in the cumulative rates of major molecular response, MR
4, and MR
4.5between MPNC groups. One patient died due to acute viral hepatitis, and two developed hematological or cytogenetic relapse, while no progression to accelerated or blast phase was observed. Safety results were consistent with previous studies with no new safety signal identi- fied. Across the MPNC groups, there was no significant linear trend in the frequency of AEs. Nilotinib is highly effective for the treatment of CML- CP with manageable AEs. The measurement of PNC has no predictive value for patient outcomes and is thus not found to be clinically useful. This study is registered with clinicaltrials.gov, Number NCT03332511.
Received: 6 November 2017; Revised: 12 February 2018; Accepted: 26 February 2018
Cancer Medicine 2018; 7(5):1814–1823
doi: 10.1002/cam4.1450
Junghoon Shin and Youngil Koh contributed
equally to this work.
hematological AEs (except for anemia) or of grade 2–4 nonhematological AEs. Upon improvement, treatment was resumed at the original dose, resumed at a decreased dose, or discontinued indefinitely, depending on the sever- ity and frequency of occurrence of AEs (Data S2).
Investigators were encouraged to attempt to escalate the dose to the starting level if patients were free from dose- limiting AEs after a four- week period of reduced dose treatment. If, however, they showed no recovery, despite the interruption of treatment, or if treatment failed, the administration was permanently discontinued. Treatment failure was defined as follows: no complete hematological response (CHR) at 3 months, Ph > 65% at 6 months, no partial cytogenetic response (PCyR: Ph ≤ 35%) at 12 months, no complete cytogenetic response (CCyR: no Ph observed by cytogenetic analysis) at 18 months, loss of CHR, PCyR, or CCyR, or progression to the acceler- ated or blast phase.
The BCR- ABL1 transcript type was determined by mul- tiplex polymerase chain reaction at baseline [11].
Quantitative real- time polymerase chain reactions (qRT–
PCRs) were performed at the central laboratory (BML, Daejeon, South Korea) every 3 months, for the quanti- fication of BCR-ABL1 fusion transcripts, standardized to the international scale (BCR- ABL1
IS) [12]. AEs were pro- spectively assessed and recorded throughout the study treatment, at maximum of three- month intervals. They were graded according to the Common Terminology Criteria for Adverse Events, version 4.0 [13].
PNC measurement
Plasma samples were collected every 3 months, for up to 12 months, to determine nilotinib concentrations. This time frame was longer than the sufficient time to reach a steady state (achieved by day 8) [14]. Because the man- datory collection of plasma samples was specified in an amendment to the study protocol in March 2014, fewer measurements were performed for some patients. To obtain a trough PNC level, patients were encouraged to visit the study center before 10:00
amon the day of plasma sam- pling and not to take nilotinib before sampling on that day.
Plasma concentrations of nilotinib were determined using liquid chromatography–tandem mass spectrometry (Agilent 1260 HPLC system and Agilent 6460 Triple Quadrupole; Agilent Technologies, Inc., Santa Clara, CA).
The analyte was separated with a xBrigeTM C18 column (3.5 μm particle size, 2.1 × 50 mm; Waters, Milford, MA). The mobile phase used a mixture of 10 mmol/L ammonium acetate, with 0.1% formic acid in distilled water and 0.1% formic acid in acetonitrile, under gradient conditions. The calibration curve was linear over the range
of 5–5000 ng/mL (r
2≥ 0.9998). The precision results of quality control samples were all <3.481% and the mean accuracy within ±4.82% of nominal values.
Study endpoints
The primary endpoint was the cumulative rate of molecular response 4.5 (MR
4.5; BCR- ABL1
IS≤0.0032%) by 24 months. Secondary endpoints included the cumulative rates of major molecular response (MMR; BCR-ABL1
IS≤0.1%) and molecular response 4 (MR
4; BCR-ABL1
IS≤0.01%) by 12 and 24 months; rates of MMR, MR
4, and MR
4.5at 3, 12, and 18 months; time to MMR, MR
4, and MR
4.5; progression- free survival (PFS); overall survival (OS); and safety. Disease progression was defined as the development of an accelerated or blast phase or the loss of complete hematological or cytogenetic response. PFS was defined as the time from enrollment to documented disease progression or death from any cause. OS was defined as the time from enrollment to death from any cause. Data regarding outcomes were collected only during the study treatment; after discontinuation, data collection was also terminated.
Statistical analysis
Landmark analyses of primary and secondary endpoints included the intention- to- treat (ITT) population (all enrolled patients). For calculation of the response rates
“at” designated time points, patients were considered responders only if response assessment at a specified time point indicated achievement of the response. The 95%
confidence intervals were calculated using the Clopper–
Pearson method. Cumulative response rates and time to responses were presented as time- to- response graphs, using a cumulative incidence function [15]. For calculation of the cumulative response rates, patients who achieved a response at, or before, a specified time point were treated as responders “by” that time point. Dropouts due to treatment failure, AEs, death from any cause, or withdrawal of consent were considered as competing risks of the response. If these patients dropped out before achieving a response, they were counted as nonresponders thereafter.
Patients who were lost to follow- up due to transfer to another institution, or without a documented reason, were censored on the last qRT–PCR assessment date. PFS and OS were estimated using the Kaplan–Meier method. If no event was recorded, patients were censored on the last follow- up date.
Correlations between PNCs and clinical outcomes were
analyzed based on the patients with available PNC data,
who were categorized into quartile groups according to
their per- patient arithmetic mean PNC (MPNC).
Categorical and continuous variables were compared between MPNC groups, using Fisher’s exact tests and one- way analyses of variance, respectively. Cumulative rates of MMR, MR
4, and MR
4.5were compared using Gray’s test [16]. A Fine and Gray subdistribution hazards model was constructed to estimate the hazard ratios for molecular responses in each MPNC group, after adjusting for demo- graphic and clinical variables [17]. Only complete cases with no missing data were used for modeling. The Cochran–
Armitage trend test was used to test whether the frequency of AEs had a linear trend across the MPNC groups.
Tests were two- tailed, a P- value <0.05 was considered statistically significant, and no adjustment was made for multiple comparisons. R version 3.4.1 (R Foundation for Statistical Computing, Vienna, Austria) was used for computation.
Results
Patient characteristics and PNC
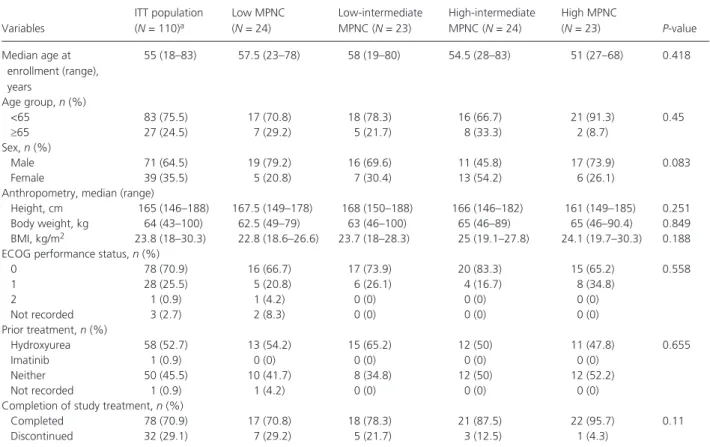
Between May 2013 and November 2014, 110 CML patients from 20 institutions in South Korea were enrolled in ENESTKorea (Fig. 1). The median age was 55 years at
enrollment (Table 1). Prior treatment with hydroxyurea and imatinib accounted for 58 (52.7%) and 1 (0.9%) patient(s), respectively. In total, 78 (71%) patients com- pleted the full 2 years of study treatment (median follow- up duration, 22.2 [range, 0–26.2] months). Dropout reasons included AEs (n = 9), treatment failure (n = 3), withdrawal of consent (n = 7), and transfer to another institution (n = 6). No reason was documented in seven patients.
Plasma samples for PNC measurements were available for 94 patients (all four measurements for 49 patients, 3 for 21, 2 for 13, and 1 for 11 patients). PNC ranged from 44.2 to 5053 ng/mL with the median value of 1270.5 ng/mL (Fig. S1). Inter- and intra- individual vari- ations in the PNC are shown in Figure S2, showing approximately double the amount of variation explained by the interindividual rather than by the intra- individual differences (65.2% and 34.8% of the total variance, respec- tively). There was a slight increasing trend in PNC levels with time after enrollment (Fig. S3). After averaging the PNC levels for each patient, the MPNC levels ranged from 437.4 to 3311.7 ng/mL with the median at 1309.
5 ng/mL. The quartiles of MPNC levels were used for classifying the 94 subjects into four groups: the low (437–1055 ng/mL), low- intermediate (1055–1311 ng/mL),
Figure 1. CONSORT diagram.
aThese patients comprise the intention- to- treat population. PNC, plasma nilotinib concentration; MPNC, mean plasma
nilotinib concentration.
high- intermediate (1311–1667 ng/mL), and high (1667–
3312 ng/mL) MPNC groups (Fig. 1). Overall, demographi- cal and clinical characteristics were balanced across MPNC groups (Table 1).
Molecular response and survival
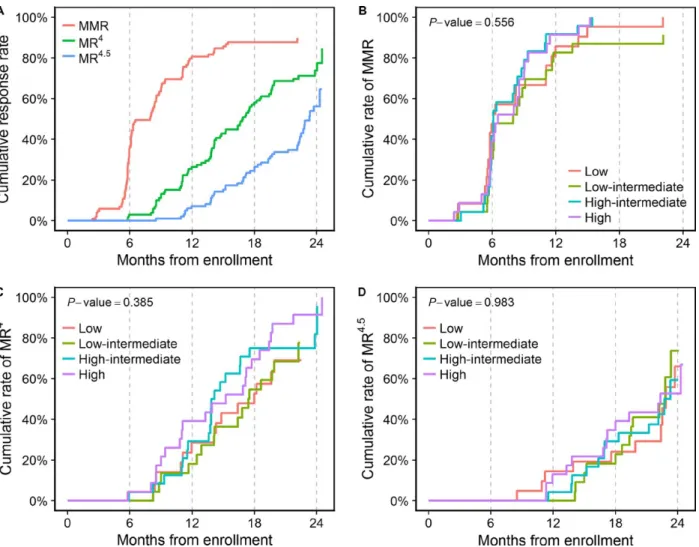
Among patients in the ITT population, the cumulative rate of MR
4.5by 24 months was 56.2% (95% confidence interval [CI], 44%–68.3%), and the median time to MR
4.5was 23.3 months (Fig. 2A). Cumulative rates of MMR and MR
4by 12 months were 80.6% (95% CI, 72.8–88.4%) and 26.4% (95% CI, 17.6%–35.2%), respectively. By 24 months, the cumulative rate of MMR could not be estimated as the longest follow- up duration among non- responders (with respect to MMR) was 22.1 months, while the cumulative rate of MR
4was 73.8% (95% CI, 64–83.7%).
Rates of MMR, MR
4, and MR
4.5at 3, 12, and 18 months are summarized in Table 2. The median time to MMR and MR
4was 8 and 16.9 months, respectively. All patients who completed the 2- year study treatment achieved MMR
(n = 78), while 87.2% (n = 68) and 59% (n = 46) of them achieved MR
4and MR
4.5.
The median time to MMR, MR
4, and MR
4.5was 6.1, 18, and 22.9 months, respectively, in the low MPNC group;
8, 17.4, and 22.8 months in the low- intermediate MPNC group; 6.1, 13.9, and 22.7 months in the high- intermediate MPNC group; and 6.5, 15.2, and 22.3 months in the high MPNC group. In the nonparametrical comparison, there were no significant differences in the cumulative rates of MMR, MR
4, and MR
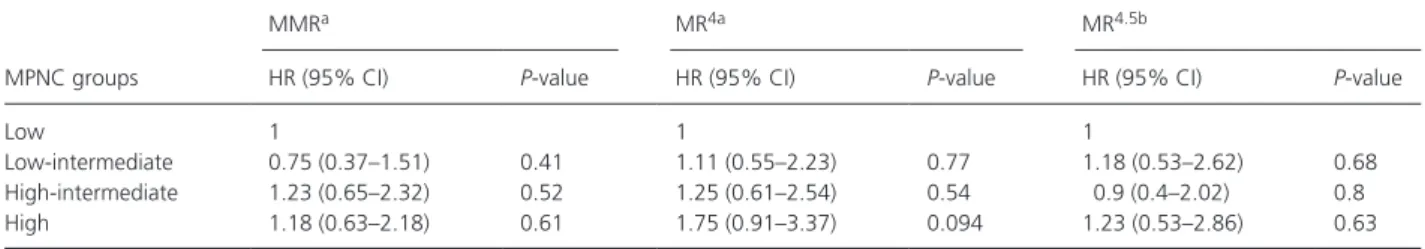
4.5among the four MPNC groups (Fig. 1B–D). After excluding two cases with incom- plete data, the multivariable Fine and Gray subdistribution hazards models also revealed no significant differences in the cumulative rates of MMR, MR
4, and MR
4.5between groups (Table 3).
Throughout the study period, hematological or cytoge- netic relapse occurred in only 2 (1.8%) patients and death in only 1 (0.9%). No progression to accelerated or blast phase was observed. The median PFS and OS were not reached by study completion. The 24- month PFS rate and OS rate were 96.6% (95% CI, 92.8–100%) and 99%
Table 1. Patient characteristics.
Variables
ITT population (N = 110)
aLow MPNC (N = 24)
Low- intermediate MPNC (N = 23)
High- intermediate MPNC (N = 24)
High MPNC
(N = 23)
P- valueMedian age at enrollment (range), years
55 (18–83) 57.5 (23–78) 58 (19–80) 54.5 (28–83) 51 (27–68) 0.418
Age group, n (%)
<65 83 (75.5) 17 (70.8) 18 (78.3) 16 (66.7) 21 (91.3) 0.45
≥65 27 (24.5) 7 (29.2) 5 (21.7) 8 (33.3) 2 (8.7)
Sex, n (%)
Male 71 (64.5) 19 (79.2) 16 (69.6) 11 (45.8) 17 (73.9) 0.083
Female 39 (35.5) 5 (20.8) 7 (30.4) 13 (54.2) 6 (26.1)
Anthropometry, median (range)
Height, cm 165 (146–188) 167.5 (149–178) 168 (150–188) 166 (146–182) 161 (149–185) 0.251
Body weight, kg 64 (43–100) 62.5 (49–79) 63 (46–100) 65 (46–89) 65 (46–90.4) 0.849
BMI, kg/m
223.8 (18–30.3) 22.8 (18.6–26.6) 23.7 (18–28.3) 25 (19.1–27.8) 24.1 (19.7–30.3) 0.188 ECOG performance status, n (%)
0 78 (70.9) 16 (66.7) 17 (73.9) 20 (83.3) 15 (65.2) 0.558
1 28 (25.5) 5 (20.8) 6 (26.1) 4 (16.7) 8 (34.8)
2 1 (0.9) 1 (4.2) 0 (0) 0 (0) 0 (0)
Not recorded 3 (2.7) 2 (8.3) 0 (0) 0 (0) 0 (0)
Prior treatment, n (%)
Hydroxyurea 58 (52.7) 13 (54.2) 15 (65.2) 12 (50) 11 (47.8) 0.655
Imatinib 1 (0.9) 0 (0) 0 (0) 0 (0) 0 (0)
Neither 50 (45.5) 10 (41.7) 8 (34.8) 12 (50) 12 (52.2)
Not recorded 1 (0.9) 1 (4.2) 0 (0) 0 (0) 0 (0)
Completion of study treatment, n (%)
Completed 78 (70.9) 17 (70.8) 18 (78.3) 21 (87.5) 22 (95.7) 0.11
Discontinued 32 (29.1) 7 (29.2) 5 (21.7) 3 (12.5) 1 (4.3)
a
The sum of numbers of four MPNC groups (94) is not equal to the number of the number of the ITT population (110) as 16 patients had no PNC data.
ITT, intention to treat; MPNC, mean plasma nilotinib concentration; BMI, body mass index; ECOG, Eastern Cooperative Oncology Group; MPNC,
mean plasma nilotinib concentration.
(95% CI, 97–100%), respectively. No statistical comparison of survival was performed among the four MPNC groups due to the small number of events.
Safety
Among the ITT population, AEs (of any grade) were reported in 95 (86.4%) patients and grade 3–5 AEs in 36 patients (32.7%; Table 4). Most nonhematological AEs were of grade 1 or 2. The most common nonlaboratory AEs were skin rashes and QT interval prolongation, reported in 38 (34.5%) and 36 (32.7%) patients, respectively. Grade 3 and 4 nonlaboratory AEs included abdominal pain (n = 3), QT interval prolongation (n = 2), cerebral infarc- tion (n = 2), infectious colitis (n = 2), skin rash (n = 1), acute viral hepatitis (n = 1), acute pancreatitis (n = 1), unstable angina (n = 1), mechanical ileus (n = 1), meningitis (n = 1), and congestive heart failure (n = 1).
One patient died due to acute hepatitis A virus infection.
Anemia and thrombocytopenia occurred in 65 (59.1%) and 38 (34.5%) patients, respectively, and 7 (6.4%) and 10 (9.1%) of them were of grades 3–5. Grade 3–5 neutropenia was reported in 9 (8.2%) patients, including 2 (1.8%) cases
Figure 2. Cumulative molecular response rates in the intention- to- treat population (A) and cumulative MMR (B), MR
4(C), and MR
4.5(D) rates in each of the four MPNC groups. MMR, major molecular response; MR
4, molecular response 4; MR
4.5, molecular response 4.5; MPNC, mean plasma nilotinib concentration.
Table 2. Rates of MMR, MR
4, and MR
4.5at 3, 12, and 18 months (intention- to- treat population; n = 110).
3 months 12 months 18 months
MMR, n (%) 6 (5.5) 74 (67.3) 78 (70.9)
95% CI 2–11.5 57.7–75.9 61.5–79.2
MR
4, n (%) 0 (0) 25 (22.7) 56 (50.9)
95% CI 0–3.3 15.3–31.7 41.2–60.6
MR
4.5, n (%) 0 (0) 8 (7.3) 24 (21.8)
95% CI 0–3.3 3.2–13.8 14.5–30.7
MMR, major molecular response; MR
4, molecular response 4; MR
4.5,
molecular response 4.5; CI, confidence interval.
of febrile neutropenia. Hypocalcemia and hyperbilirubinemia were the most common biochemical AEs, occurring in 62 (56.4%) and 50 (45.5%) patients, respectively.
Hypertriglyceridemia and hypercholesterolemia were reported in 38 (34.5%) and 20 (18.2%) patients, respectively.
Because routine monitoring of serum glucose and glycated hemoglobin levels was not mandated in the study protocol, the frequency of hyperglycemia and newly occurring, or worsening, diabetes mellitus could not be evaluated.
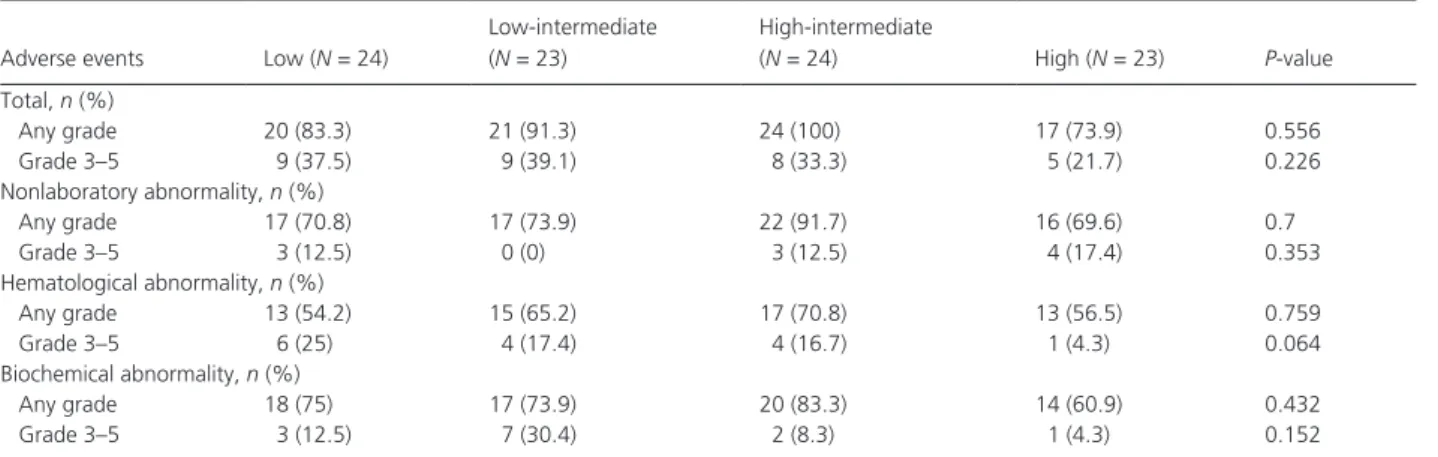
Transient dose interruptions or changes were made in 15 (13.6%) patients due to high- grade AEs and 9 (8.2%) discontinued treatment before completion of the 2- year study. Dropout causing AEs included thrombocytopenia (n = 3), neutropenia (n = 1), unstable angina (n = 1), hepatotoxicity (n = 1), acute viral hepatitis (n = 1), pan- creatitis (n = 1), and infectious colitis (n = 1). Across the four MPNC groups, there were no significant linear trends in the frequency of total AEs, nonlaboratory AEs, hematological AEs, or biochemical AEs, either at any grade or at grades 3–5 (Table 5).
Discussion
In ENESTKorea, we determined the efficacy and safety of nilotinib, administered at the currently approved dose (300 mg twice daily), in patients with Ph- positive CML- CP in South Korea. The results confirm findings from previ- ous studies [5–7], showing excellent efficacy of nilotinib, with 56.2% of the enrolled patients achieving MR
4.5by 24 months (the primary endpoint), with tolerable safety profiles. Achievement of a deep molecular response (DMR), represented by MR
4.5, is known as a key sur- rogate marker for a desirable long- term prognosis in patients with CML. Patients who achieve DMR have better clinical outcomes, including decreased risks of progression and relapse, and longer survival than those who fail to achieve DMR [18, 19]. Furthermore, select patients with durable (usually ≥2 years) DMR are
Table 3. Fine and Gray subdistribution hazards model for the cumulative rates of MMR, MR
4, and MR
4.5.
MPNC groups
MMR
aMR
4aMR
4.5bHR (95% CI)
P- valueHR (95% CI)
P- valueHR (95% CI)
P- valueLow 1 1 1
Low- intermediate 0.75 (0.37–1.51) 0.41 1.11 (0.55–2.23) 0.77 1.18 (0.53–2.62) 0.68
High- intermediate 1.23 (0.65–2.32) 0.52 1.25 (0.61–2.54) 0.54 0.9 (0.4–2.02) 0.8
High 1.18 (0.63–2.18) 0.61 1.75 (0.91–3.37) 0.094 1.23 (0.53–2.86) 0.63
a
Models for the MMR and MR
4were adjusted for the age at enrollment (<65 vs. ≥65), sex, ECOG performance status, and prior treatment with hydroxyurea.
b
The model for the MR
4.5was adjusted for the same variables except for the ECOG performance status since including it resulted in overfitting.
MMR, major molecular response; MR
4, molecular response 4; MR
4.5, molecular response 4.5; MPNC, mean plasma nilotinib concentration; HR, hazard ratio; CI, confidence interval; ECOG, Eastern Cooperative Oncology Group.
Table 4. Adverse events reported in the ITT population (N = 110).
Adverse events Any grade Grade 1–2 Grade 3–5 Total, n (%) 95 (86.4) 94 (85.5) 35 (31.8)
aNonlaboratory abnormalities, n (%)
bSkin rash 38 (34.5) 37 (33.6) 1 (0.9)
QT interval prolongation
36 (32.7) 34 (30.9) 2 (1.8)
Headache 21 (19.1) 21 (19.1) 0 (0)
Fatigue 19 (17.3) 19 (17.3) 0 (0)
Abdominal pain 16 (14.5) 13 (11.8) 3 (2.7)
Pruritus 15 (13.6) 15 (13.6) 0 (0)
Myalgia 14 (12.7) 14 (12.7) 0 (0)
Anorexia 12 (10.9) 12 (10.9) 0 (0)
Nausea 9 (8.2) 9 (8.2) 0 (0)
Alopecia 6 (5.5) 6 (5.5) 0 (0)
Hematological abnormalities, n (%)
Anemia 65 (59.1) 58 (52.7) 7 (6.4)
Thrombocytopenia 38 (34.5) 28 (25.5) 10 (9.1)
Leukopenia 27 (24.5) 23 (20.9) 4 (3.6)
Neutropenia 22 (20) 13 (11.8) 9 (8.2)
Febrile neutropenia 2 (1.8) NA 2 (1.8)
Biochemical abnormalities, n (%)
bHypocalcemia 62 (56.4) 61 (55.5) 1 (0.9) Hyperbilirubinemia 50 (45.5) 49 (44.5) 1 (0.9) ALT increase 39 (35.5) 37 (33.6) 2 (1.8) Hypertriglyceridemia 38 (34.5) 37 (33.6) 1 (0.9) Lipase increase 28 (25.5) 20 (18.2) 8 (7.3)
ALP increase 23 (20.9) 23 (20.9) 0 (0)
Hypercholesterolemia 20 (18.2) 20 (18.2) 0 (0) Hyperkalemia 18 (16.4) 16 (14.5) 2 (1.8) Hyponatremia 15 (13.6) 14 (12.7) 1 (0.9) Amylase increase 15 (13.6) 11 (10) 4 (3.6) AST increase 13 (11.8) 12 (10.9) 1 (0.9)
Hypernatremia 8 (7.3) 8 (7.3) 0 (0)
Azotemia 8 (7.3) 8 (7.3) 0 (0)
Hypoalbuminemia 6 (5.5) 6 (5.5) 0 (0)
a
Grade 3–5 adverse events occurring in <5% of patients were counted in the total frequency, but not listed in the table.
b