DAEHAN HWAHAK HWOEJEE
(Journal of the Korean Chemical Society) Vol. 16, No. 6. 1972
Printed in Republic of Korea
동공부피 분포의 계산결과에 미치는 표면장력의 곡률 의존도 효과
조 창 현•안 운 선*•장 세 힌 서울대학교 문리과대학 화학과
(1972. 10. 6 접수)
Effect of Curvature Dependency of Surface Tension on the Result of Pore-Volume Distribution Analysis
Chang-Hyun Jho, Woon-Sun Ahn* and Seihun. Chang
Department of Chemistry, Seoul National University (Received Oct. 6, 1972)
요 약 질소의 흡착 등온곡선을 이용하여 흡착체의 동공부피 분포를 계산하는 과정에서 표 면장력의 곡률 의존도 고려 효과를 조사하였다. 즉, 장세헌 등에 의한 표면장력의 곡률 의 존도 식과 켈빈 식으로부터 주어진 압력에서의 켈빈반경을 구하고, 이것으로부터 흡착체의 동공부피 분포를 계산하였다. 이와 같이하여 얻은 계산 결과를 표면장력의 곡률 의존도를 고려하지 아니 한 종래방법 에 의 한 계산 결과와 비 교하였다.
일반적으로 곡률 의존도를 고려해주면 동공부피 분포 곡선의 극대부분이 큰 동공 쪽으로 이 동한다. 또한 모세관 응축이 일어나는 상대압력이 종래까지 생각했던 것보다 훨씬 낮아지고 있.
다. 이러한 효과들은 흡착체의 동공들이 미세해 질수록 더욱 현저하게;길어난다.
Abstract The significance of the curvature dependency correctionofsurface tension is studied in calculatingthe pore volumedistribution of porous adsorbent fromnitrogenadsorptionisotherm- That is, Kelvin radii are calculated with curvature dependent surface tension values calculated by Chang et al, and then with these Kelvin radii, pore volume distributions of three porous adsorbents, silica alumina (steam deactivated), silica 홍el (Davidson 59), and silica흥el (Mallinc- krodt Standard Luminescent), are calulated. The results are compared with those obtained by the previous method in. which surface tension is taken as constant and also with the others- obtained by the modelless method proposed by Brunauer et al. The maximum point of the:
distribution curve shift to the larger pore radius, when the curvature dependency is conside
red. Furthermore, the relative pressure at which capillary condensation commences is by far the lower than that accepted previously. This effect becomes significant as the pore radius approaches to the micropore range.
Introduction culation of porous substances fromthe nitrogem The method of pore volume distribution cal- adsorption isotherm is developed by Barrett,
’Department of Chemistry, Sung Kyun Kwan 火沖您 and Halenda1. Andvarious refinements;
University have been mabe by many authors2*3/. Accord-
342
ing to this method, i) average radius of pores in which capillary condensation takes place at a given finite pressure range is calculated by the use of Kelvin equation, and ii) the amount of capillary condensate in the pore of given radius, hence the pore volume, is calculated from the nitrogen adsorption isotherm.
The amount of nitrogen adsorbed at a given pressure consists of two contributions, one due to the capillary condensation and the other due to the increased multilayer physisorption on the walls of comparatively large vacant pores.
•Cranston and Inkley2 have investigated the statistical thickness (r) of physisorbed layer on
•a number of non-porous adsorbents and found that it was converging to a constant value at .a given pressure. Assuming an independency
the statistical thickness on the curvature of the walls of adsorbents, they have calculated the contribution of condensate to the total am
ount of adsorbate at a given pressure, and obteined pore volume distribution curves for -a number of adsorbents.
Broekhoff and deBoer4, upon the considera
tion of thermodynamic stabilityof the physisor
bed layer, have shownthat the statisticalthick
ness should depend on the curvature of the walls on which physisorption takes place. How-
■ever, they have shown that the formal thick
ness of the adsorbed layer on the walls of re latively narrowcylindricalpore isapproximately -equal to the statistical thk:knessof theadsorbed layer on the flat surface. In such pores, capi
llary condensation is expected to take place, before the formal thickness deviates appreciably from the statistical thickness.
On the other hand, the curvature effect on the surface tension is very significant as the curvature increases to the order of 106 cm-"1.
Therefore, the vapor pressure in equilibrium with the curvedsurface, which is obtained from
theKelvinequation, is quitedifferent depending whether the curvature effect of surface tension is considered or not. For an example, when the pore diameter is about 30 A, the equilibri
um relative vapor pressure is less than 0.130 as canbe seen in Table 1, whereas it is 0.350 if the surface tension is assumed to be indepen dent of the curvature.
In this work, pore volume distribution is calculated using the Kelvin equation with curv
ature dependent surface tension, and the result is compared with the one obtained with the Kelvin equation in which constant surface tension is assumed.
Curvature Dependency Correction The radius of closed-end cylindrical pore is calculated by the use of Kelvin equation,
Here, and P are the saturation vapor pre ssure and the vapor pressure at whichthe capi
llary condensation takes place in a pore of radius r, respectively; Vm, the molar volume of the liquid; and 了, the surface tension of the curved liquid surface. In the application of this equation, the curvature dependency of the surface tension should be known. The effect on the liquid density may be neglected.
Tolman5, and Biff and Kirkwood6 have derived a curvature dependent surface tension equation. Chang et al" have also obtained a similar result according to the theory of signi
ficant liquid structure;
一一矿 ⑵
where, 代 is the surface tension of the flat surface: d is the distance between the surface of separation and the surface of tension accord
동공부피 분포의 계산결과에 미치는 표면장력의 곡률 의존도 효과 343 ing to Tolman, and the unimolecular thickness
acording to Chang et al. The unimolecular thickness can be calculated from the geometri cal consideration of molecular packing and solid density. Combining equations (1) and (2), the following equation is obtained.
r ~ t ~ 9.6 — 一 2了eoVm 一 一
Using this equation, the radius (r) of the clo
sed-end cylindrical pore in which capillary con densation takes place at the relative vapor pressure (F/F) can be calculated. This radius is converted into the pore diameter and the result is tabulated in the first colummof Table 1.
According to Cranston and Inkley, the closed- end cylindrical pore volume (V12) whose pore diameters are in the range of dx through d2 is calculated from the following equation;
v12 = R12(v12 一 妣宫 스也K赤
d2+*4d
(4) where,
R12 = r石 _£)2 J r
虹2 = 4。2—如)
以2 = 슬■(如 + 如
Table 1. Vanlues of P/Po, Rl2 and k12 for standard increments of pore diameter.
d P/Po k12 R12 d P/P. 力 12 Rl2
313-4 0. 931
1.203 303.4 0. 929
0. 50 1.209
293-4 0.926
0. 52 1. 215
283-4 0.924
0.54 1.221
273.4 0. 921
0.56 1.228
263.4 0. 918
0. 58 1.235
253.4 0.915
0. 60 1.243
243.4 0.911
0. 62 1. 251 233.4 0. 907
0.65 1. 261 223.4 0. 902
0.68 1. 270
213.4 0.897
0.71 1.281
203.4 0. 891
0.75 1.293
193. 4 0. 885
0. 79 1.306
183.4 0-879
0.84 1.320
173.4 0. 871
0.89 1.336
163.4 0.861
0. 95 1.353 153.4 0. 850
1.02 1.373
143.4 0.838
1.10 1.395
133.4 0- 824
1.19 1.420
123.4 0.809
1.30 1.449
113-4 0. 787
1.44 1.4S2
103.4 0. 764
1- 60 1. 520 93.4 0. 734
1.80 1.565
83-4 0. 696
2. 08 1.619 73.4 0. 646
2.44 1.682
63.4 0- 578
1.40 1.736
58-4 0. 535
1.56 1.775
53.4 0-484
1.76 1.814
48.4 0- 423
2.00 1.852
43.4 0. 350
2. 34 1.882
38.4 0.265
2. 86 1.890
33.4 0.168
1. 34 1.873
31.4 0.130
1- 49 1.847 29.4 0. 090
1.68 1- 799 27.4 0. 058
1.93 1-729
25.4 0.035
2. 26 1.628
23.4 0.016
344
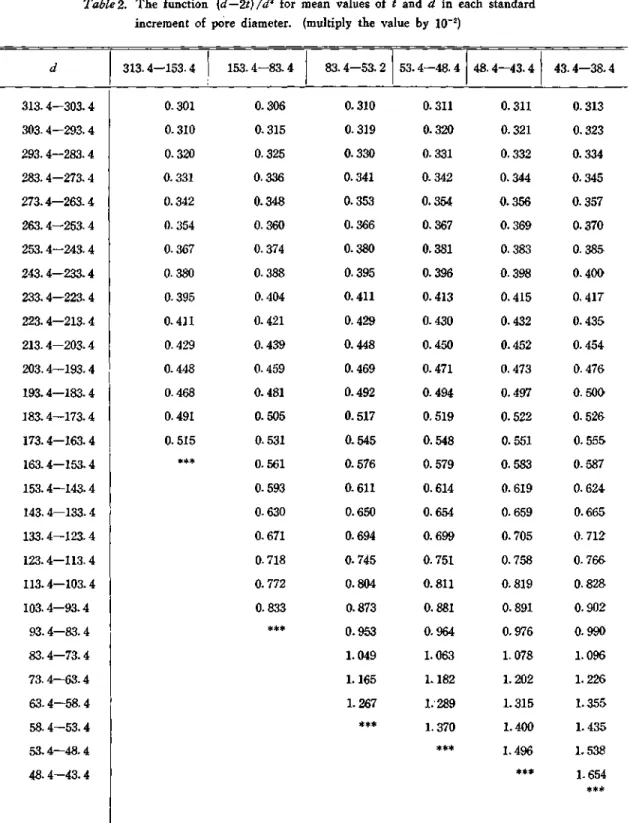
Table 2. The function (d—2t) /d2 for mean values of t and d in each standard increment of pore diameter, (multiply the value by 10~2)
d
313.4—153.4 1
153.4—83.4 83.4—53. 2 53.4—4& 4 48.4—43.4 43.4—38.4
313- 4—303.4 0.301 0.306 0.310 0. 311 0. 311 0. 313
303. 4一293. 4 0. 310 0.315 0.319 0.320 0. 321 0.323
293.4—283.4 0. 320 0.325 0.330 0. 331 0. 332 0. 334
283. 4—273. 4 0.331 0. 336 0.341 0.342 0. 344 0. 345
273.4—263.4 0.342 0.348 0. 353 0.354 0.356 0.357
263.4—253.4 0. 354 0. 360 0.366 0. 367 0.369 0.370
253. 4—243.4 0- 367 0. 374 0.380 0.381 0. 383 0. 385
243.4—233.4 0- 380 0. 당 88 0. 395 0.396 0. 398 0.400
233.4—223.4 0- 395 0. 404 0.411 0. 413 0.415 0. 417
223.4—213.4 0. 411 0.421 0.429 0.430 0.432 0.435
213.4一203.4 0. 429 0.439 0. 448 0.450 0.452 0.454
203.4—193.4 0.448 0- 459 0. 469 0.471 0.473 0. 476
193.4—183.4 0.468 0. 481 0.492 0.494 0.497 0. 500
183.4—173.4 0.491 0. 505 0. 517 0. 519 0. 522 0. 52&
173.4—163. 4 0. 515 0. 531 0.545 0. 548 0.551 0. 555
163.4—153.4 *** 0.561 0. 576 0. 579 0. 583 0. 587
153.4—143.4 0.593 0. 611 0.614 0. 619 0- 624
143.4—133. 4 0. 630 0.650 0.654 0. 659 0.665
133.4—123.4 0.671 0. 694 0.699 0.705 0. 712
123. 4—113. 4 0. 718 0.745 0. 751 0.758 0. 766
113.4—103.4 0.772 0. 804 0.811 0. 819 0. 828
103. 4—93.4 0- 833 0.873 0.881 0. 891 0. 902
93.4—83.4 *** 0.953 0. 964 0.976 0.990
83.4—73.4 1.049 1.063 1. 078 1.096
73. 4—63.4 L 165 1.182 1.202 1.226
63.4—58.4 1. 267 1.289 1.315 1.355
58.4—53.4 *** 1. 370 1.400 1.435
53.4—48. 4 *** 1.496 L538
48.4—43.4 *** 1. 654
***
동공부피 분포의 계산결과에 미치는 표면장력의 곡률 의존도 효과 345
Table 2. continued
d !
1
38. 4—33.4 33. 4—31. 4 31. 4—29.4 29.4—27.4 27.4—25. 4 25. 4—23.4
313. 4—303. 4 0.314 0. 315 0.316 0.317 0.318 0. 319
303. 4—293. 4 0. 324 0. 325 0. 326 0. 327 0. 328 0. 329
293.4—283.4 0. 335 0, 336 0. 337 0. 338 0. 339 0. 340
283- 4—273. 4 0. 347 0.348 0.349 0. 350 0. 351 0. 352
273.4—263.4 0.359 0,360 0.361 0. 363 0- 364 0. 365
263- 4—253. 4 0.372 0. 374 0.375 0. 376 0- 378 0.379
253- 4—243. 4 0. 387 0.388 0.390 0- 391 0. 392 0.394
243, 4—233. 4 0.402 0.404 0.405 0.407 0.408 0.410
233. 4—223. 4 0.419 0.421 0.422 0.424 0.429 0.428
223. 4—213- 4 0.437 0.440 0. 441 0.443 0.445 0.447
213. 4—203. 4 0.457 0. 460 0.461 0.463 이 465 0. 468
,203. 4—193. 4 0.479 0.482 0.484 0.486 0. 488 0.491
193. 4一 183. 4 0.503 0.506 0. 508 0. 510 0.513 0.516
183.4 一 173.4 0.530 0. 533 0. 535 0. 538 0.541 0.544
173.4—163.4 0. 559 0.563 0. 566 0.568 0.572 0. 575
163.4一 153.4 0.592 0.597 0.599 0.603 0. 606 0.610
153.4—143.4 0-630 0.634 0.638 0.641 0- 645 0.650
143- 4一 133. 4 0.672 0.677 0.681 0. 685 0- 690 0. 695
133.4一 123. 4 0.720 0. 726 0.730 0.735 0.741 0.747
123. 4—113-4 0.775 0.782 0. 788 0.793 0.800 0.807
113.4—103.4 0.839 0.848 0.854 0.861 0. 869 0.878
103- 4—93.4 0. 915 0.926 0.934 0.942 0. 951 0.962
93. 4—83. 4 1.006 1.020 1. 029 1.036 1.051 1- 064
83. 4—73. 4 1.117 1.134 1.145 1.158 1.173 1.190
73. 4—63- 4 1. 253 1.276 1.291 1.308 1.327 1.350
-63- 4—58. 4 1.379 1.407 1.426 1.448 1.484 1.500
58. 4—53- 4 1.477 1. 524 1.533 1. 558 1. 600 1.621
53- 4—48. 4 1.588 1. 628 1. 656 1.686 1. 721 1.779
48. 4—43. 4 1.715 1.765 1.799 1. 836 1.879 1.929
43. 4—38. 4 1.861 1. 924 1.967 2.014 2.068 2.131
38. 4—33- 4 *** 2.110 2.165 2. 226 2.296 2.377
33. 4—31. 4 31. 4—29. 4 29.4—27. 4 27. 4—25. 4 25. 4—23. 4
*** 2.324
*수:* 2.4002. 509
***
2.486 2. 607 2.739
***
2.585 2.720 2.869 3.033
***
조창현 • 안운선 • 장세헌
Here,巧2 is the total volume of nitrogen adsor bed in the pressure range of consideration;
V^d, the volume of pores having diameters between (么一-志d) and the dia
meter of the largest pore. The values of ^12 and R12 are given in the third and fourth co
lumns of Table 1 for suitable pore-diameter
increments, and the factor (d—2t) /d2 is given in Table 2 for values of d larger than c以 The second term in the bracket of equation (4) rep resents the volume of the nitrogen which in
creases the thickness of the adsorbed layer on the walls of larger vacant pores.
Since equation (4) can be applied to the de-
Table 3- Calculation of pore-size distribution of a silica gel (Davidson 59)
d
(A)
P/Po 如2
(ml/g)
02—
(니/g)
V12 (ml/g)
EVi2
(ml/g)
Si?
(m2/g)
財 (m2/g)
313.4 0. 931
0. 0010 0.0010 0.0012 0.156
303.4 0.929
0. 0013 0.0012 0. 0015
0.0012
0. 202
0.156,
293.4 0. 926
0. 0015 0. 0015 0. 0018
0. 0027
0. 252
0.358 283.4 0.924
0.0018 0.0017 0.0021
0.0045
0.306
0.610' 273.4 0. 921
0. 0018 0.0017 0.0021
0.0066
0. 318
0.916 263.4 0- 918
0. 0015 0. 0015 0.0018
0.0087
0.284
1. 234 253.4 0.915
0.0035 0.0035 0.0043
0. 0105
0.692
1. 518 243.4 0.911
0. 0033 0. 0032 0. 0040
0. 0148
0.671
2.210 233.4 0.907
0. 0050 0. 0050 0. 0062
0- 0188
1.087
2.881 223.4 0. 902
0. 0061 0.0061 0. 0077
0- 0250
1.402
3.968 213-4 0.897
0. 0100 0. 0099 0. 0126
0. 0327
2.418
0.370 203.4 0. 891
0. 0116 0. 0115 0.0147
0. 0453
2.972
7.788 193.4 0.885
0.0153 0.0151 0.0196
0. 0600
4.157
10.760 183.4 0.879
0. 0281 0.0279 0.0364
0,0796
8.160
14.917 173.4 0- 871
0.0631 0- 0627 0.0828
0.1160
19*663
23.077 163.4 0- 861
0. 2246 0. 2237 0.3028
0.1988
76. 471
42. 740- 153.4 0.850
0.1967 0.1840 0.2664
0. 5016
71.802
119.211 143,4 0.838
0.0835 0.0788 0.1098
0.7680
31.791
191.013 133.4 0.824
0.0515 0. 0456 0.0648
0.8778
20.189
222.804 123.4 0- 809
0.0263 0. 0193 0. 0279
0.9426
9.433
242.993 113.4 0.787
0. 0288 0.0207 0.0307
0. 9705
11.337
252.426 103.4 0.764
0.0288 0.0195 0.0296
1.0012
12. 028
263,763 93.4 0.734
0. 0225 0. 0116 0.0182
1.0308
8. 222
275. 791 83.4 0.696
0.0250 0. 0119 0. 0192
1. 0490
9.811
284. 013
73.4 0.646 1.0682 293.824
동공부피 분포의 계산결과에 미치는 표면장력의 곡률 의존도 효과 347 sorption branch as well as to the adsorption
branch, it is applied to thedesorption branches of silica gel (Davidson 59), silica alumina
(steam deactivated), and silica gel (Mallin- ckrodt Standard Luminescent). The procedure of pore volume distribution calculation adopted in this work is the same as the one proposed by Cranston and Inkley except the correctionof the curvature dependency of surface tension. The adsorption isotherm forthe above three samples have been reported previously by Cranston and Inkley2, and Brunauer et al8. The typical result of calc니ation for Davidson 59 is given in Table 3. The sixth column of the Table 3 is the cumulative volume. The seventh column is the inner surface area in square meters per gram of adsorbent, which can be obtainedfrom the fifth column by the use of following equat ion;
&2 =绊冬X 18 a
where, dr is the mean diameter of the corres
ponding region, and "次'is a factor, 1, 584 x 10t, which results from the geometrical con
sideration of close packing. The last column of the table is the cumulative surface area.
The Result and Discussions
From Table 3, cumulative pore volume V (r) is plotted against pore radius r. The pore vo
lume distribution curve, then, can be obtained by converting this plot to the JV(r)/ Jr versus r curve. Figures 1, 2, and 3 are the pore volume distribution curves obtained in this way for the three samples. In each figure, both results, one with curvature dependency correction andtheother without correction, are shown for comparison. The result with curva
ture correction is quite similar in its shape to the one without correction, but the maximum
Vol. 16, No. 6, 1972
has shifted to the larger pore radius side.
The result of this shifting has significant meanings; firstly, the pore volume distribution calculated by the previous method gives a com
paratively large negative deviation. In the case of silica alumina, the mean pore radius calculated by the proposed way is about 20 A, while the previous method gives 15 A. This is quite a large relative difference. Secondly, if th은 curvature dependency of surface tension is taken into account, the micro pore condensation occurs at the further lower relative vapor pre ssure than that accepted before. In other words, the vapor pressure in equilibrium with the condensate in 바禮 pore of given radius would be quite different from the vapor press-
Fig. 1. Pore volume distribution of a silca gel (Davidson 59); >corrected; Ouncorrected.
Fig. 2. Pore volume distribution of a silica gel (Mallinckrodt Standard Luminescent):.
corrected; O uncorrected.
348
Fig. 3. Pore volume distribution of a silica alumina (heat deactivated); •corrected; Quncorrected.
ure calculated assuming the surface tension is con아ant. This discrepency becomes more pro minent as the pore radius approaches to the lower limit of the transition pore. Forexample,
when the pore diameter is about 30 A, relative vapor pressure in equilibrium with the pore condensate is less than 0.13 as can be seen in Table 1, whereas it is 0.35 if the surface tens
ion is assumed to be independent of the curva
ture.
As can be seen from Figures 2 and 3, silica gel (Mallinckrodt) and silica alumina have both transition and micro pores. This result coincide with the ^-plot obtained by Brunauer et al8. Although the calculations are performed to the micro pore region, it is meaningless but for the purpose of comparison. It is inadequate to apply the thermodynamically derived Kelvin
equation to the micro pores. For Davidson 59, the cumulative surface areais 332.7m2/g accor
ding to Cranston and 335m2/g according to the corrected medelless method of Brunauer.
The observed B. E. T. area is 273 m2/g. The cumulative surface area calculated by the pro posed way is very close to the B. E. T. area, being 293.8m〃g. The comparison of cumulat- tive surface area of theother two samplesto the B. E.T. area is meaningless as theseadsorbents have micro pores.
The authors express their appreciation to the Ministry of Science and Technology for the grant of this work.
References
1. E. P. Barrett, L. G, Joyner, and P. P. Halenda, J. Amer. Chem. Soc., 73, 373 (1951).
2. R. W. Cranston, and F. A. Inkley, Advances in Catalysis, 9, 143 (1957).
3. S. Brunauer, R. Sh. Mikhail, and E. E. Bodor, J. Colloid and Interface Sci., 24, 451 (1967).
4. J. C. P. Broekhoff, and J. H. deBoer, J. Cata
lysis, 9, 8 (1967).
5. R. C. Tolman, J. Chem. Phys., 17, 333 (1949).
6. J. G. Kirkwood, and F. P. Buff, J. Chem. Phys.
17, 338 (1949),
7. W. Ahn, M. Jhon, H. Pak, and S. Chang, J.
Colloid and Interface Sci. 38, 605 (1972).
8. R. Sh. Mikhail, S. Brunauer, and E. E. Bodor, J. Colloid and Interface Sci., 26, 54 (1968).