Development for Life Assessment System for Pipes of Thermal Power Plants
Jung-Seob Hyun, Jae-Sil Heo, Doo-Young Kim, Min-Gyu Park†
KEPCO Research Institute, 105 Munji-Ro, Yuseong-Gu, Daejeon, 305-760, Korea
† [email protected]
Abstract
The high-temperature steam pipes of thermal power plants are subjected to severe conditions such as creep and fatigue due to the power plant frequently being started up and shut down. To prevent critical pipes from serious damage and possible failure, inspection methods such as computational analysis and online piping displacement monitoring have been developed. However, these methods are limited in that they cannot determine the life consumption rate of a critical pipe precisely.
Therefore, we set out to develop a life assessment system, based on a three-dimensional piping displacement monitoring system, which is capable of evaluating the life consumption rate of a critical pipe. This system was installed at the “M” thermal power plant in Malaysia, and was shown to operate well in practice. The results of this study are expected to contribute to the increase safety of piping systems by minimizing stress and extending the actual life of critical piping.
Keywords: Life Assessment, Piping Support, Three-dimensional Displacement Measuring System, Thermal Power Plant, High- Temperature Steam Pipe
I. INTRODUCTION
As power plants are required to produce ever-larger amounts of electricity, the components of thermal power plants in particular are being subjected to more demanding conditions such as higher temperatures and pressures. Especially, in Korea, there is a trend for thermal power plants to be frequently shut down and then started up in response to electricity shortages. All of the facilities of thermal power plants are greatly affected by this frequent starting-up and shutting-down.
In general, major facilities are always carefully inspected.
On the other hand, minor facilities such as piping systems are not checked regularly because these are assumed to be under static loads. Nevertheless, many of the issues experienced in older power plants that have been operating for more than 20 years are related to such piping systems.
Given the above, we cannot secure the stable operation of thermal power plants without continuous maintenance and careful attention to these critical pipelines. This attention to the pipelines not only helps to prevent accidents but also contributes to the economical operation of a thermal power plant. To date, however, there have been no quantifiable methods for assessing the life of a pipe.
In this study, a three-dimensional (3D) displacement measuring system (3DDMS) was adopted for application to the actual online life monitoring of the pipes of a thermal power plant.
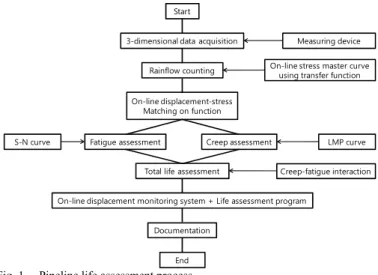
Based on this 3DDMS, a real-time advanced piping life assessment system (APLAS) is proposed. This would be capable of protecting the critical piping systems in a thermal power plant from serious damage and ultimate failure. The process flow for APLAS is shown in Fig. 1.
There are several different types of piping support, such as variable and constant spring hangers, at which the position of a pipe can be measured [1]. However, these supports only offer one-dimensional displacement information for the piping system
even though the piping system can move in three directions.
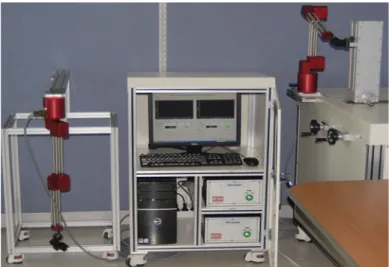
Therefore, researchers have expended considerable effort to resolve this problem. Some novel systems for obtaining 3D displacement information for piping systems have been suggested by many groups [2]-[4]. Among these systems, the 3D displacement measuring system (3DDMS) developed by Hyun et al. [5] was adopted for this study because this system has proven itself to be the most cost-effective system developed to date. The systems that we used are shown in Fig. 2.
II. 3D DISPLACEMENT MEASURING SYSTEM(3DDMS) The main component of the 3DDMS is the measuring device shown in Fig. 3. This is consisted of two linear variable differential transformers (LVDTs) and three rotary encoders for measuring the linear displacement and rotational angle,
Fig. 1. Pipeline life assessment process.
Start 3-dimensional data acquisition
Rainflow counting
On-line displacement-stress Matching on function
Total life assessment
On-line displacement monitoring system + Life assessment program Documentation
End
Fatigue assessment Creep assessment
Measuring device On-line stress master curve
using transfer function
LMP curve Creep-fatigue interaction S-N curve
respectively. By using two types of the devices shown in the figure, we can calculate the exact X, Y, Z coordinate values at the P 1 , P 2 positions as shown in Fig. 4(a) and (b). Here, l 1 , l 2 are the linear position values at P 1 , P 2 as obtained from the LVDTs.
Furthermore, θ 1 , θ 2 , θ 3 are the rotational angles at P 1 , P 2 that can be obtained from the rotary encoder.
The process for obtaining the exact position of X, Y, Z is expressed by equations (1) to (4) [5]. This device is installed around the pipe to provide position data for the pipe in real time.
Using the 3DDMS, we can find the relationship between the displacement of the pipe and the temperature, as well as the resulting stress. Then, this relationship is used to calculate any fatigue and creep damage.
=
=
(1)
= cos − +
= − +
(2)
=
=
= cos
(3)
= +
= − +
= +
(4)
III. CALCULATING THE REMAINING LIFE OF CRITICAL PIPES IN A THERMAL POWER PLANT
To demonstrate the accuracy and efficiency of APLAS, a test was conducted and the results are presented in this subchapter.
Among many pipes of a thermal power plant, main steam pipe (MSP) was selected for the test because this is exposed to more severe conditions. The installed measuring devices are shown in Fig. 5. In general, two main factors are considered when calculating the damage to the facilities at high temperatures and under high pressure [6].
The first of these is damage resulting from low-cycle fatigue, and the second is that caused by creep. These two factors are also considered in our study. In the following chapter, the specific procedure for calculating the remaining life of a pipe is described.
A. Calculating the life consumption of major pipes subject to low- cycle fatigue damage
Given that the temperature of the pipe being considered was relatively low and its vibration amplitude was high, we assumed that the pipe is subjected to low-cycle fatigue even before steady- state operation of the power plant. We usually consider four kinds of stress when performing a stress analysis on a pipe in a thermal power plant. These are the hoop, longitudinal, principal, and ASME code stresses, all of which are widely used for the stress
(a) (b) Fig. 4. Coordination system for 3DDMS.
Fig. 5. Measuring device installed on pipelines in the “M” TPP.
Fig. 6. Measured displacement with respect to operation time (MSP).
Y(Y‘)
X‘
θ 2
θ 1 P 1
P 2 l 2 l 1
Y(Y‘)
Z
X
X' θ
3l
1l
2Fig. 2. Three-dimensional displacement measuring system(3DDMS).
Fig. 3. Schematic of measuring device.
analysis of cylindrical objects.
First, hoop stress refers to a stress distribution with rotational symmetry, as given by in equation (5). Here, P (KPa), D o (mm), t (mm), and ca (mm) indicate the design pressure, outside pipe diameter, pipe wall thickness, and corrosion allowance, respectively.
= 2 − − 0.4
(5) Second, longitudinal stress, which is a normal stress acting parallel to the axis of cylindrical symmetry, is written as equation (6). Here Z (mm), i i (dimensionless), M i (Nmm), i o
(dimensionless), M o (Nmm), F a (Kgf), P a (Kgf), and A c (mm) indicate the section modulus, in-plane stress intensification factor, in-plane moment, out-of-plane stress intensification factor, out- of-plane moment, axial force, axial force from internal pressure, and corroded cross-sectional area, respectively.
= +
+ +
(6)
Third, the principal stress, which is the maximum stress in the cylinder, is expressed by equation (7.a) and (7.b). Here, M a is the torsional moment.
Finally, the ASME code stress is composed of three kinds of stress, namely, sustained, sustainer plus occasional (as given by equation (8)), and expansion stress. Here, D o (mm), t n (mm), Z (mm), M A (Nmm), M B (Nmm), M C (Nmm), i (dimensionless) indicate the pipe outside diameter, radius of the pipe, section modulus, resultant moment loading on the cross-section due to the weight and other sustained load, resultant moment loading on the cross-section due to the weight and other occasional load, and range of resultant moments due to thermal expansion, respectively [7].
= +
2 +
(7.a)
= −
2 +
2
(7.b)
= 4 + 0.75
(8.a)
Fig. 9. Principal stress with respect to displacement of pipeline (MSP).
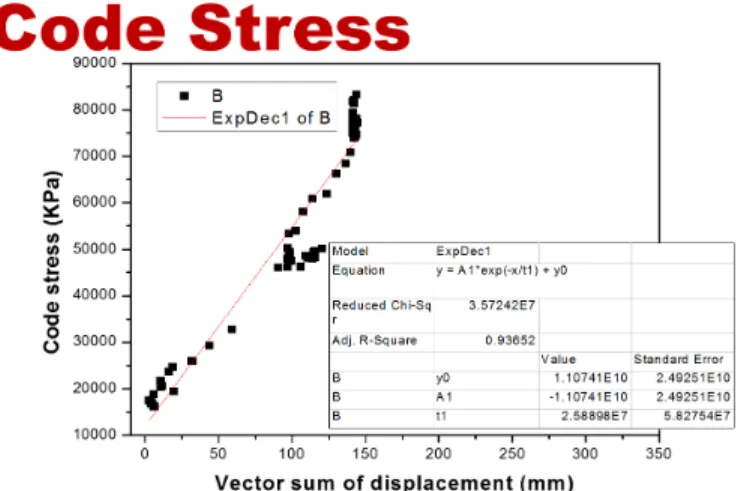
Fig. 10. ASME code stress with respect to displacement of pipeline (MSP).
Fig. 7. Hoop stress with respect to displacement of pipeline (MSP).
Fig. 8. Longitudinal stress with respect to displacement of pipeline (MSP).
= 4 + 0.75
+ 0.75
(8.b)
=
(8.c) However, the calculation of stress exerted on the pipes using these four equations is subject to some limitations. Not only is it difficult to obtain some of the values to be substituted into the equations, but it is not possible to obtain stress values in real time.
Therefore, to calculate the stress exerted on the MSP in real time easily, we conducted preliminary experiments to determine the relationship between the displacement and stress exerted on the pipes. We define this relationship called the “stress transfer function”. We installed the 3DDMS on the MSP at the “M” power plant in Malaysia and obtained the displacement variation of MSP with respect to time shown in Fig. 6.
Then, we compared the displacement history for the pipe with the stress value as calculated using Pipe Plus (ver.7.02) As shown in Fig. 7 to Fig. 10 [8], the relationship has an exponential function between the displacement of the pipe and the calculated stress. The transfer function is expressed as follows equation (9):
= ∙ exp +
(9) where a, b, and c are constants defined as stress coefficients determined by preliminary experiments and d is the displacement of the pipe. Based on this raw data, we can obtain stress coefficients a, b, and c for the MSP.
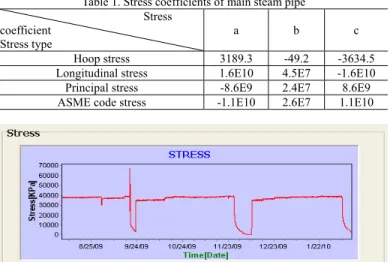
The specific values of the stress coefficients for the MSP are shown in Table 1. Thus, we can ultimately obtain the variation of stress with respect to time.
Among the four kinds of stress, we selected the principal stress to calculate the remaining life of a pipe because this corresponds to the maximum stress in the material. The stress results are shown in Fig. 11.
The data shown on Fig. 11 are after the trimming process, which is applied to enable the use of the data to evaluate the remaining life of critical pipes. A rainflow counting method was
adopted for the trimming process. After the completion of trimming process, we can count the number of stress applied at a certain stress which can be used for calculating fatigue damage.
In general, Miner’s rule is widely used for evaluating damage resulting from low-cycle fatigue. It is usually assumed that fatigue failure occurs when the cumulative damage exceeds a critical value such as D = 1. For example, if 1 < D, fatigue failure occurs. For D < 1, however, we can determine the remaining fatigue life [8]. After calculating the number of cycles applied under each stress, we then sum all of the values at each stress to determine the total fatigue life consumption rate "D."
The S-N curve for P91 steel was used for this process. The calculated life consumption rate for pipes subject to low-cycle fatigue was thus found to be 1.1% for the MSP.
= ∆
∆ + ⋯
+ ∆
∆
(10)
= + + ⋯ + = + + ⋯ + =
(11) B. Calculating the life consumption of major pipes subject to creep damage
We considered that, during the steady operation of pipes, creep damage becomes the dominant factor determining the life consumption rate of those pipes. The Larson-Miller parameter (LMP) is widely used to evaluate the creep life consumption [9].
The LMP is expressed by equation (12).
= log +
= + ln + ln
+ ln + ln
(12) where k 0 , k 1 , k 2 , k 3 , and k 4 are the material-dependent coefficients, σ principal is the stress exerted on the pipes, T is the Kelvin temperature, t r is the creep life time, and C is a material- dependent constant. Specific values for each of the coefficients are listed on Table 2.
In the case of the LMP, the final objective is to calculate t r . To do this, information on the stress and temperature is necessary.
As mentioned above, four kinds of stress are exerted on the pipe.
From these, we selected the principal stress as the input value for Eq. 12 because this is the maximum stress in the material.
This principal stress can be obtained from Fig. 11 for the MSP. The stress value after entering the steady operation region (plateau region) should be chosen as the input data for equation (12), 38.4 MPa is selected as input value for equation (12). Then,
Table 2. Specific values used for equation (12)
Property Value Property Value
σ
Principal38.4 MPa k
1-2795.8
T 845 K k
2193.8
C 24 k
34.4
K
033825.1 k
4-5.6
Table 1. Stress coefficients of main steam pipe Stress coefficient
Stress type
a b c
Hoop stress 3189.3 -49.2 -3634.5 Longitudinal stress 1.6E10 4.5E7 -1.6E10 Principal stress -8.6E9 2.4E7 8.6E9 ASME code stress -1.1E10 2.6E7 1.1E10
Fig. 11. Principal stress with respect to operation time (MSP).
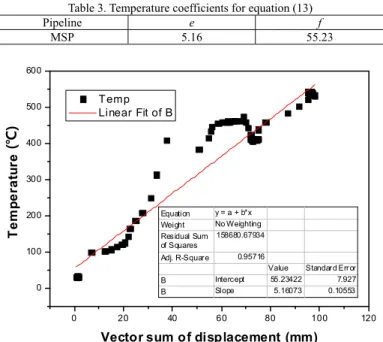
we require a temperature value for the final goal. We installed the 3DDMS on the MSP and traced the temperature and displacement of the pipe with respect to time. The resulting graph of temperature with respect to displacement is shown in Fig. 12 for the MSP. From these graphs, it is clear that these two terms have a linear relationship like “temperature transfer function” like equation (13).
Here, e and f differ depending on the thermal power plant.
Therefore, these temperature coefficients should be determined by a preliminary study. The value d is the displacement of the pipe. The specific values for "M" thermal power plant are shown on Table 3.
= ∙ +
(13) Next, from the Eq. 13, we can obtain temperature information for the MSP. First we can already obtain the displacement with respect to operation time as shown in Fig. 13, which can be used for the input value of Eq. 12. The temperature calculated from Eq. 13 is shown on Fig. 13, which is 845K (=572°C) during steady-state operation. Now, we have all the values to calculate creep life time t r . From the Eq. 12, calculated creep life is 392,265 hours. Operation time of unit #2 of "M"
thermal power plant is 87,928 hours. Therefore, the calculated life consumption rate by creep is 22.42% for the MSP.
C. Total life consumption rate of major pipeline
To obtain the total life consumption rate of a pipe, we should sum the life consumption rates for both low-cycle fatigue and creep. This summation is done based on the linear summation rule.
Using this method, fatigue damage and creep damage are simply added together to estimate the cumulative damage [9]. The equation of linear summation is as follows:
= +
(14) where D f , D c are the life consumption rate of the pipe resulting
from low-cycle fatigue and creep, respectively. The input values for the calculation for determining the remaining life are listed in Table 4. D total is 23.52% for the MSP.
III. CONCLUSION
We have proposed a new pipe life assessment system and have verified its application to the determination of pipe life assessment as a means of ensuring the reliability of the piping systems of thermal power plants. To demonstrate the accuracy and efficiency of APLAS, we installed this system at the “M”
thermal power plant in Malaysia.
We obtained the 3D displacement data with the aid of 3DDMS. With the 3D displacement we performed the calculations for fatigue and creep damage. We went on to estimate the remaining life of the pipes in a thermal power plant by installing this device in an actual plant. The main advantage of this system is that it makes it possible to simply calculate the remaining life of a pipe in real time without any additional devices. Before our study, there has been no method to deal with accurate damage on pipes in a thermal power plant. We believe that the results of this study will contribute to the safety and reliable maintenance of piping systems, by minimizing stress and extending the life of critical piping.
ACKNOWLEDGEMENT
This project has been carried out under the financial support by the Korea Electric Power Co., Ltd & TNBR.
REFERENCES
[1] ASME, Power Piping, B31, pp. 9-15, ASME code for pressure piping, 2004.
[2] M. T. Flaman, B. E. Mills, Development of a strain gauge based on- line structural integrity monitoring system for fossil fueled G. S., CEA project No. 726 G 627, Ontario Hydro Research Division, USA, 1992.
[3] T. Fournier, On-line fatigue monitoring and margins probablistic assessment, pp. 271-276, SMIRT-12K, Kussmaul, North-Holland, 1993.
[4] B. Han, B. J. Wever, T. Neger, In-service condition monitoring of piping systems in power plants requirements and advanced techniques, vol. 1, issue 1, pp. 1-13, OMNI (in German), 2002.
[5] J. S. Hyun, G. W. Song, S. Y. Cho, Y. S. Lee, Real-time Table 3. Temperature coefficients for equation (13)
Pipeline e f
MSP 5.16 55.23
Fig. 12. Temperature with respect to displacement (MSP).
0 20 40 60 80 100 120
0 100 200 300 400 500 600
Temp Linear Fit of B
T e m p er at u re
Vector sum of displacement (mm)
Equation y = a + b*x Weight No Weighting Residual Sum of Squares
158680.67934 Adj. R-Square 0.95716
Value Standard Error
B Intercept 55.23422 7.927
B Slope 5.16073 0.10553