• 검색 결과가 없습니다.

Does the Rise of the Korean Wave Lead to Cosmetics Export?

N/A
N/A
Protected

Academic year: 2021

Share "Does the Rise of the Korean Wave Lead to Cosmetics Export?"

Copied!
8
0
0

로드 중.... (전체 텍스트 보기)

전체 글

(1)

Abstract

The purpose of this research is to identify the relation be- tween the Korean wave and Korean cosmetics export. Instead of using UN COMTRADE data as with other researches on the similar studies, this paper adopts Google Trends query index with keyword ‘Korean drama’as a proxy variable for cultural trade. With controlling export determining factors such as GDPs of import and export countries, distance, R&D, and FTA, this paper examines whether the Korean wave represented by Google Trends contributes to the explosive increase of Korean cosmetics export in the recent years. Moreover, this study also investigates the possible effects of the Korean wave on export that could vary according to the different trade groups by classi- fying import countries into two groups: 74 countries worldwide and 9 ASEAN member countries. The results reveal that the Korean wave indeed leads to cosmetics export to ASEAN coun- tries but show weak relation with cosmetics export to worldwide.

Keywords: Korean wave, Cosmetics, Cultural proximity, Google Trends, Gravity model.

JEL Classification Codes: F14, F10, D10.

1. Introduction

Many of research questions raised in the last two decades on international trade flows have centered on the trade costs derived from the territorial borders. The famous research by McCallum (1995) on Canada-US regional trade patterns trig- gered a flood of studies in search of the true magnitude of the border effect. Obstfeld and Rogoff (2000) include the home bias in trade as one of the six puzzles in international macroeconomics. Disdier and Head (2008) examined 1467 dis- tance effects estimated in 103 papers and found that, on aver- age, 10% increase in distance lowers bilateral trade by about

* Deputy Director. [KOTRA New Delhi #2, 12th Floor, DLF Cyber Terraces, Building 5-A, DLF Cyber City, Phase-lll, Gurgaon-122002, Haryana, India. Tel: (+91 124) 462-8500, Fax: (+91 124) 462-8501 E-mail: [email protected]]

9%. Transportation costs for long distance, tariffs, and other non-tariff barriers can explain part of the reasons why the na- tional border still matters.

As Grossman (1998) speculates, however, the reason why distance matters so much might also be due to the lack of fa- miliarity or cultural difference. Many researchers adopting the gravity model include common languages (Boisso & Ferrantino, 1997; Melitz, 2008), colonial experience (Rose, 2000;

Eichengreen & Irwin, 1998), and ethnic ties (Rauch & Trindade, 2002; Combes, Lafourcade, & Mayer, 2005; Wagner, Head, &

Ries, 2002) as proxies for cultural ties between the trading partners. The border effect is not restricted to trade in manufac- tured goods. Miroudot, Sauvage and Shepherd (2013) find that trade costs in services are much higher than those in a goods sector. Their research data also suggest that trade costs in manufactured goods have fallen considerably over the last dec- ade, but they have remained essentially stable in services markets. Blum and Goldfarb (2006) show that physical distance reduces trade even in online products and services that should be free of trade costs.

In line with the above reasons, a few of recent studies focus on the trade diffusion effects of the popularity of Korean cultural contents such as TV dramas and music (Park & Choe, 2009;

Kim & Ahn, 2012). The remarkable success of Korean cultural industry is especially evident in Asian countries. According to the data from Korea Creative Content Agency (KOCCA), during the 8-year period between 2005 and 2013, the value of Korean music export increased more than 10 times from 22 million dol- lars to 227 million dollars. Among the total music export value in 2013, 97.4% went to Asian countries such as Japan, China and South East Asian countries. The situation of the Korean ex- port of broadcasting contents is not much different. During the same 8-year period the value of Korean export of TV contents increased from 121 million dollars to 309 million dollars and 73% of the total export of TV contents in 2013 went to Asian countries.

The advantage of adopting trade in cultural goods as a proxy for cultural links between trading partners is that, while other cultural factors such as common language, colonial experience, and ethnic ties are time invariant, cultural trade changes within a short period of time. Thus, the dynamic nature of trade pat- terns can be captured with the use of the cultural trade as a proxy variable for cultural ties between trading partners. George Print ISSN: 2288-4637 / Online ISSN 2288-4645

doi: 10.13106/jafeb.2015.vol2.no4.13.

Does the Rise of the Korean Wave Lead to Cosmetics Export?

2)

Young-Seaon Park*

[Received: June 15, 2015 Revised: September 30, 2015 Accepted: October 15, 2015]

(2)

and Becker (1977) challenge the traditional assumption of the stability of tastes and preferences through case studies of ad- diction, habitual behavior, advertising and fashions. In accord- ance with the above reasoning it is also possible to assume that frequent exposure to foreign cultural contents can shift do- mestic consumers’ buying behavior (Rauch & Trindade, 2009;

Bala & Van Long, 2005; Park, 2014). There are ample cases of media reports and publications in Korea claiming that the Korean wave greatly contributed to the Korean export in partic- ular and to the Korean economy in general. However, most of such reports are based either on pure speculations or on the anecdotal researches which lacks rigorous analysis.

This paper attempts to study the trade creation effects of the Korean wave, with special consideration of the Korean cos- metics export. The Korean cosmetics industry is chosen be- cause of the remarkable performance of the industry in the midst of the economic recession in recent years. Also, cos- metics can be categorized as partially substituted products and so their consumption is closely connected not only to the prod- uct price and quality but also to the images the products impart.

One of the possible reasons why Korean cultural contents have become so popular in Asian countries may be due to the at- tractive faces of Korean entertainers. Since the concept of beau- ty can be shared in the specific regions, the rise of the Korean wave might explain the explosive export increase of Korean cosmetics to Asian countries in the recent years.

Whereas most of the researches on trade creation effects of the Korea wave (i.e., Park & Choe, 2009; Kim & Ahn, 2012) use United Nations COMTRADE data for both manufactured and cultural goods, this paper adopts data extracted from Google Trends search queries as a proxy measure for trade in cultural goods. As the Internet is widely used for the consumption of audio-visual products, trade of manufactured cultural goods such as CDs, magnetic tapes, and cinematographic film may fail to represent the true scale of cultural trade.

Choi and Varian (2012) demonstrate that Google Trends can help in predicting the present. Google Trends search queries have recently been used to estimate the current level of dis- ease activities such as ‘influenza’, ‘bird flu’ and ‘swine flu’ in the countries (Ginsberg et al., 2009; Eysenbach, 2006). Askitas and Zimmermann (2009) demonstrate strong correlations between keyword searches and unemployment rates using monthly German data. As the Internet searching activities become part of daily lives around the world, analyzing search key word quer- ies may also reveal each person’s cultural affinity to a certain country.

The paper proceeds as follows: The next section describes the dynamic growth of the Korean cosmetics industry. The third section proposes a gravity model approach for empirical analysis with data description. The fourth section provides the estimation results. The fifth section considers the implications of the results and concludes.

2. Korean Cosmetics Industry

Korean cosmetics industry enjoys fast growth thanks to heightened health interests among the population and increasing investment in the cosmetics production. According to the data from Korea Health Industry Development Institute (KHIDI) shown in Table 1, Korean domestic production of cosmetics reached 7280 million dollars in 2013 from 4049 million dollars in 2009 with an average annual growth of 16.0%, far outpacing the average Korean GDP growth rate of 3.2% in the same period.

The remarkable aspect of the industry is that whereas most of other industries were severely affected by the financial crisis and recorded no growth at all in 2009, Korean cosmetics mar- ket grew by as high as 11.8% in the same year.

<Table 1> The Market Size of the Korean Cosmetics Industry (Unit: US$ million, %) 2009 2010 2011 2012 2013 YoY CAGR

(2009~2013) Market

Size 4,336 5,456 5,947 6,231 6,962 11.7 12.8 Production 4,049 5,202 5,763 6,321 7,280 15.1 16.0 Export 416 597 805 1,067 1,290 20.8 32.9

Import 702 851 989 978 972 -0.1 8.9

Trade

Balance -286 -254 -184 89 318 Source: Korea Health Industry Development Institute

* YoY stands for year over year and CAGR stands for compound annual growth rate.

Source: Korea Health Industry Development Institute

<Figure 1> Korean Export of Cosmetics (Unit: US$ thousand)

The export performance of the Korean cosmetics industry in

the recent years is also noteworthy. According to the data from

Korea Health Industry Development Institute (KHIDI), the value

of Korean cosmetics export during 11 year periods (2002 –

(3)

2013) increased more than 10 times from 123 million dollars to 1,289 million dollars and, as shown in Figure 1, the export val- ue of Korean cosmetics in 2012 outpaced the import value for the first time.

The major export destinations of Korean cosmetics are Asian countries such as China, Hong Kong, Japan, Taiwan and South East Asian countries. Figure 2 shows that the top 10 export destination countries occupy 90% of the total Korean cosmetics export and among them only The United States and The Russian Federation are not Asian countries. Among the South East Asian countries Thailand, Singapore, and Malaysia are in- cluded in the top 10 export destinations.

There might be several explanations why Korean cosmetics are highly preferred among Asian people rather than people in the other part of the world. Firstly, Korean companies’ efforts on satisfying domestic consumers paid off not only in the domestic market but also in the overseas market. Korean women are very conscious of the skin care and so the majority of the prod- uct development of cosmetics companies thereby focuses on skin care products. Biotechnology takes an increasingly im- portant role in protecting skin from aging. Korea’s number one cosmetics manufacturer, Amore Pacific Corp, established a bio- science R&D center in 2011 and LG Household and Health Care, the number two cosmetics company, formed a technology partnership with a renowned women’s hospital, Cha Medical Center, on stem cell research (Kang, 2012). Taking into account the Korean women’s special interest in ingredients of the cos- metics, Korean companies have also developed skin care prod- ucts made of such natural, organic and herbal medical in- gredients as green tea, ginseng, sacred lotus root, and bamboo extract. Sulhwasoo, an exceedingly successful brand by Amore Pacific Corp, is noted for its fragrance of ginseng and the use of many traditional medicinal herbs and roots. The kin interests in clean and fair skin are not an exclusive property of Korean women but are shared among Asian women. For example, the Japanese brand Shiseido also created a herb-infused face cream developed especially for Chinese skin (Alexander, 2011).

Source: Korea Health Industry Development Institute

<Figure 2> Korean Export of Cosmetics per Country as of 2013

Secondly, Asian women also share a similar concept of beauty and skin color. In Korea ‘whitening’ skin product is popu- lar because white skin is synonymous with beauty. The descrip- tion of a woman’s skin as ‘Jade white’has been a common ex- pression for praising her beauty in both Korea and China. There are poems from Tang Dynasty in China that described women as ‘Jade white’ and ‘creamy tinted’ (Alexander, 2011). According to the study by Li et al. (2008), contemporary meanings of whiteness in Asia are influenced by Western ideologies as well as traditional Asian values and beliefs. They concluded that skin whitening and lightening products not only promise to fulfill the desire for white and fair skin as a route to higher status, but al- so empower women to control their own bodies and alter nature.

Thirdly, since the advertisement and product brand image are critical aspects of the cosmetics industry, star marketing method of the Korean companies is thought to have greatly contributed to the success of Korean cosmetics in the Asian countries. For example, Laneige, one of the renowned cosmetics brands of Amore Pacific Corp, made a contract for product advertisement with an actress Song Hye-Kyo in 2008. The actress achieved stardom in Asia for her appearances in successful TV dramas such as ‘Autumn in My Heart’ and ‘Full House’ and also fre- quently appeared in Chinese movies. Also, the number four player in the Korean cosmetics market, The Face Shop, be- came highly successful partly due to the signing of the actor Bae Yong-joon of the popular TV drama ‘Winter Sonata’ as an endorser.

3. Empirical Strategy and Data 3.1 Empirical Strategy

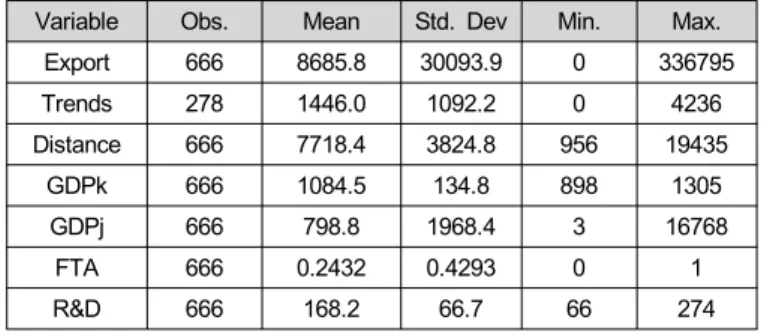
This paper adopts the gravity model for the empirical analysis of the impact of the Korean wave on the export of the Korean cosmetics utilizing the export panel data from 2005 to 2013.

The gravity model has been widely used for analyzing the pat- tern of international trade because it has produced some of the clearest and most robust findings in economics (Leamer &

Levinsohn, 1995). Even though the gravity model has been used for bilateral trade data since Tinbergen (1962), it became truly popularized in empirical work after the concept of multi- lateral resistance (Anderson & Van Wincoop, 2001) was in- troduced and fixed effects revolution (Feenstra, 2004; Redding &

Venables, 2004) started to capture the multilateral resistance terms. The combination of its consistency with theory and easy implementation leads to rapid adoption of the model in empirical work (Head & Mayer, 2014).

With the inclusion of multilateral resistance, Anderson and Van Wincoop (2001) derive the following theoretically founded gravity equation of international trade:

1

i j ij

i j

j i

w

x y y y

τ

σ

Π

⎛ ⎞

⎜ ⎟

⎝ Ρ⎠

=

where xij denotes exports from country i to j, yi and yj are

(4)

GDPs of each country, ijis the gross bilateral trade cost, τ σ > 1 is the elasticity of substitution, and i and j represent country Π Ρ i’s outward and country j’s inward multilateral resistance varia- bles, respectively.

As shown by Shepherd (2013), taking the natural logarithms of all variables, the above equation can be transformed as fol- lows:

log (1

l

)[log ] lo

o g log log log

g log

log log

ij

i i i

ij i j

ij ij ij ij

j j j

C Y

F Y

F

X C F F

Dist Cultur Y

e FTA

σ τ

τ

= + + + −

= +

= −

=

+

− Π

= − Ρ

The first term, C, is equal to world GDP but for estimation purposes it can be a coefficient because it is constant across all exporters and importers. The next term, Fi, is shorthand for a full set of exporter fixed effects. Taking the same approach, Fj is a full set of importer fixed effects. log ij is the sum of cost τ variables such as distance, cultural proximity, and FTAs be- tween country i and country j.

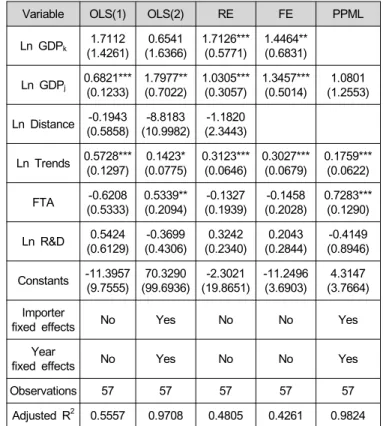
To analyze the impact of the Korean wave on the export of the Korean cosmetics, adopting and modifying the above equa- tions, this paper estimates the following econometric model:

0 1 2 3 4 5

6ln

n

&

kjt kt jt l jt kjt

kt t kj

j

j t

lnX lnGDP lnGDP lnDistk Tr FTA

R D

β β β β β

ends

β

β γ δ ε

= + + + + +

+ + + +

where k indicates the export country (Korea), j is the import country and t is time; ln denotes natural logarithms; Xkjt is the flow of Korean cosmetics export to j country in t period; GDPkt and GDPjt are GDPs of Korea and import countries respectively;

Distkj is the geographical distance between Korea and import countries; Trendsjt is Google Trends search queries with the keyword "Korean drama" in the import countries as a proxy vari- able for cultural ties between the two parties. FTAkjt is a dum- my variable denoting the presence of Free Trade Agreements between Korea and import countries. R&Dkt is Korean cos- metics industry’s investment in research and development. j γ and t are import country and year fixed effects respectively δ and kjt is a disturbance term. ε

3.2 Data

The study analyzes Korean export data of cosmetics to 74 countries during the period from 2005 to 2013 collected by Korea Customs Service (http://www.customs.go.kr). According to Harmonized System Codes (HS Code) cosmetics are in the cat- egory of 33 described as ‘Essential oils and resinoids; perfum- ery, cosmetic or toilet preparations’. Even though the two digit category can be further divided into more specific product lists, this paper chooses the data of Korean cosmetics export based on HS Code 33.

As is shown in Table 2, during the eight year period Korean export of cosmetics grew more than 4times and the biggest im- porters are China, Hong Kong and Japan. The explosive export growth to Thailand is especially noteworthy. In 2005 Thailand’s import value of Korean cosmetics was mere 2.7 million dollars and this figure grew to 61.9 million dollars in 2013, which is a

23 times increase, making Thailand the 6th largest importer of Korean cosmetics. To a lesser degree yet still remarkable are other South East Asian countries’ import increases. During the same period the export of Korean cosmetics to Philippines in- creased 11.3 times, to Indonesia 10.7 times and to Malaysia 5 times.

<Table 2> Korean Export of Cosmetics in the Selected Years (HS Code 33)

(Unit: US$ thousand)

Country 2005 2007 2009 2011 2013

China 71,837 101,354 127,057 217,027 315,788 Hong Kong 29,804 31,373 45,484 97,328 214,668 Japan 39,288 42,092 86,560 139,560 159,032 U.S. 34,954 35,795 43,078 66,847 107,117 Taiwan 33,686 30,381 34,840 68,566 94,809 Thailand 2,739 4,148 13,974 61,945 77,889 Vietnam 9,812 11,448 15,944 32,273 42,452 Malaysia 4,783 8,631 13,186 23,895 41,459 Singapore 15,311 15,788 16,583 33,107 41,144

Russia 4,632 5,230 4,765 9,966 25,918

Australia 5,084 4,375 5,967 8,908 15,509 Mongolia 5,485 7,162 6,391 10,484 13,021

Indonesia 842 837 1,527 9,044 11,664

Philippines 612 2,200 2,156 6,945 11,145

UK 3,284 3,953 4,359 5,819 10,658

Iran 6,661 8,000 8,925 15,093 9,177

UAE 3,007 4,165 5,036 4,968 8,931

Canada 4,081 2,839 2,438 3667 7,560

Myanmar 274 204 2,167 2447 5,100

France 2,297 2,131 1,983 5997 5,034

sub total 278,473 322,106 442,420 823,886 1,218,075 others 16,431 19,001 22,063 36,989 58,902

total 294,904 341,107 464,483 860,875 1,276,977 Source: Korea Customs Service

This paper adopts Google Trends query data as a proxy variable for cultural affinity between Korea and its trading partners. The trend information of Google searches over time in a particular coun- try is available by Google Trends (http://www.google.com/trends).

Google Trends does not report the raw level of queries for a given search term, but instead it reports a query index, meaning the rela- tive search volume in that region at a point in time. The query in- dex starts at 0 in January 1, 2004 and the numbers at later dates indicate the percentage deviation from the query share on January 1, 2004 (Choi & Varian, 2012).

The search keyword for this paper is ‘Korean drama’ during

2005 2013 periods in Google Trends because this term may –

capture the most important aspects of the Korean wave in the

world. TV dramas embody rich cultural traits such as family re-

(5)

lationships, social interaction, history, latest trends, food and fashion (Park, 2014). Figure 3 shows the Google Trends popu- larity comparison among Korean, Japanese and Chinese dramas during 2004 2014 periods and it is evident that the popularity – of Korean drama relative to those of Japanese and Chinese in- creased considerably over the time.

Source: Google Trends

<Figure 3> Google Trends by Keywords Comparison: 2004 - 2014 The adoption of Google Trends data as a proxy variable for cultural affinity in this paper has several advantages. Firstly, as Google has become a mainstream general search engine since last decade, the accumulated query information may reveal each individual’s level of tastes and preferences over a particular pe- riod in a specific region. As information and communications technology (ICT) infrastructure has been improved and the num- ber of the Internet users has also increased all over the world during the last decade, the term ‘Big data’recently becomes a household name. Secondly, whereas the available trade data of cultural goods are limited to relatively small number of countries, the data in Google Trends can cover extensive regions. Thirdly, to the best knowledge of the author of this paper, there has not been any attempt to use Google Trends query data as a proxy variable for cultural affinity in the field of international trade.

Google Trends query index data is available on the weekly ba- sis with the exception of a few countries. For the purpose of simplicity and convenience in matching with other yearly basis data, this paper combines the entire weekly index data and transforms them to yearly data.

Table 3 shows the descriptive statistic in which the total ob- served number of variables is 666, except for Trends with 278 observed variables. Since each country’s condition of adopting and using the Google search engine is different, the Trends in- dex data of early years in some countries are simply not available. Distance information measured in kilometers between Seoul, the Korean capital city, and the capital cities of import countries is from timeanddate.com (http://www.timeanddate.com).

The data of GDPs measured in US billion dollars are from World Development Indicators. The information of FTA, a dum- my variable indicating the presence of FTA between Korea and trading partners, is from Korea Customs Service. The data of R&D, the total R&D expenditure on cosmetics industry from

both public and private companies measured in Korean billion won, is from Korean Health Industry Statistics System (http://khiss.go.kr).

<Table 3> Data Description

Variable Obs. Mean Std. Dev Min. Max.

Export 666 8685.8 30093.9 0 336795

Trends 278 1446.0 1092.2 0 4236

Distance 666 7718.4 3824.8 956 19435

GDPk 666 1084.5 134.8 898 1305

GDPj 666 798.8 1968.4 3 16768

FTA 666 0.2432 0.4293 0 1

R&D 666 168.2 66.7 66 274

4. Estimation Results 4.1 Baseline Results

The results of pooled OLS, random effects, fixed effects and Poisson pseudo-maximum likelihood estimator (PPML) for the panel data analysis are reported in Table 4. OLS (1) does not include fixed effects of import country and year dummies while OLS (2) includes all of them. The results show that OLS (2) with adjusted R2 0.9818 is a theory consistent and much im- proved estimator than OLS (1) with adjusted R2 0.6675. The overall results from several estimators confirm that, in line with the gravity model’s assumption, the dependent variable is pos- itively correlated with GDPs of Korea and its trading partners and negatively correlated with the geographical distance. Korean R&D investment in the cosmetics industry does not show any significance in general and, in most cases, it shows even neg- ative relationships. The result can be interpreted that it takes a relatively long period of time to reap the fruit of R&D investment. The FTA variable clearly indicates statistical sig- nificance in most of the estimators except for OLS estimator without fixed effects.

Google Trends, as a proxy variable for cultural affinity, shows

significant correlation in OLS (1), random effects and fixed

effects. However, the theory consistent fixed effects treated OLS

(2) and PPML do not show any signs of correlation. The result

implies that the Korean wave is not much relevant when it

comes to Korean export of such partially substituted products as

cosmetics to countries throughout the world. The Korean wave,

even if more people in the world have recently been recogniz-

ing the phenomenon, is still primarily in the domain of Asian

episodes.

(6)

<Table 4> Dependent Variable: Log Export (OLS, RE, FE), Export (PPML)

Variable OLS(1) OLS(2) RE FE PPML

Ln GDP

k

-1.2602

(0.9193) 1.7711**

(0.7465) 1.5540***

(0.3871) 1.2976***

(0.4200) 2.8882***

(0.8762) Ln GDP

j

0.7351***

(0.0545) 1.3908***

(0.2481) 0.8703***

(0.0924) 1.3840***

(0.2532) 0.0885 (0.3236) Ln Distance -2.2835*** (0.1269) -5.5608***

(0.5610) -2.4351***

(0.2456) -3.3946***

(0.5297) Ln Trends 0.4953*** (0.0629) 0.0013

(0.0418) 0.1089***

(0.0372) 0.0790**

(0.0369) 0.0393 (0.0527)

FTA -0.0388

(0.1726) 0.3326***

(0.1251) 0.2142*

(0.1142) 0.2551**

(0.1174) 0.3113***

(0.1136) Ln R&D -0.8395**

(0.3497) -0.2374

(0.2175) 0.0450

(0.1206) -0.0542

(0.1318) -0.1472 (0.2574) Constants 33.0793

(5.7707) 36.1557

(7.1118) 11.3130

(3.2624) -10.2506

(2.4797) 15.1225 (6.6898) Importer

fixed effects No Yes No No Yes

fixed effects Year No Yes No No Yes

Observations 274 274 274 274 277

Adjusted R

2

0.6675 0.9818 0.6011 0.2194 0.9515

*, **, *** denote statistical significance at the 90, 95, and 99 percent levels, respectively.

4.2 Regional Differentiation

Whereas above data analysis covers Korean export of cos- metics to 74 countries during 2005-2013 periods, this section concentrates the analysis on export to ASEAN 9 countries in the same periods. Among 10 ASEAN member countries Lao DPR is dropped because Google Trends data for the country in the specified period is not available. The primary reason why ASEAN countries are chosen for the analysis is that the South East Asian region is where the Korean wave has been strikingly visible and the usage of the Internet including the social net- work has grown rapidly over the years.

Table 5 shows the estimation results for Korean export of cosmetics to 9 ASEAN member countries. As in the case of the baseline analysis, Pooled OLS, Pooled OLS with fixed effects, random effects, fixed effects, and PPML estimators are compared. In the case of PPML estimation, the two variables of distance and Korean GDP are dropped to ensure that the esti- mates exist.

<Table 5> Dependent Variable: Log ASEAN Export (OLS, RE, FE), ASEAN Export (PPML)

Variable OLS(1) OLS(2) RE FE PPML

Ln GDP

k

1.7112

(1.4261) 0.6541

(1.6366) 1.7126***

(0.5771) 1.4464**

(0.6831) Ln GDP

j

0.6821***

(0.1233) 1.7977**

(0.7022) 1.0305***

(0.3057) 1.3457***

(0.5014) 1.0801 (1.2553) Ln Distance -0.1943 (0.5858) -8.8183

(10.9982) -1.1820 (2.3443) Ln Trends 0.5728*** (0.1297) 0.1423*

(0.0775) 0.3123***

(0.0646) 0.3027***

(0.0679) 0.1759***

(0.0622) FTA -0.6208

(0.5333) 0.5339**

(0.2094) -0.1327

(0.1939) -0.1458

(0.2028) 0.7283***

(0.1290) Ln R&D 0.5424

(0.6129) -0.3699

(0.4306) 0.3242

(0.2340) 0.2043

(0.2844) -0.4149 (0.8946) Constants -11.3957

(9.7555) 70.3290

(99.6936) -2.3021

(19.8651) -11.2496

(3.6903) 4.3147 (3.7664) Importer

fixed effects No Yes No No Yes

fixed effects Year No Yes No No Yes

Observations 57 57 57 57 57

Adjusted R

2

0.5557 0.9708 0.4805 0.4261 0.9824

*, **, *** denote statistical significance at the 90, 95, and 99 percent levels, respectively.

GDPs of ASEAN countries clearly indicate positive and strong relationship with Korean cosmetics export whereas GDP of Korea shows mixed significances depending on each estimator.

The results can be interpreted that when it comes to Korean export of cosmetics to ASEAN countries, the demand condition of the importing countries play more important role than export country’s factor conditions. The distance variable shows a neg- ative sign as expected but does not indicate any statistical importance. The reason of this result can be easily drawn; all the analyzed ASEAN countries are geographically concentrated in the same region and so distance differentiation is rather a difficult task.

The FTA variable shows an inconsistent pattern of signs and statistical significances depending on each estimator considered.

There might be several explanations why the effects of FTAs do not materialize in Korean export of cosmetics to the ASEAN market. Firstly, the usage of dummy variable is a rather crude way of measurement in this case. When trading partners make free trade agreements the tariff rates of some products drop im- mediately but in other product lines the tariff rates decrease gradually over the years according to the agreed schedule.

Thus, the dummy variable cannot reflect the effects of gradual

decrease of tariff rates over the years. Secondly, each FTA

partner has different trade policies and market conditions. It is

possible that some countries, even before making an FTA, may

(7)

have already maintained zero tariff rates in the cosmetics prod- uct lines. In this case initiating a new FTA does not affect the trade volume of cosmetics. Therefore, the FTA dummy variable cannot fully represent the market opening status of the specific industry in the import countries and so the result could be in- terpreted taking this caution into consideration.

The most striking feature of the analysis is the consistently positive and significant results of the Google Trends variable throughout all the estimators. It is evident from the results that South East Asian people’s interests in Korean cultural contents do affect their buying behavior of Korean cosmetics, as different from people in other parts of the world.

5. Conclusion

This paper uses a new variable to present some of the first evidence on the trade creation effects of the Korean wave on the cosmetics industry. The adoption of the Google Trends search query as a proxy variable for cultural affinity is a noble approach. As increasing number of people around the world uses the Internet for searching information or entertainment pur- poses, the analysis of search queries of the most popular web- site, Google, in connection with cultural affinity seems an appro- priate and timely task in the field of international trade. The great advantage of using Google trends as a proxy variable is that the data reflect the changing patterns of users’ searching behavior while other proxy variables in general are time invariant.

Using the gravity model, this paper firstly analyzed the data of the Korean cosmetics export to 74 countries around the world. Whereas economic sizes of Korea and import countries, geographical distance, and the presence of free trade agree- ments show statistical significance, Google Trends search query of ‘Korean drama’does not reveal a clear correlation with Korean cosmetics export. When the export destination countries were narrowed to 9 ASEAN member countries, the results show strong evidence that the Korean wave indeed leads to the ex- port of Korean cosmetics.

There can be several implications drawn from the study.

Firstly, besides the traditional proxy variables used in the gravity model for cultural affinity such as common languages, colonial experience, and ethnic ties, Google trends query data can be- come another important proxy variable. Secondly, the Korean wave’s contribution to the export of Korean cosmetics is evident in Asian countries but not clear in other part of the world in general. Since the Korea wave has risen high mainly in Asian countries and cosmetics export to the region also increased dra- matically, the finding is consistent with the general assumption.

Thirdly, Korean free trade agreements with many countries paid off in the cosmetics industry. Whereas the Korean wave greatly contributed to increasing consumption in the Asian market, FTA is a more important factor in exporting cosmetics to the world market.

Lastly, in addition to the star marketing method, Korean cos-

metics companies can put more emphasis on advertising through social networks such as Facebook, Instagram and Line as cultural contents have increasingly been shared this way by people around the world.

Further researches could extend the method and findings of the study. In particular, in addition to cosmetics industry covered in this paper, other industries can be examined using Google Trends proxies. Also, besides ‘Korean drama’, other Google Trends query keywords can be tested to find the most appro- priate term according to the research themes and purposes.

References

Alexander, J. (2011). Beauty Products in Asian Market Culture.

BADM 395 Consumer Behavior. West Virginia: Shepherd University.

Anderson, J.E., & Van Wincoop, E. (2001). Gravity with gravitas:

a solution to the border puzzle. NBER Working Paper No. 8079.

Askitas, N., & Zimmermann, K.F. (2009). Google econometrics and unemployment forecasting. German Council for Social and Economic Data (RatSWD) Research Notes, 41.

Bala, V., & Van Long, N. (2005). International trade and cultural diversity with preference selection. European Journal of Political Economy, 21(1), 143-162.

Blum, B.S., & Goldfarb, A. (2006). Does the internet defy the law of gravity?. Journal of International Economics, 70(2), 384-405.

Boisso, D., & Ferrantino, M. (1997). Economic distance, cultural distance, and openness in international trade: Empirical puzzles. Journal of Economic Integration, 12(4), 456-484.

Choi, H., & Varian, H. (2012). Predicting the present with goo- gle trends. Economic Record, 88(s1), 2-9.

Combes, P-P., Lafourcade, M., & Mayer, T. (2005). The trade-creating effects of business and social networks:

evidence from France. Journal of International Economics, 66(1), 1-29.

Disdier, A-C., & Head, K. (2008). The puzzling persistence of the distance effect on bilateral trade. The Review of Economics and Statistics, 90(1), 37-48.

Eichengreen, B.J., & Irwin, D.A. (1998). The role of history in bilateral trade flows: The regionalization of the world economy. Chicago: University of Chicago Press, 33-62.

Eysenbach, G. (2006). Infodemiology: tracking flu-related search- es on the web for syndromic surveillance. AMIA Annual Symposium Proceedings Volume 2006. American Medical Informatics Association, 244-248.

Feenstra, R.C. (2004). Advanced International Trade: Theory and Evidence. New Jersey: Princeton University Press.

George, J.S., & Becker, G.S. (1977). De gustibus non est disputandum. The American Economic Review, 67(2), 76-90.

Ginsberg, J., Mohebbi, M.H., Patel, R.S., Brammer, L.,

(8)

Smolinski, M.S., Brilliant, L. (2009). Detecting influenza epidemics using search engine query data. Nature, 457, 1012-1014. doi: 10.1038/nature07634.

Grossman, G.M. (1998). Comment on Deardoff, in Jeffrey A. F.

The Regionalization of the World Economy, NBER Project Report. Chicago: The University of Chicago Press. pp. 29-31.

Head, K., & Mayer, T. (2014). Gravity Equations: Workhorse, Toolkit, and Cookbook, Chapter for the Handbook of International Economics, Vol. 4, 131-195.

Kang, C-K. (2012). The Cosmetics Industry Adopts a High-Tech Makeover. Seri Quarterly, 5(3), 99-103.

Kim, J-G., & Ahn, S.Y. (2012). An empirical study on effects of Korea’s cultural exports. Journal of Korea Trade, 16(2), 25-48.

Korea Creative Content Agency (2015). Report on content in- dustry statistics. Retrieved March 5, 2015, from http://www.kocca.kr

Korea Customs Service (2015). Korea cosmetics export statistics. Retrieved April 16, 2015 from

http://www.customs.go.kr/kcsweb/user.tdf?a=user.newTrade statistics.NewTradestatisticsApp&c=1001&mc=STATS_INQ U_TRADE_010

Korea Health Industry Development Institute (2015). Korea cosmetics export statistics. Retrieved April 15, 2015 from http://khiss.go.kr/treeManager.do?task=treeFrm&vw_cd=MT _ ITITLE&list_id=358_C &h

txt_code=12536971932186930964991651009680

Leamer, E. E., & Levinsohn, J. (1995). International trade theo- ry: the evidence. Handbook of International Economics, 3, 1339-1394.

Li, E.P.H., Min, H.J., Belk, R.W., Kimura, J., Bahl, S. (2008).

Skin lightening and beauty in four Asian cultures.

Advances in Consumer Research, 35, 444-449.

McCallum, J. (1995). National Borders Matter: Canada-U.S.

Regional Trade Patterns. American Economic Review, 85(3), 615-623.

Melitz, J. (2008). Language and foreign trade. European Economic Review, 52(4), 667-699.

Miroudot, S., Sauvage, J., Shepherd, B. (2013). Measuring the cost of international trade in services. World Trade Review, 12(4), 719-735.

Obstfeld, M. & Rogoff, K. (2000). The Six Major Puzzles in International Macroeconomics. Is There a Common Cause?. In B.S. Bernanke and K. Rogoff (Eds.), NBER:

Macroeconomics Annual 2000 (pp. 339-390). Cambridge, MA: MIT Press.

Park, S., & Choe, J. I. (2009). The Trade Creation Effects of Hallyu. Bank of Korea Economic Research Institute:

Economics Analysis, 15(1), 73-96.

Park, Y.S. (2014). Trade in Cultural Goods: A Case of the Korean Wave in Asia. Journal of East Asian Economic Integration, 18(1), 83-107.

Rauch, J.E., & Trindade, V. (2002). Ethnic Chinese networks in international trade. Review of Economics and Statistics, 84(1), 116-130.

Rauch, J.E., & Trindade, V. (2009). Neckties in the tropics: a model of international trade and cultural diversity.

Canadian Journal of Economics, 42(3), 809-843.

Redding, S., & Venables, A.J. (2004). Economic Geography and International Inequality. Journal of International Economics, 62(2004), 53-82.

Rose, A.K. (2000). One money, one market: the effect of com- mon currencies on trade. Economic Policy, 15(30), 8-45.

Shepherd, B. (2013). The gravity model of international trade: A user guide. Bangkok: United Nations publication.

Tinbergen, J. (1962). Shaping the world economy; suggestions for an international economic policy. New York:

Twentieth Century Fund.

Wagner, D., Head, K., & Ries, J. (2002). Immigration and the Trade of Provinces. Scottish Journal of Political Economy, 49(5), 507-525.

Appendix: List of Countries

Argentina Hong Kong Pakistan

Australia Hungary Philippines

Austria India Poland

Azerbaijan Indonesia Portugal

Bahrain Iran Puerto Rico

Bangladesh Ireland Qatar

Belgium Israel Romania

Brazil Italy Russia

Brunei Japan Saudi Arabia

Bulgaria Jordan Singapore

Cambodia Kazakhstan Slovak Republic

Canada Kuwait South Africa

Chile Lebanon Spain

China Lithuania Sri Lanka

Colombia Macao Sweden

Cyprus Malaysia Switzerland

Czech Republic Mexico Taiwan

Denmark Mongolia Thailand

Ecuador Morocco Turkey

Egypt Myanmar UAE

Estonia Nepal UK

Finland Netherlands Ukraine

France New Zealand United States

Germany Nigeria Vietnam

Greece Norway

수치

Table 3 shows the descriptive statistic in which the total ob- ob-served number of variables is 666, except for Trends with 278 observed variables
Table 5 shows the estimation results for Korean export of cosmetics to 9 ASEAN member countries

참조

관련 문서

MP Yousef Al-Fadalah, Supervisor of Parliament Business Environment Committee declared that the Public Institution for Housing Care intends to dedicate nearly 150

&#34;Naming the State of Kuwait to be Speaker of the Asian Group reflects the trust and confidence of member states in the important and active role played by Kuwait

Due to the heavy downpours during the coming few hours, and anticipations of Meteorological Department that weather fluctuation shall continue, it has been decided

Kuwait Direct Investment Promotion Authority (KDIPA) said the 2019 Doing Business Report of the World Bank Group, came in recognition of the reforms made between June 2, 2017, and

organic matter Improve plant.

The Process of Economic Growth in Korea How Korea Dealt with the Economic Crisis Korean Companies.. Future Growth Engine and Policy Direction.. The Korean Economy Now..

In a statement to Kuwait News Agency (KUNA) on the sidelines of a meeting of the Arab Parliament's Foreign Affairs Political and National Security

The meeting was attended by Assistant Foreign Minister for GCC Affairs, Ambassador, Nasser Al-Muzayyen, and Deputy Assistant Foreign Minister for the Office of the