• 검색 결과가 없습니다.

Implementing a Sustainable Decision-Making Environment - Cases for GIS, BIM, and Big Data Utilization -

N/A
N/A
Protected

Academic year: 2021

Share "Implementing a Sustainable Decision-Making Environment - Cases for GIS, BIM, and Big Data Utilization -"

Copied!
10
0
0

로드 중.... (전체 텍스트 보기)

전체 글

(1)

Implementing a Sustainable Decision-Making Environment

- Cases for GIS, BIM, and Big Data Utilization -

Kim, Hwan-Yong

1)

Received September 3, 2016; Received September 21, 2016 / Accepted September 21, 2016

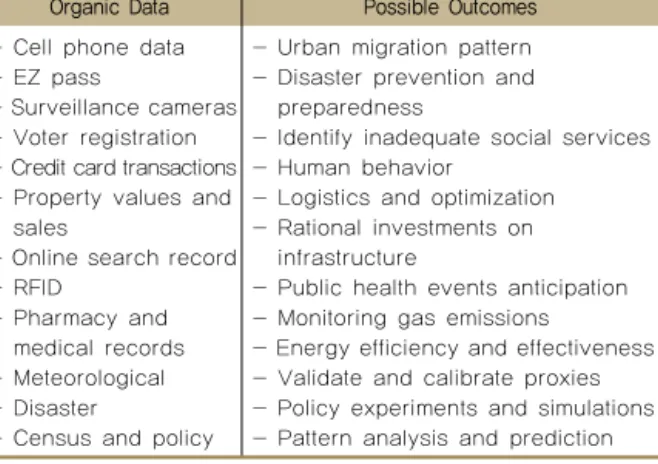
ABSTRACT: Planning occurs from day-to-day, small-scale decisions to large-scale infrastructure investment decisions. For that reason, various attempts have been made to appropriately assist decision-making process and its optimization. Lately, initiation of a large amount of data, also known as big data has received great attention from diverse disciplines because of versatility and adoptability in its use and possibility to generate new information. Accordingly, implementation of big data and other information management systems, such as geographic information systems (GIS) and building information modeling (BIM) have received enough attention to establish each of its own profession and other associated activities. In this extent, this study illustrates a series of big data implementation cases that can provide a lesson to urban planning domain. In specific, case studies analyze how data was used to extract the most optimized solution and what aspects could be helpful in relation to planning decisions. Also, important notions about GIS and its application in various urban cases are examined.

KEYWORDS: Decision Support Systems, Urban Planning, Geographic Information Systems, Big Data, Decision Sciences 키워드: 지리정보시스템, 빅데이터, 정보모델링, 의사결정모형, 지속가능성

1)정회원, 인천대학교 도시건축학부 교수 ([email protected]) (교신저자)

DOI: http://dx.doi.org/10.13161/kibim.2016.6.3.024

1. Introduction

Planning occurs from day-to-day, small-scale decisions to large-scale infrastructure investment decisions. For that reason, various attempts have been made to appropriately assist decision-making process and its optimization. Lately, initiation of a large amount of data, also known as big data has received great attention from diverse disciplines because of versatility and adoptability in its use and possibility to generate new information. Accordingly, implementation of big data and other information management systems, such as geographic information systems (GIS) and building in- formation modeling (BIM) have received enough attention to establish each of its own profession and other associated activities.

In addition to the attentions focused on information and its management systems, sustainability has long been a main issue of world development and its operation at large (Arnott & Pervan, 2005). Despite the fact that the main attention

seems to be slightly weighted more on to the environmental aspect (Gorsevski et al., 2013), sustainability is a term containing all of social, economic, and environmental aspects combined.

It means that the gist of the term sustainability and its im- plementation largely intersects with the making optimized decision in every aspect. Therefore, decision optimization and creating balanced solutions may be the key to sustainable developments.

Decision-making process has been challenged by its

“top-down” hierarchy since the 1980s. Participatory democracy,

started in the 1980s changed our perception on decision-

making environment to the “bottom-up” structure (Shen et

al., 2012). This is especially true in the discipline of urban

planning as the financial source and decision’s impact are

largely based on citizens’ taxes and their life. In relation to

information management and participatory decision-making

process, the key may reside on data utilization in the 21

st

century. Identifying a case-by-case solution requires enormous

amount of information, which now can be named as data

(2)

management (McIntosh et al., 2011). Therefore, acquiring big data and devising data management skills are critical to making sustainable solutions and creating participatory environment.

In this extent, this study illustrates a series of big data implementation cases that can provide a lesson to decision- making domain. In specific, case studies analyze how data was used to extract the most optimized solution and what aspects could be helpful in relation to urban decisions. Also, important notions about GIS and its application in various urban cases are examined.

2. The Rise of Big Data

Beginning in the early 2000s, a large amount of attention has been given to big data and its possible use in the future.

Accordingly, a vast number of publications and media press were released to respond to the given interests. There are various studies and associated results about the definition of big data, and they all posses slightly different notions (Fan et al., 2013). However, the core of its use remains similar and the following definition best describes big data’s core principles.

“Big data is high volume, high velocity, and high variety of information requiring new forms of processing to enable decision-making, insight discovery, and process optimization (Fan & Bifet, 2013, p3)”.

As can be seen, the core values of big data are founded on three Vs - volume, velocity, and variety. It means big data has a large capacity with diverse perspectives, enabling fast process to make optimized solutions and new discovery of unknown facts or unanswered problems. Putting into a simpler word, big data can be identified with its diversity.

Then the question becomes why it is in demand lately.

Recently, terms like smart city, ubiquitous city, and intelligent infrastructure have been raised by many professionals. All the terms imply smarter and more knowledge-based processes for built environments. If we flip those words, then we maybe able to think that our current cities may not be as smart as we expected, and for that reason we have to make our city

smarter than the current. This is plausible and perhaps an appropriate way to describe our future.

Fundamentally, however, those terms imply deeper meanings than just smartness. Until the 1990s, when growth is the dominant value for the entire society, especially for developing countries, such as South Korea, China, and so forth, a simple solution that can solve many different tasks was considered a high priority under the name of efficiency (Belton & Stewart, 2002). Beginning in the 21

st

Century, however, more attention was given to the quality of the solutions, and the effectiveness has become more of a virtue. As the society became much more complex than the early 20

th

Century and more diversified problems are given to experts, customized and qualified solutions are welcomed. As a result, having diverse inputs from stakeholders and customization of the given problems have become an important aspect of decision-making process. Below two statements would summarize ideas of 21

st

Century decision-making process.

- User-oriented participation enables more reliable solutions for complex problems.

- Participation and customization better promote optimization process for a particular circumstance.

Therefore, identifying cases where participation and customization have become a new horizon to the existing problems, and providing more reliable and improved solutions would support the above statements.

3. Applications of Information Management Systems and Its Possibilities

Gap Inc. (Gap) is an American worldwide clothing and accessories retailer founded in 1969. Gap has been a popular firm with its affordable pricing mechanism and modern styling.

Before 2000, Gap has experienced a huge growth in its

revenue because of its leader role in instant fashion. Since

the 2000s, however, other similar retailers have launched

and Gap’s growth was gradually stagnated (Uran & Jensen,

2003). To overcome company’s decline, Gap has decided

to adjust its online platform to market’s demand and created

a routine that eventually elevated company’s revenue and

future.

(3)

Gap has recognized they need to change their marketing strategy based on the facts that their customers reveal everyday at their on and off-line stores (Keller et al., 2012).

Creating a mechanism that allows Gap to collect a brief preference on their merchandise, Gap started to adjust their marketing strategy. Whenever a customer pickups a merchandise from a Gap store, an employee asks for an email address to provide sales and coupon information. After that, ZIP code will be asked to the customer and it is completely voluntary to provide each of customer’s information. When these two simple steps are done, an employee starts to scan customer’s items and charge for the price. This seems like a simple process with the minimum interference to customers’ shopping experience. However, there are three reasons for this processes to become a very effective solution to find out customer’s preference on Gap merchandises.

First, whenever a customer agrees upon providing email address, it becomes an unique identification (ID) of that particular person. This ID can become a mark of collecting information about Gap merchandise on that particular person.

Once items are scanned and amounts are paid off, then the ID records the list of items that a particular customer has purchased, amount of money one purchases at a shopping, and preferences on the types of Gap merchandises. If that particular customer visits Gap store more than once, than it will become a longitudinal data and the reliability of the information becomes much higher.

Second, once the customer also agrees to provide ZIP code of her/his residence, the ID and other associated information becomes spatial. It does not suggest specific location information, but ZIP code reveals approximate boundaries of that customer’s geographic location. With the given information and other collected data about that customer’s shopping preference, then Gap can expect similar shopping patterns of that area and can conduct similar marketing strategy. Because residential areas are usually homogeneous in terms of background, family size, and so forth, this type of approach generally works well in many cases.

Finally, using the above two types of information, Gap sends out online coupon and other sales information that is tailored to a particular customer. For example, if a person shops blue jeans generally, then sending out chinos or suite information would not grab one’s attention. Rather, if Gap

provides more coupons or sales information about their blue jeans, then it will surely increase the probability of exposing their marketing strategy to the customer.

Implementing these two steps into shopping process created acknowledgeable results. Since 2009, Gap Inc. has experienced 20% annual increase in its online sales. Considering the fact that Gap makes about $16 billion per year for their total revenues, these numbers show an impressive result (Fan et al., 2013). Although the increase percentage has became slightly lower compare to 2009, Gap is still enjoying its steady growth in its online market.

4. Data Capacity and Possibility

Examples like Gap draws an attention of using data- oriented strategy and its effectiveness, and for this success, many are looking for similar approach to increase its capacity in business as well as research activities. According to SAS, a private firm providing statistical solutions, there are about 2.8 zetabytes of data that we produce as of year 2012.

Considering the fact that one zetabytes is 1 billion terabyte, this is an enormous amount. Among these 2.8 zetabytes, about 0.9 zetabytes, which is about 33% of the total, are useful information. With the give levels of technology and the ability to connect and gather information, only 33% are considered helpful information to use. In addition, if we consider the level of details that we now have for the use in data analysis, only 0.5% (about 4,500,000 terabytes) out of 0.9 zetabytes are considered appropriate for data analysis (Keller et al., 2012). All these numbers indicate that the matter of big data analysis is in the quality of the data we can obtain and analyze, not in the quantity of the data we have to collect.

With the amount of data, scholars are anticipating a number of possibilities for future use. According to Keller et al. (2012), there are about 12 categories that we could expect to do by utilizing big data and table 1 summarizes the results.

As can be seen, raw data are based on everyday uses

and most of them are already utilized by many users. For

example, credit card transactions, online search records,

property values, and medical records are frequent examples

of daily basis information and thus, easy to acquire, unless

(4)

Table 1. Organic data sources with expected possibilities Organic Data Possible Outcomes - Cell phone data

- EZ pass

- Surveillance cameras - Voter registration - Credit card transactions - Property values and

sales

- Online search record - RFID

- Pharmacy and medical records - Meteorological - Disaster

- Census and policy

- Urban migration pattern - Disaster prevention and

preparedness

- Identify inadequate social services - Human behavior

- Logistics and optimization - Rational investments on

infrastructure

- Public health events anticipation - Monitoring gas emissions

- Energy efficiency and effectiveness - Validate and calibrate proxies - Policy experiments and simulations - Pattern analysis and prediction

Figure 1. New York city taxi on-off locations there is an ethical issue involved. With the given raw data,

many customized information can be generated and therefore, more optimized and tailored solutions are extracted for a particular problem.

Smart city is a term frequently used in the latest city research works, identifying more efficient and effective use of resources to the residents and to the built environment.

Instead of just providing fact-based data to citizens, smart cities try to suggest an alternatives or other solutions that can solve a particular challenge. For example, if traffic congestion is identified, current navigation systems generally provide where the congestion areas are located (Karacapilidis, 2006). In smart cities, however, navigations systems try to provide an alternative routes that can avoid congestion and move to lesser congested areas. This can be possible with the information created based on the data gathered above.

It means the success and failure of a smart city implementation may depend on how big data is utilized and how they are processed to create new, useful information.

5. GIS, Big Data, and Decision-Making

It seems like the amount of data is not an issue in the big data implementation. Rather the problem arouses on the quality of the data we use. In terms of urban issues, the quality depends on the locations of problems. If location information is not associated with the data, then it could be vague and unidentifiable for a particular issue elevated.

Urban problems are spatial in nature, missing geographic information may not provide an effective solution.

In this extent, geographic information systems (GIS) can

become a new tool for urban problems, providing location information and spatial solutions. Therefore, relating GIS and big data became a new era for urban planning and city management. Similar notion can be found in Building Information Modeling (BIM). As GIS and BIM are similar in their essential, BIM can play a vital role with big data implementation in facility planning, detailing, management, and constructing.

Once location information is merged with socio-economic data, then the possibilities of use are very wide in urban settings. A good example can be found in logistics. UPS, a worldwide logistics solution firm, created its own navigation system, ORION (Hill et al., 2005). ORION stands for on-road integration optimization and navigation. Based on cumulative data that UPS has gathered for a long time, UPS has identified frequent accident areas, faster ways to get to the destinations, efficient package distribution and delivery, route optimization, and so forth. Since ORION system initiation, UPS drivers have experienced about 136 million kilometers per year reduction in their driving mileage. This reduction in driving range created a direct impact on fuel economy and UPS was able to save about 319 million liters per year in their gasoline consumption, which was about $30 million in 2011.

Another good example of implementing location data in

urban problems can be found in New York city’s taxi

management. New York city is one of the most famous

tourists destinations and one of the most densified cities in

the world. For that reason, the city shows high congestion

rates, especially for the tourists attractions. To resolve high

traffic congestions, New York city has decided to check its

taxi uses and identified where most taxis are usually occupied

with the specific time frame. Figure 1 shows where most taxis

(5)

Figure 2. UNOP process and the final output operate and the darker areas are where most of passengers

drop off or pick up their taxis during the rush hours (Brucker et al., 2011). With the given information, New York city decided to do two things. First, they allocated more taxis into the darker areas so that passengers and tourists do not feel hassles in public transportation. The problem, however, was that the areas congestion became worse because of increased taxi movements. Therefore, the city decided to do a completely different approach. They regulated taxis and provided the minimum amount in that area during the rush hours. This second approach changed passenger activities to mass transportation, such as subway or buses.

Eventually, congested areas have experienced less traffic counts compared to the previous.

As can be seen in the previous examples, having location information is an essential part of solving urban issues. In addition, location specifics in association with time information could surely enlarge the possibilities of providing optimized solutions to the given problems. The previous two examples well illustrate such possibilities. For this reason, GIS can be an effective tool for urban decision-making. Especially, when public participation is considered, GIS can play a vital role in decision assistant and output generation.

6. Waves of GIS Implementation in Decision- Making

GIS has a long history enough to establish its own academic and professional field. Since its initiation, GIS has become an important role in geography areas. The horizon has become much wider recently and other disciplines, such as urban planning, public health, landscape architecture, and architecture are experiencing more possibilities with GIS implementation. In terms of decision-making aid, GIS can be categorized into three waves depending on the level of active usage (Ascough et al., 2002).

1

st

Wave: GIS as a supporting document 2

nd

Wave: GIS as an interactive database 3

rd

Wave: GIS as a communication device

The most distinctive characteristics of the 1

st

wave of GIS stands on its limited use. Although GIS is an interactive application in nature, the 1

st

wave utilized GIS as just a

supporting tool. It means the dominant use of GIS in urban problems was mostly paper-based maps, providing background information. Using marker, pens, tracing papers, and so on, GIS was supporting decision makers to change information.

There was no database management, no data storing ability, or no information creation. After certain decisions are made with the fixed information in GIS form, technicians revise GIS data with the given decisions and implement into a computer-based GIS format (Chen et al., 2010). If revision is required, then it will be reproduced as a hard copy again.

A good example of the 1

st

wave can be found in the recovery plan of New Orleans, U.S.A. after the Katrina in 2005. Once hurricane Katrina hit New Orleans, the city was almost demolished and most of urban functions were diminished. Eventually, almost all residents had to evacuate to other nearby cities. To reestablish the city, the city of New Orleans took a slightly different approach compared to the traditional urban planning process. They decided to open a large participatory planning process using communication devices. The Unified New Orleans Plan (UNOP) engaged over 4,000 citizens who have evacuated to other cities and developed a collaborative recovery plan. To facilitate decision- making process, UNOP provided background maps and using technologies, such interactive clickers, TVs, and real-time internet, all the decision-making process was broadcasted to the participants. During the process, GIS was used as a background information and provided useful location and spatial data to assist the participants. GIS was implemented to just describe the current information and to implement the final decision made with other collaborative tools. There were no information database or knowledge-base for future use (Gorevski et al., 2013). Figure 2 illustrates the final map output with the decision-making process.

The difference between the 1

st

wave and the 2

nd

wave

is on its capability of information storing, retrieving, and

eventually management. Unlike the 1

st

wave, the 2

nd

wave

(6)

Figure 3. Circular process of the 2

nd

wave GIS

Figure 4. Recently announced four scenarios of the ECT

of GIS as a decision-supporting tool was closer to a combination of a charrette and information system. It is still a supporting tool, but in a more interactive and informative implementation. The process of using the 2

nd

wave GIS is circular, rather than one-time, straight forward process (Graymore et al., 2009). The entire decision-making process is not about defining the correct answer, but more about optimizing the solution that fits with the given circumstance and for future use. Instead of creating one-time information that is only used when necessary decisions are in demand, the 2

nd

wave tried to create a database that is always accessible, providing easy storing options and convenient retrieving mechanism. In addition, once database is established, this is the foundation to the related stakeholders and could be utilized for further use. Therefore, cumulative nature is one of the most critical distinctions of the 2

nd

wave GIS.

Figure 3 illustrates the circular process of the 2

nd

wave GIS decision tool.

A good example of the 2

nd

wave implementation is the Envision Central Texas (ECT). ECT was a participatory urban planning process for Austin, TX, creating a comprehensive plan for the city until 2050. Started in 2001, the ECT was a citizen-oriented collaboration to answer one simple question – what would Austin’s future look like in year 2050? By addressing regional issues of five nearby counties, Bastrop, Caldwell, Hays, Travis, and Williams, the ECT tried to depict all the counties’ sustainable and collaborative future. Using GIS and design charrette, people gathered ideas and opinions about their cities and environment. During the process, all

the necessary data were provided and all the subsequent information that was newly created by the citizens, experts, and other stakeholders was digitally stored in the database management system (Kim, et al., 2014).

This is a meaningful attempt as the city and citizens have built up their foundational information about their regional and city-wide issues in a database format. They are able to retrieve this vast amount of data to update, modify, add, delete, and so forth. Not many cities in the world are prepared for such flexibility and adoptability in urban and environmental data. What makes the ECT unique is its capability of creating and managing the database. ECT still used similar format of participatory planning and GIS was still closer to a supporting tool. However, the ECT created a database that can play as the foundation to more evidence-based col- laborative decision-making process. It took about 10 years to finish the process and the ECT recently announced four different future scenarios about the regions in 2050. Figure 4 shows the output of 10 years work from the ECT. All of these scenarios are completely based on consensus among participants and for this reason, the results are sustainable in nature.

The last, 3

rd

wave of GIS as a decision-making tool does

not have a solid theoretical foundation yet. Because of its

changing technology, the 3

rd

wave still needs to be defined

with specific norms. However, the main theme of the 3

rd

wave

is generally understood as mobility. With the expanding

technology, the 3

rd

wave of GIS tends to have mobility in

its decision-making environment. Using the cloud computing

and mobile application on smartphones or tablet PCs, the

GIS environment became more flexible and mobile.

(7)

Figure 5. 8 Steps in scenario planning In the traditional decision-making environment, especially,

under the domain of participatory planning, stakeholders had to meet in person and spend long time discussing about the issues. It means the traditional decision-making environment, such as public hearing or design charrette require a physical space that can hold all the stakeholders into the same place.

In addition to the space requirements, this way of meeting demands enormous amount of inputs from technical assistant as well as administrative and professional staffs. In many cases, however, finding a space that can house all the stakeholders and setting up the time when most of the stakeholders could participate become a very difficult task.

Especially, as far as the time is concerned, some people find it difficult to come to the meeting because of their job status or different working hours. In this case, public hearing or design charrette cannot be claimed to represent the entire community’s opinion. This is one of the reasons that the ECT took almost 10 years to establish their comprehensive plans.

To overcome the restrictions in physical settings and time allotment, the 3

rd

wave is designing its system architecture adjustable to the mobile environment. The Environmental Systems Research Institute (ESRI), the largest supplier of GIS software, provides a cloud storage for all the registered users. This storage can be accessed from all over the world as long as the internet connection is provided (Gorsevski et al., 2012). It means all the users and analysts do not need to carry their own data for work. All they need is a decent connection to the worldwide web. In addition to this online storage, ESRI also developed a mobile application that works with smartphones and tablet PCs (Demesouka et al., 2013).

In accordance with the cloud storage and the mobile application, GIS has become extremely flexible in terms of its operation.

In general, GIS requires a heavy specification of computer settings and for this reason, only well-equipped personal computers could operate and execute the software. For now, as the cloud computing and mobile technology are merged for a mobile GIS environment, decision-making with GIS has become flexible and adoptable to many different circumstances, that were once considered a limitation in the previous decision-making environment.

One possibility of using mobile GIS environment in decision- making process would be the scenario planning. Scenario

planning is a way to depict the outcomes based on the scenarios that are established by the participants (Kim et al., 2014). To collect inputs from stakeholders, traditional ways of meeting, such as charrette or public hearing should be organized. However, with the implementation of mobile GIS, necessary interactions among stakeholders can be placed in online, needing the minimum amount of physical settings for effective communication. In this case, stakeholders who did not usually participate in the meetings because of their personal circumstances could also raise their opinions.

In many cases, scenario planning is conducted in 8 steps:

1) Input selection; 2) Data mining; 3) Input classification; 4) Input grouping; 5) Scenario development; 6) Modeling; 7) Impact assessment; and 8) Alternative selection (Coutinho- Rodriguez et al., 2011). In some cases, step 3 and 4 are merged into one, providing more succinct decision-making process, but all 8 steps are fully used in general. Of these steps, Input selection, Input classification, Scenario development, and Output selection may be the points where stakeholders’

opinions are heavily required. Figure 5 illustrates the entire steps of scenario planning and the points where public participation is in demand. It means if we could provide a mobile platform that can collect opinions of all the stakeholders during those four steps, the entire scenario planning process will become more reliable. In addition, if brief outputs about each stakeholder’s choice are immediately provided on mobile basis, it will help understand the consequences about each of their inputs from the beginning, and allow revising their thoughts. This is only plausible when mobile architecture of GIS environment is defined as the 3

rd

wave of GIS implementation.

Another advantage of using mobile GIS and the latest

planning technology is in its results representation. In general,

scenarios are illustrated with 2 dimensional outputs. However,

the latest movements in GIS industry allowed scenarios to

be presented in 3 dimension and thus, providing a better

(8)

Figure 6. CommunityViz scenario planning and 3d

presentation Figure 7. AR and VR examples

Figure 8. Virtual singapore platform readability to the stakeholders. An innovative firm, Placeway

developed an extension to GIS named after CommunityViz (Rybarczyk & Wu, 2010). It is a similar scenario planning device that experts have used for a long time. What makes unique about the CommunityViz is that it has a capability to illustrate scenario outputs in 3 dimension. This is a meaningful result because urban problems are generally in a large scale and thus, hard to make it in 3D. Figure 6 shows CommunityViz scenario planning capability with 3D output presentation. In association with the augmented reality that is highly focused in now days, CommunityViz will provide a new era on scenario planning.

7. Possibilities and Directions

Lately, growing attention is paid to the augmented reality (AR) and virtual reality (VR). Because of a thick layer of cumulated information and wide usage of personal smartphones, diverse possibilities are assessed in AR/VR industry. AR and VR sometimes indicate similar definitions, but they do have distinctions. In many cases, AR is based on reality, meaning that AR gives a virtual experience that is based on reality.

A good example would be the illustration we often see in soccer game in TVs. When a kicker prepares for a freekick, broadcasts often show the distance from the goal keeper and the presentation of this information is based on reality.

On the other hand, VR is completely based on virtual circumstances. A good example could be found in the movie Avatar where VR and reality combines together and the entire story is based on the conflicts between the two.

Figure 7 explains the two examples.

In association with big data and decision-making, AR/VR can provide a new vision for sustainable decision-making environment. As briefly mentioned in 3

rd

wave of GIS, AR can immediately illustrate scenario outputs in 1:1 scale,

which is not a frequently adopted approach in previous experiences. If real world scale is utilized in depicting scenario alternatives, diversified solutions can be prepared before it becomes reality (Rodrigues et al., 2011). In this extent, AR in association with big data, GIS, and BIM could become an important tool for urban decision-making process.

A good example can be found in the Virtual Singapore (VS) project. The Singapore government in coordination with the Singapore National Research Institute, have invested about $5 million to create a completely digitalized Singapore in 3D. Since Singapore is closer to a city, rather than a nation, the effect of having a 3D model of the entire country has a large amount of benefits. With the model, the Singapore government can simulate any urban events that can affect the sustainability of Singapore. For example, transportation impact analysis or environmental impact analysis can be done with precise measurements and reality-based simulations.

Doing such could greatly enhance the decision-making capability and reduce unknown risks that the future should bear. The government is concentrating this model in four major purposes: 1) virtual simulation; 2) virtual test-bed; 3) decision-making and urban planning; and 4) research and developments (Shen et al., 2012). Figure 8 shows VS platform.

8. Conclusions

As can be seen, big data has become a wide utilization

with technological improvements. In association with the

AR/VR, GIS, and BIM, it could greatly enhance decision-making

(9)

process, especially for the urban and regional problems.

Many innovative firms are already moving forward to implement big data into their business platforms. Navigation systems, transportation management, and merchandise tailoring are good examples where cumulative data meets a new opportunity to generate social and economic benefits.

In addition, detailed use of GIS in decision-making process is examined to identify mobile-based, improved decision- making environment. Of those three waves, the 3

rd

wave would become a new horizon for sustainable decision-making environment. Public participation has become a new norm for public decisions and the traditional approaches, such as design charrette or public hearing clearly have limitations in their physical requirements. On the other hand, mobile GIS could relieve the restrictions on previous experiences and advance the decision-making environment to a more inclusive and coordinated setting.

For information management experts, this notion should be constantly studied and analyzed to make progresses on sustainable decision-making tools. In conjunction with other technical advances, big data could open up a new market, suggesting a more sustainable and balanced decision-making environment. Simulation has become a wide use and the foundation for a better simulation highly depends on data utility and the quality of the data implemented. In this extent, providing more insights on the crossing boarders of big data, BIM, GIS, and AR/VR would be a critical part for decision sciences and urban and architectural studies in the future.

References

Arnott, D. and G. Pervan. (2005). A Critical Analysis of Decision Support Systems Research. Journal of Information Technology 20(2), pp. 67-87.

Ascough, J. C., H. D. Rector, et al. (2002). Multicriteria Spatial Decision Support Systems: Overview, Applications, and Future Research Directions. Systems Research1, pp.

175-180.

Belton, V. and T. J. Stewart. (2002). Multiple Criteria Decision Analysis: An Integrated Approach. NewYork,NY, Springer.

Brucker, D. K., C. Macharis, et al. (2011). Multi-Criteria Analysis in Transport Project Evaluation: An Institutional Approach. European Transport47, pp. 3-24.

Chen, Y., J. Yu, et al. (2010). Spatial Sensitivity Analysis of Multi-Criteria Weights in GIS-Based Land Suitability Evaluation. Environmental Modelling & Software 25(12), pp. 1582-1591.

Coutinho-Rodrigues, J., A. Simao, et al. (2011). A GIS-Based Multicriteria Spatial Decision Support System for Planning Urban Infrastructures. Decision Support Systems 51(3), pp. 720-726.

Demesouka, O., A. Vavatsikos, et al. (2013). Suitability Analysis for Siting Msw Landfills and Its Multicriteria Spatial Decision Support System: Method, Implementation and Case Study. Waste management 33(5), pp. 1190-1206.

Fan, Wei. and Albert Bifet. Mining big data: current status, and forecast to the future. ACM sIGKDD Explorations Newsletter 14.2 (2013), pp. 1-5.

Gorsevski, P. V., S. C. Cathcart, et al. (2013). A Group-Based Spatial Decision Support System for Wind Farm Site Selection in Northwest Ohio. Energy Policy55, pp.

374-385.

Gorsevski, P. V., K. R. Donevska, et al. (2012). Integrating Multi-Criteria Evaluation Techniques with Geographic Information Systems for Landfill Site Selection: A Case Study Using Ordered Weighted Average. Waste management 32(2), pp. 287-296.

Graymore, M. L. M., A. M. Wallis, et al. (2009). An Index of Regional Sustainability: A GIS-Based Multiple Criteria Analysis Decision Support System for Progressing Sustainability. Ecological Complexity6(4), pp. 453-462.

Hill, J. M., R. Braaten, et al. (2005). Multi-Criteria Decision Analysis in Spatial Decision Support: The Assess Analytic Hierarchy Process and the Role of Quantitative Methods and Spatially Explicit Analysis. Environmental Modeling

& Software 20, pp. 955-976.

Karacapilidis, N. (2006). An Overview of Future Challenges of Decision Support Technologies. Intelligent Decision-Making Support Systems. N.D.J.Gupta, F.A.G. and M.T.M. London, Springer.

Keller, Sallie Ann, Steven E. Koonin, and Stephanie Shipp.

Big data and city living: what can it do for us?.

Significance 9.4 (2012). pp. 4-7.

Kim, H., D. F. Wunneburger, et al. (2014). Optimizing High-

Speed Rail Routes Using a Spatial Decision Support

System (SDSS): The Texas Urban Triangle Case. Journal

(10)

of Transport Geography 34, pp. 194-201.

McIntosh, B., J. Ascough II, et al. (2011). Environmental Decision Support Systems (Edss) Development–Challenges and Best Practices. Environmental Modelling & Software 26(12), pp. 1389-1402.

Rybarczyk, G. and C. Wu. (2010). Bicycle Facility Planning Using GIS and Multi-Criteria Decision Analysis. Applied Geography 30(2), pp. 282-293.

Shen, Z., M. Kawakami, et al. (2012). A Planning Support System for Retrieving Planning Alternatives of Historical Conservation Areas from Spatial Data Using GIS. Geospatial Techniques in Urban Planning, Springer: pp. 307-321.

Uran, O. and R. Janssen. (2003). Why Are Spatial Decision

Support Systems Not Used? Some Experiences from the

Netherlands. Computers, Environment and Urban Systems

27, pp. 511-526.

수치

Table 1. Organic data sources with expected possibilities Organic Data Possible Outcomes - Cell phone data
Figure 2. UNOP process and the final outputoperate and the darker areas are where most of passengers
Figure 4. Recently announced four scenarios of the ECT
Figure 5. 8 Steps in scenario planningIn the traditional decision-making environment, especially,
+2

참조

관련 문서

본 논문은 건물의 동선에 대한 정량적 평가기준을 마련하기 위한 하나의 접근방법을 제안하며, 이를 위해 건물정보모델링(BIM, Building Information Modeling)을 이용하여