© 2020 The Korean Ophthalmological Society
This is an Open Access article distributed under the terms of the Creative Commons Attribution Non-Commercial License (http://creativecommons.org/licenses /by-nc/3.0/) which permits unrestricted non-commercial use, distribution, and reproduction in any medium, provided the original work is properly cited.
Original Article
Myopia is the leading cause of vision impairment, affect- ing more than 1.4 billion people worldwide [1-10]. Its preva- lence has been increasing in Asia [1-3,5,7,9-14]. Myopia with a refractive error >-6 diopters (D) or an axial length >26 mm is considered pathologic. It can lead to myopic retinop- athy, characterized by lacquer crack formation, choroidal neovascularization, and chorioretinal atrophy [1-3, Purpose: To investigate macular microvasculature changes using optical coherence tomography angiography
(OCTA) and analyze their correlation with the structural parameters in highly myopic eyes.
Methods: We measured the area of the foveal avascular zone (FAZ) and the parafoveal vessel density in the superficial and deep retinal plexuses using OCTA. The magnification effect of the FAZ area was corrected using Bennett’s formula. Retinal thickness measured at each corresponding area of the OCTA parameters, subfoveal choroidal thickness, and ocular characteristics were reviewed, and the relationships between the microvasculature measurements and the ocular structural characteristics were explored.
Results: Fifty-two eyes with high myopia and 52 normal sex- and age-matched controls were included in the analysis. The FAZ area was significantly larger in the myopic eyes (p = 0.023). The superficial parafoveal vascular density was significantly decreased (p = 0.007) in the myopic eyes compared with the normal eyes, whereas there was no significant difference in the deep parafoveal vascular density (p = 0.226). Regarding the retinal thickness, only the parafoveal inner retinal thickness was significantly smaller in the myopic eyes than in the normal eyes (p = 0.023). The FAZ and subfoveal choroidal thickness were significantly correlated with the axial length, and the parafoveal inner retinal thickness was significantly correlated with the superficial parafoveal vascular density (all p < 0.05).
Conclusions: The FAZ was enlarged and the parafoveal vascular density was reduced in the highly myopic eyes. The decrease was prominent in the superficial capillary plexuses and well-correlated with the retinal thickness profiles. The macular microvascular network alteration may be attributed to the ocular axial elonga- tion that occurs with myopia.
Key Words: Foveal avascular zone, Macular microvasculature, Myopia, Optical coherence tomography angi- ography
Received: September 11, 2019 Final revision: December 16, 2019 Accepted: December 25, 2019
Corresponding Author: Yoon Jeon Kim, MD, PhD. Department of Oph- thalmology, Asan Medical Center, University of Ulsan College of Med- icine, 88 Olympic-ro 43-gil, Songpa-gu, Seoul 05505, Korea. Tel: 82-2- 3010-3680, Fax: 82-2-470-6440, E-mail: [email protected]
Macular Microvasculature in High Myopia without Pathologic Changes: An Optical Coherence Tomography Angiography Study
Chan Hong Min1, Heba M. Al-Qattan2, Joo Yong Lee1, June-Gone Kim1, Young Hee Yoon1, Yoon Jeon Kim1
1Department of Ophthalmology, Asan Medical Center, University of Ulsan College of Medicine, Seoul, Korea
2College of Medicine, King Saud University, Riyadh, Saudi Arabia
5,6,8,10,12,15,16]. In pathologic myopia, reduced retinal ves- sel density and blood flow are evident by fundus photogra- phy, and decreased choroidal blood flow has been noticed with increased axial length [5,15]. With decreased retinal microvasculature supplies, the retina may be more suscep- tible in pathologic myopia [5,10]. In this context, studying the changes in the microvasculature and their interaction may reveal the underlying pathophysiology of the disorder and enable an effective treatment or prevention [5].
The use of optical coherence tomography angiography (OCTA) has allowed researchers to noninvasively measure the retinal microvasculature [1,5,10,11,17-19]. The purpose of this study was to evaluate the retinal and choriocapillar- is microvasculature using OCTA in highly myopic eyes and to investigate the associations between the OCTA pa- rameters and the structural parameters.
Materials and Methods
Study subjects
The study was approved by the institutional review board of the Asan Medical Center (2019-1083) before initi- ation and was performed in compliance with the tenets of the Declaration of Helsinki. Informed consent was waived due to the retrospective nature of the study. We retrospec- tively recruited patients with high myopia and their age- and sex-matched controls who visited a university-based retina clinic (Asan Medical Center, Seoul, South Korea) between January 2016 and December 2017. Eyes with an axial length greater than 26.5 mm were included in the high myopia group. The exclusion criteria for the high my- opia group were as follows: (1) evidence of ocular disease other than myopia; (2) advanced myopic maculopathy more severe than “diffuse chorioretinal atrophy” (C2) as per the Meta Analysis for Pathologic Myopia study group classification: “patchy chorioretinal atrophy” (C3), “macu- lar atrophy” (C4), or any of the “plus” lesions (lacquer crack, myopic choroidal neovascularization, or Fuch’s spot); (3) eyes with obvious staphylomatous outpouching;
(4) history of prior vitreoretinal surgery; (5) presence of a systemic illness that might affect the chorioretinal vascula- ture, such as diabetes mellitus and hypertension; and (6) poor-quality OCTA scan images with a signal strength less than 55. If both eyes met the criteria, one eye was random-
ly selected. In addition, sex- and age-matched controls with an axial length less than 26.5 mm were included in the analysis for comparison with the highly myopic eyes.
Optical coherence tomography and OCTA measure- ments
All patients underwent comprehensive ophthalmologic examinations, including best-corrected visual acuity, man- ifest refraction, and axial length (IOL Master; CarlZeiss, Jena, Germany) and were thoroughly examined using spectral-domain optical coherence tomography (OCT) and OCTA (Optovue, Fremont, CA, USA). All OCT and OCTA scans were reviewed to ensure correct segmentation and sufficient image quality. The built-in software (version 3.0) allows automated segmentation not only of the whole reti- nal thickness, but also of the inner retinal layer (the vitreo- retinal interface to the outer border of the inner plexiform layer) and the outer retinal layer (the outer border of the inner plexiform layer to the outer border of the retinal pig- ment epithelium). We analyzed the thickness of each layer measured at the fovea and parafoveal region of the stan- dard 9-area Early Treatment of Diabetic Retinop athy Study grid sectors [20]. The subfoveal choroidal thickness (SFCT) was defined as the vertical distance from the hy- per-reflective line of Bruch’s membrane to the hyper-re- flective line of the inner surface of the sclera.
For the OCTA, AngioVue (Optovue) was used to obtain split-spectrum amplitude-decorrelation angiography as previously described [20]. The OCTA scan area was cen- tered on the fovea with a field view of 3 × 3 mm2, which corresponded to 10 degrees. OCTA images of the superfi- cial, deep, and whole layers were used after segmentation.
Automatic segmentation was performed by the viewing software to generate en face projection images of the reti- nal superficial capillary plexus (SCP), deep capillary plex- us (DCP), and the choriocapillaris. The SCP en face OCTA image was segmented with an inner boundary 3 µm below the internal limiting membrane and an outer boundary 15 µm below the inner plexiform layer. The DCP image was segmented with an inner boundary 15 µm below the inner plexiform layer and an outer boundary 70 µm below the inner plexiform layer. Foveal avascular zone (FAZ) area and parafoveal vascular density (VD) of SCP and DCP were used to represent macular vascular integrity.
Statistical analysis
Descriptive statistics (the number and percentage of each categorical variable and the mean ± standard deviation of each continuous variable) were initially evaluated in order to determine subject baseline characteristics. The Wilk-Shapiro test was used to explore the distribution of the numerical data. To demonstrate the characteristics of the subjects with myopia compared with those of the con- trols, the Student’s t-test or Mann-Whitney U-test were used, depending on the normality of the data distribution.
To compare the categorical data, the chi-squared test was used. To assess the relationship between the parameters of the macular microvasculature and the structural profiles, Pearson’s correlations were used. All statistical analyses were performed using PASW Statistics ver. 18.0 (SPSS Inc., Chicago, IL, USA).
Results
Fifty-two eyes of 52 patients with high myopia and 52 normal sex- and age-matched controls were included in the analysis. The demographic and clinical information of the patients is listed in Table 1. There were no significant dif- ferences in age or sex (p > 0.05) between patients with myopia and healthy controls. The mean age was 46.1 ± 15.8 years for all subjects (46.5 ± 16.6 for controls and 45.7 ± 15.0 for patients with myopia). Significant differences be- tween the groups were noted in the refractive error and axial length (p < 0.05). The mean refractive error, best-cor- rected visual acuity (logarithm of the minimum angle of resolution), and axial length were -2.0 ± 3.0 D, 0.02 ± 0.04, and 24.0 ± 1.1 mm in the control group, and -8.5 ± 4.9 D, 0.06 ± 0.09, and 27.5 ± 1.1 mm in the myopia group, re- spectively. All OCT images of myopic eyes across the fo-
vea and the optic disc nerve showed no outpouching, sug- gesting posterior staphyloma.
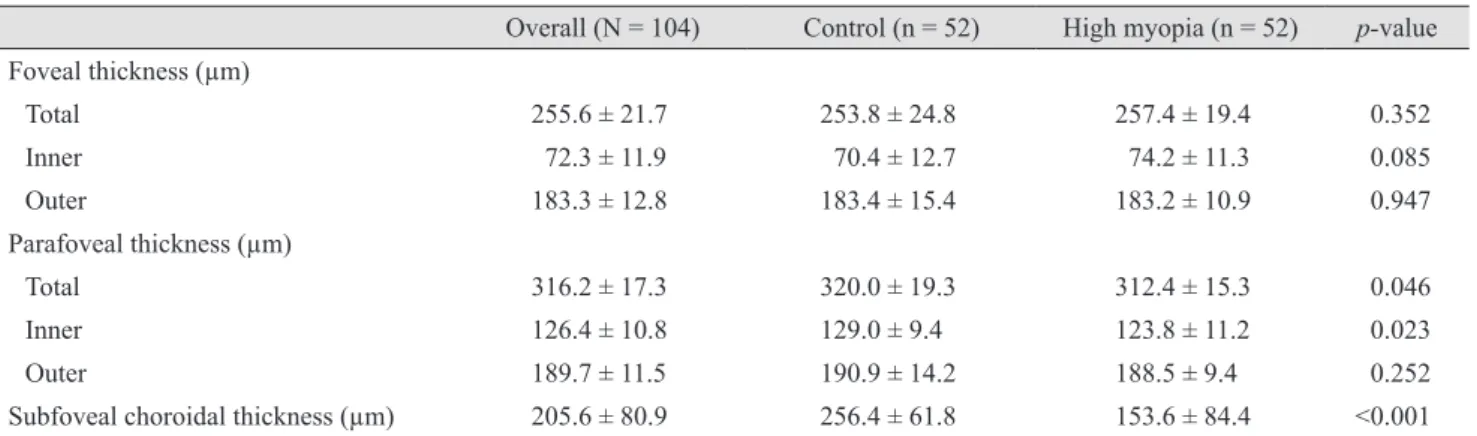
With respect to the retinal and choroidal thickness pa- rameters, the mean foveal retinal thickness showed no dif- ferences between the two groups; however, there was a significant difference in total thickness in the parafoveal area (312.4 ± 15.3 µm in the myopia group and 320.0 ± 19.3 µm in the control group, p = 0.046). The mean SFCT was 153.6 ± 84.4 µm in the myopia group and 256.4±61.8 µm in the control group (p < 0.001) (Table 2).
With respect to the retinal and choriocapillaris micro- vasculature parameters, the FAZ area, FAZ perimeter, and the average of the parafoveal VD in the SCP showed sig- nificant differences. When regional studies were per- formed, significance was found in the nasal and inferior sectors for the parafoveal VD in the SCP. The FAZ area was 0.31 ± 1.0 mm2 in the control group and 0.39 ± 1.3 mm2 in the myopia group (p = 0.023). The FAZ perimeter was 2.2 ± 0.5 mm in the control group and 2.4 ± 0.4 mm in the myopia group (p = 0.049). The average parafoveal VD in the SCP was 54.8 ± 3.0% and 52.7 ± 4.2% for the control and the myopia groups, respectively (p = 0.007). In the DCP, they were 62.2 ± 2.2% and 61.6 ± 3.0%, respectively (p = 0.426). The mean parafoveal VD in the SCP was 54.8
± 3.4% and 52.6 ± 4.1% in the nasal sector (p = 0.007), and 55.1 ± 4.8% and 52.4 ± 5.3% in the inferior sector (p = 0.005) in the control and myopia groups, respectively. The choriocapillaris fluid void area showed no significant dif- ferences, with 2.08 ± 0.14 and 2.14 ± 0.14 mm2 in the con- trol and myopia groups, respectively (p = 0.068) (Table 3).
The association of the axial length with the FAZ showed a positive correlation (r = 0.239, p = 0.025), and that with the SCP VD and SFCT showed a negative correlation (r = -0.340, p = 0.001; r = -0.693, p < 0.001), but the difference was not statistically significant for the choriocapillaris fluid void area. The parafoveal inner retinal thickness showed a Table 1. Baseline characteristics of the participants
Overall (N = 104) Control (n = 52) High myopia (n = 52) p-value
Age (yr) 46.1 ± 15.8 46.5 ± 16.6 45.7 ± 15.0 0.412
Male : female 48 : 56 24 : 28 24 : 28 0.578
Refractive error (D) -5.3 ± 3.9 -2.0 ± 3.0 -8.5 ± 4.9 <0.001
BCVA (logMAR) 0.04 ± 0.05 0.02 ± 0.04 0.06 ± 0.09 0.122
Axial length (mm) 25.8 ± 1.3 24.0 ± 1.1 27.5 ± 1.1 <0.001
Values are presented as mean ± standard deviation or number.
D = diopters; BCVA = best-corrected visual acuity; logMAR = logarithm of the minimum angle of resolution.
positive correlation with the SCP VD (r = 0.228, p = 0.033).
The regional correlations between the SCP parafoveal VD and the parafoveal inner retinal thicknesses were significant in all four quadrants; temporal (r = 0.391, p < 0.001), superi- or (r = 0.396, p < 0.001), nasal (r = 0.442, p < 0.001), and in- ferior sectors (r = 0.460, p < 0.001), respectively. There was no significant correlation between the choriocapillaris fluid void area and the SFCT (r = -0.21, p = 0.273) (Fig. 1A-1F).
Discussion
In our study, the VD in the myopia group was signifi- cantly decreased in the SCP, and the SCP VD and the axial length showed a negative correlation. This is consistent with the findings of previous studies and indicates that the decreased VD could be due to mechanical stretching of the eyeball and consequent narrowing of the retinal vessels Table 3. Retinal and choriocapillaris microvasculature parameters
Overall (N = 104) Control (n = 52) High myopia (n = 52) p-value Foveal avascular zone
Area (mm2) 0.35 ± 0.12 0.31 ± 1.0 0.39 ± 1.3 0.023
Perimeter (mm) 2.3 ± 0.5 2.2 ± 0.5 2.4 ± 0.4 0.049
Circularity 0.42 ± 0.15 0.39 ± 0.13 0.45 ± 0.15 0.107
Parafoveal VD (%) SCP
Temporal 53.2 ± 3.5 53.9 ± 3.1 52.4 ± 3.7 0.064
Superior 54.6 ± 4.0 55.5 ± 3.6 53.6 ± 4.8 0.041
Nasal 53.7 ± 3.9 54.8 ± 3.4 52.6 ± 4.1 0.007
Inferior 53.8 ± 5.0 55.1 ± 4.8 52.4 ± 5.3 0.005
Average 53.7 ± 3.8 54.8 ± 3.0 52.7 ± 4.2 0.007
DCP
Temporal 60.9 ± 2.8 60.9 ± 2.8 60.8 ± 3.0 0.983
Superior 62.8 ± 2.9 63.2 ± 2.4 62.4 ± 3.6 0.278
Nasal 61.6 ± 27 61.7 ± 2.6 61.5 ± 2.9 0.775
Inferior 62.5 ± 3.6 62.8 ± 2.6 62.1 ± 4.8 0.344
Average 61.9 ± 2.8 62.2 ± 2.2 61.6 ± 3.0 0.226
Choriocapillaris fluid void area (mm2) 2.11 ± 0.14 2.08 ± 0.14 2.14 ± 0.14 0.068
Signal strength 64.4 ± 8.4 66.5 ± 7.5 62.2 ± 8.1 <0.001
Values are presented as number or mean ± standard deviation.
VD = vessel density; SCP = superficial capillary plexus; DCP = deep capillary plexus.
Table 2. Retinal and choroidal thickness parameters
Overall (N = 104) Control (n = 52) High myopia (n = 52) p-value Foveal thickness (µm)
Total 255.6 ± 21.7 253.8 ± 24.8 257.4 ± 19.4 0.352
Inner 72.3 ± 11.9 70.4 ± 12.7 74.2 ± 11.3 0.085
Outer 183.3 ± 12.8 183.4 ± 15.4 183.2 ± 10.9 0.947
Parafoveal thickness (µm)
Total 316.2 ± 17.3 320.0 ± 19.3 312.4 ± 15.3 0.046
Inner 126.4 ± 10.8 129.0 ± 9.4 123.8 ± 11.2 0.023
Outer 189.7 ± 11.5 190.9 ± 14.2 188.5 ± 9.4 0.252
Subfoveal choroidal thickness (µm) 205.6 ± 80.9 256.4 ± 61.8 153.6 ± 84.4 <0.001 Values are presented as mean ± standard deviation.
[1,5,6,10,15]. Interestingly, we found that the VD in the my- opia group was not significantly decreased in the DCP.
Meanwhile, other studies revealed that both the SCP and DCP showed a significant reduction in the VD [1,5,10,15].
Fan et al. [1] showed that myopia severity might be associ- ated with such differences; significantly decreased SCP VD was found in both moderate and high myopia, but the decreased DCP VD was significant only in the high myo- pia group. In line with our study, this could mean that the SCP VD is significantly reduced before the DCP in the myopic eye. A possible reason for this could be that the vessels are more densely packed in the DCP of the parafo- veal region [18].
Among the four quadrants, the parafoveal VD reduction in the SCP showed the highest significance in the inferior and nasal regions in our study. This finding was consistent with that of other studies [5,6,10]. Similar findings in the DCP and large vessels were also shown. Although the rea-
son for the greater VD reduction in the inferior and nasal sectors is not well-understood, several previous studies have speculated that it corresponds to the loss of the retinal nerve fiber layer inferiorly in myopic eyes [5,7,10,18].
The FAZ area positively correlated with the axial length in our study, while previous studies showed no significant difference in the FAZ area between myopic and control groups [5,6]. One study reported that a larger FAZ area was associated with a shorter axial length and a hyperopic refractive error [19]. Little is known about the FAZ area in regard to myopia, and the differences in the results are most likely due to individual variation in age and other factors [6]. One of the causes of this discrepancy could be the use of Bennett’s formula in our study to correct the magnification factors of OCT en face images of myopic eyes [5,6,18,21].
In our study, the parafoveal retinal thickness was signifi- cantly decreased in the myopia group, while the foveal ret- Fig. 1. Correlations between the microvasculature and structural profiles. (A) Axial length and the superficial capillary plexus (SCP) fo- veal avascular zone (FAZ) area showed a positive correlation. (B) Axial length and the SCP vessel density showed a negative correlation.
(C) SCP vessel density and the parafoveal inner retinal thickness showed a positive correlation. (D) Axial length and the choriocapillaris flow void area showed a positive correlation. (E) Axial length and subfoveal choroidal thickness (SFCT) showed a negative correlation. (F) SFCT and the choriocapillaris flow void area showed no significant correlation.
SCP FAZ area (mm2)
Axial length (mm) r = 0.239, p = 0.025
0 1.0
0.5
25.0 28.0 31.0
22.0
SCP vessel density (%)
r = -0.340, p = 0.001
Axial length (mm) 40
70
60
50
25.0 28.0 31.0
22.0
Parafoveal inner retinal thickness (μm) r = 0.228, p = 0.033 SCP vessel density (%) 80
160 140 120 100
50.0 60.0 70.0
40.0
A B C
Choriocapillaries flow void area (mm2) r = 0.189, p = 0.083 Axial length (mm) 0.6
1.5
1.2
0.9
25.0 28.0 31.0
22.0
SFCT (μm)
r = -0.693, p < 0.001
Axial length (mm) 0
400 300 200 100
25.0 28.0 31.0
22.0
Choriocapillaries flow void area (mm2) r = -0.121, p = 0.273 SFCT (μm) 0.6
1.5
1.2
0.9
200
100 300 400
0
D E F
inal thickness was increased, but showed no significance.
This finding was similar to that of a previous study [14]. In other studies, however, the increased foveal retinal thick- ness was significant [4,6,7,11-13,16,22-24], which could be due to the foveal elevation secondary to the mechanical stretching and pararetinal thinning in myopic eyes and the foveal retinal pigment epithelium’s high permeability [6,10,12-14,16,23,24]. Additionally, the absence of large ves- sels and optic fibers make the peripheral retina less resis- tant to stretching, while the foveal thickness is preserved [4,7,13,14,16]. In addition, the parafoveal retinal thickness was positively correlated with the SCP VD in our study, and the correlation was the strongest in the nasal and infe- rior sectors. The association between retinal thickness and VD is scarce in the literature and requires further study [6].
Our study showed a significant decrease in the SFCT in myopic eyes (p < 0.001), in line with the findings of others [2,7,19,25-27]. Choroidal thinning is one of the earliest signs of non-pathological myopic change and can lead to pathological changes later, such as lacquer crack formation and choroidal neovascularization, and is associated with a poorer prognosis [2,3,7,8,9,15]. However, choriocapillaris blood flow results are controversial in the literature. This could be due to the extensive choroidal thinning in myopic eyes, which makes the choriocapillaris blood flow difficult to evaluate [6,8,15,19]. Our study showed no significant in- crease in the choriocapillaris fluid void areas in the myopia group. This may be because larger choroidal vessels are more affected than the choriocapillaris [6,28]. Moreover, studies that did show significant differences in the chorio- capillaris perfusion area mentioned that the larger vessels could not be distinguished from the choriocapillaris when imaging studies were performed [15,19,28]. However, in our study, no myopic eyes showed staphyloma. As other studies have found that staphyloma is a representative de- formity of pathologic myopia, this might be because we excluded the patients with pathologic changes [29].
We acknowledge that the mono-racial, single-center background and retrospective design limit this study. Our study focused on retinal VD, but changes in retinal blood flow were not explored. Interestingly, despite the decreased VD, the overall retinal perfusion was known to be main- tained and this may indicate that reduced VD is related to increased axial length (mechanical stretching), rather than to vessel loss [5,15,30]. Correlative studies between retinal blood flow and VD are required to better understand why
there is a decrease in VD, but maintenance of the overall perfusion [5,15,30]. Longitudinal studies are required to determine whether the structural changes or blood flow changes are affected first [10]. The change in the microvas- culature was explored in our study, but not in large vessels as in other studies [5,10]. Stratifying patients in terms of degree of myopia could further understanding of the course and progression of myopic changes in relation to the degree of myopia, but this was not done in our study.
In conclusion, our study showed that eyes with long axi- al length had an enlarged FAZ area and a reduced SCP VD before the occurrence of the pathological changes of myo- pia. Interestingly, such changes were well correlated with the axial length and the changes in the SCP VD showed good associations with the parafoveal inner retinal thick- ness. The sequence of these changes and how they are cor- related with one another are crucial to better understand the early myopic changes. OCTA provides a way to visual- ize these changes clearly and noninvasively.
Conflict of Interest
No potential conflict of interest relevant to this article was reported.
Acknowledgements
This study was supported by grant from Ministry of Science and ICT (Information and Communication Tech- nology), South Korea (NRF-2019R1F1A1063124).
References
1. Fan H, Chen HY, Ma HJ, et al. Reduced macular vascular density in myopic eyes. Chin Med J (Engl) 2017;130:445-51.
2. Gupta P, Saw SM, Cheung CY, et al. Choroidal thickness and high myopia: a case-control study of young Chinese men in Singapore. Acta Ophthalmol 2015;93:e585-92.
3. Kumar A, Chawla R, Kumawat D, Pillay G. Insight into high myopia and the macula. Indian J Ophthalmol 2017;65:85-91.
4. Lam DS, Leung KS, Mohamed S, et al. Regional variations in the relationship between macular thickness measurements and myopia. Invest Ophthalmol Vis Sci 2007;48:376-82.
5. Li M, Yang Y, Jiang H, et al. Retinal microvascular net- work and microcirculation assessments in high myopia. Am J Ophthalmol 2017;174:56-67.
6. Milani P, Montesano G, Rossetti L, et al. Vessel density, retinal thickness, and choriocapillaris vascular flow in my- opic eyes on OCT angiography. Graefes Arch Clin Exp Ophthalmol 2018;256:1419-27.
7. Ng DS, Cheung CY, Luk FO, et al. Advances of optical co- herence tomography in myopia and pathologic myopia. Eye (Lond) 2016;30:901-16.
8. Sayanagi K, Ikuno Y, Uematsu S, Nishida K. Features of the choriocapillaris in myopic maculopathy identified by optical coherence tomography angiography. Br J Ophthal- mol 2017;101:1524-9.
9. Wang NK, Lai CC, Chou CL, et al. Choroidal thickness and biometric markers for the screening of lacquer cracks in patients with high myopia. PLoS One 2013;8:e53660.
10. Yang Y, Wang J, Jiang H, et al. Retinal microvasculature alteration in high myopia. Invest Ophthalmol Vis Sci 2016;57:6020-30.
11. Lim MC, Hoh ST, Foster PJ, et al. Use of optical coherence tomography to assess variations in macular retinal thick- ness in myopia. Invest Ophthalmol Vis Sci 2005;46:974-8.
12. Luo HD, Gazzard G, Fong A, et al. Myopia, axial length, and OCT characteristics of the macula in Singaporean chil- dren. Invest Ophthalmol Vis Sci 2006;47:2773-81.
13. Zhao M, Wu Q, Hu P, Jia L. Macular thickness assessed with optical coherence tomography in young Chinese myo- pic patients. J Ophthalmol 2015;2015:715798.
14. Zhao Z, Zhou X, Jiang C, Sun X. Effects of myopia on dif- ferent areas and layers of the macula: a Fourier-domain op- tical coherence tomography study of a Chinese cohort.
BMC Ophthalmol 2015;15:90.
15. Al-Sheikh M, Phasukkijwatana N, Dolz-Marco R, et al.
Quantitative OCT angiography of the retinal microvascula- ture and the choriocapillaris in myopic eyes. Invest Oph- thalmol Vis Sci 2017;58:2063-9.
16. Samuel NE, Krishnagopal S. Foveal and macular thickness evaluation by spectral OCT SLO and its relation with axial length in various degree of myopia. J Clin Diagn Res 2015;9:NC01-4.
17. de Carlo TE, Romano A, Waheed NK, Duker JS. A review of optical coherence tomography angiography (OCTA). Int J Retina Vitreous 2015;1:5.
18. Hassan M, Sadiq MA, Halim MS, et al. Evaluation of mac- ular and peripapillary vessel flow density in eyes with no known pathology using optical coherence tomography an- giography. Int J Retina Vitreous 2017;3:27.
19. Wang Q, Chan S, Yang JY, et al. Vascular density in retina and choriocapillaris as measured by optical coherence to- mography angiography. Am J Ophthalmol 2016;168:95-109.
20. Kim YJ, Jo J, Lee JY, et al. Macular capillary plexuses af- ter macular hole surgery: an optical coherence tomography angiography study. Br J Ophthalmol 2018;102:966-70.
21. Iafe NA, Phasukkijwatana N, Chen X, Sarraf D. Retinal capillary density and foveal avascular zone area are age-dependent: quantitative analysis using optical coher- ence tomography angiography. Invest Ophthalmol Vis Sci 2016;57:5780-7.
22. Huynh SC, Wang XY, Rochtchina E, Mitchell P. Distribu- tion of macular thickness by optical coherence tomogra- phy: findings from a population-based study of 6-year-old children. Invest Ophthalmol Vis Sci 2006;47:2351-7.
23. Sato A, Fukui E, Ohta K. Retinal thickness of myopic eyes determined by spectralis optical coherence tomography. Br J Ophthalmol 2010;94:1624-8.
24. Wu PC, Chen YJ, Chen CH, et al. Assessment of macular retinal thickness and volume in normal eyes and highly myopic eyes with third-generation optical coherence to- mography. Eye (Lond) 2008;22:551-5.
25. Agawa T, Miura M, Ikuno Y, et al. Choroidal thickness measurement in healthy Japanese subjects by three-dimen- sional high-penetration optical coherence tomography.
Graefes Arch Clin Exp Ophthalmol 2011;249:1485-92.
26. Flores-Moreno I, Lugo F, Duker JS, Ruiz-Moreno JM. The relationship between axial length and choroidal thickness in eyes with high myopia. Am J Ophthalmol 2013;155:314-9.
27. Wei WB, Xu L, Jonas JB, et al. Subfoveal choroidal thick- ness: the Beijing Eye Study. Ophthalmology 2013;120:175-80.
28. Mo J, Duan A, Chan S, et al. Vascular flow density in pathological myopia: an optical coherence tomography an- giography study. BMJ Open 2017;7:e013571.
29. Ohno-Matsui K, Lai TY, Lai CC, Cheung CM. Updates of pathologic myopia. Prog Retin Eye Res 2016;52:156-87.
30. Shimada N, Ohno-Matsui K, Harino S, et al. Reduction of retinal blood flow in high myopia. Graefes Arch Clin Exp Ophthalmol 2004;242:284-8.