J O U R N A L O F
Veterinary Science
ABSTRACT
5)
Oxytetracycline (OTC) has been used for over 40 years in veterinary medical field. Various forms of oxytetracycline preparations have been marketed, but little information is available on the bio- equivalence of OTC preparations. This study was conducted to evaluate the bioequivalence of two OTC powder preparations available in Korea.
Fourteen rabbits were randomly allocated into two groups. During the first period, a dose (200 mg/kg) of reference product was orally administered to the rabbits in Group A and test product to those in Group B. After 7-day washout period the reterence and test products were given in group B and A, respectively.
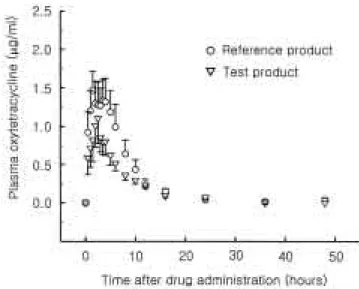
Blood samples were drawn at 17 points during 48 hours after administration and plasma OTC concen- trations were measured by using HPLC.
The solution concentrations of OTC dissolved from two products were not significantly different in the dissolution test. The mean area under the curve (AUC
0-∞) and peak plasma concentration (C
max) values for test and reference OTCs were 7.22 ± 3.90 and 11.04 ± 7.37 μg·h/ml, 1.11 ± 0.65 and 1.85 ± 1.15 μ g/ml, respectively. The realtive bioavailability and C
maxof test product to those of reference product was 65.4% and 60.0%, respectively. The ranges of AUC and C
maxof test drug compared to those of reference drug under 90% confidence limits were 27 ∼ 104% and 28
∼ 91.5%, respectively.
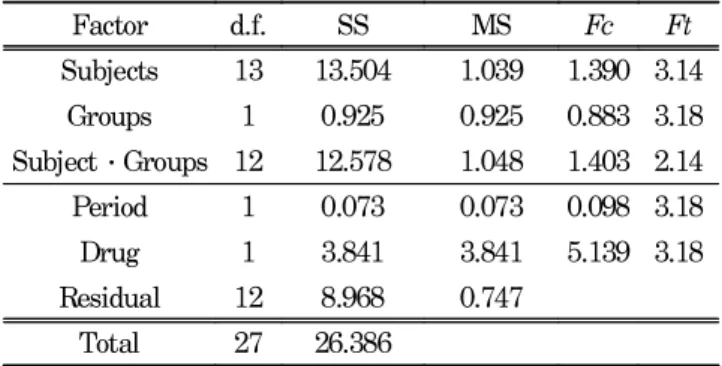
The results of statistical analysis indicate that the two pivotal pharmacokinetic parameters, AUC and C
max of test product are not within the 20% of those of the reference, suggesting that the test OTC is not bioequivalent to the reference OTC.
Key word : oxytetracycline, pharmacokinetics, bioequi-
*Corresponding author : Pan Dong Ryu
College of Veterinary Medicine, Seoul National University, 103
Seodundong, Kwonsunku, Suwon, 441-744
E-mail: [email protected]
# Current address : Laboratory of Neuroendocrinology, The Baabraham
Institute Cambridge, UK, CB2 4AT.
valence, AUC, Cmax
Introduction
Bioequivalence is defined as statistically equivalent bioavailability between two products at the same molar dose of the therapeutic moiety under similar experimental conditions. Two products are said to be bioequivalent if they are pharmaceutical equivalents or pharmaceutical alternatives and if their rate and extent of absorption do not show a significant difference statistically. In case of bioavailability, it is defined as the rate and extent to which an active drug ingredient is absorbed and becomes available at the site of drug action [27, 31]. A comparative bioavailability study is usually referred to as the comparison of bioavailabilities of different formulations of the products. In veterinary medical field, the demand for review systems of bioequivalence on drug approval process has been increasing [12].
Oxytetracyline is a broad-spectrum antibiotic with bac- teriostatic activity for many gram-positive and gram- negative bacteria, including some anaerobes, rickettsiae, chlamydiae, and mycoplasmas [8, 22]. It has been available for human and veterinary medical use for more than 40 years. In pharmacokinetics, 60∼80% of oxytetracycline is absorbed in the gut, and the absorption occurs mainly in the upper small intestine. The food inhibits the enteric absorption of OTC [8, 19]. In the blood, 40∼80% of various tetracylclines is protein-bound [10, 25]. The drug is distributed widely to tissues and body fluids except for the cerebrospinal fluid, where concentrations are low. The absorbed oxytetracycline is excreted mainly in bile and urine [6, 10].
Oxytetracycline is one of major antibiotics currently used in Korea for pig, cow, and chicken. More than 140 oxytetracycline preparations which are commercially available and its market volume was about 400,000 kg in 1998. More than 90% of them is the powder form. However, little information is available on the bioequivalence of these oxytetracyclines [28].
In this study, we compared two pivotal pharmacokinetic properties of parameters; area under the plasma concentration- time curve (AUC) and (C
max), to evaluate the bioequivalence of two commercially available OTC HCl powder preparations labeled effective for the treatment of bacterial infections
Lack of bioequivalence of two oxytetracycline formulations in the rabbit
W. Chong, Y.J. Kim, S.D. Kim, S.K. Han
# and P.D. Ryu
*
Department of Pharmacology, College of Veterinary Medicine and School of Agricultural Biotechnolog, Seoul National
University, Suwon, 441-744, Korea