Print ISSN: 2288-4637 / Online ISSN 2288-4645 doi:10.13106/jafeb.2020.vol7.no12.693
Beyond Growth: Does Tourism Promote Human Development in India?
Evidence from Time Series Analysis
Manu SHARMA
1, Geetilaxmi MOHAPATRA
2, Arun Kumar GIRI
3Received: September 10, 2020 Revised: November 08, 2020 Accepted: November 16, 2020
Abstract
The present study aims to investigate the impact of tourism growth on human development in Indian economy. For this purpose, the study uses annual data from 1980 to 2018 and utilizes two proxies for tourism growth – tourism receipt and tourist arrivals – and uses human development index calculated by UNDP. The study uses control variables such as government expenditure and trade openness. The study employs auto regressive distributed lag (ARDL) approach to investigate the cointegrating relationship among the variables in the model. Further, the study also explores the causal nexus between tourism sector and human development by using the Toda-Yamamoto Granger non-causality test. The result of ARDL bounds test reveals the existence of cointegrating relationship between human development indicators, government expenditure, trade openness, and tourism sector growth. The cointegating coefficient confirms a positive and significant relationship between tourism sector growth and human development in India. The causality result suggests that economic growth and tourism have a positive impact while trade openness has a negative impact on human development in India. The major findings of this study suggest that tourism plays an important role in the socio-economic development of Indian economy in recent years and the country must develop this sector to achieve sustainable development.
Keywords: Tourism Sector Growth, Economic Growth, Human Development, ARDL, Granger Causality JEL Classification Code: C22, O1, O15, O53, Z32
growth nexus for numerous economies. Many single country-specific and panel studies have emphasized tourism’s pivotal role in promoting economic growth (Kumar, Kumar, Kumar, & Stauvermann, 2019; Mitra, 2019). Brida, Cortes-Jimenez, and Pulina (2016) provide extensive literature review studies related to tourism and growth linkage. However, most of the studies use economic growth as a measure for development. The studies assume that enhancing GDP growth eventually trickles down to the poor and promote development. However, Noble laureate Amartya Sen argues that economic growth is a one-dimensional measure, whereas the term ‘development’
basically involves multi-dimensions aspects (Sen, 1985, 1993). Hence, with this argument, GDP may not be considered only as a welfare and development measure.
While income and consumption are essential aspects, Sen argues that building individual capabilities that enhance overall experience and freedom in life is crucial (Sen, 1993). Since 1990, the human development index (HDI) has gained momentum among scholars and academicians in accounting for welfare and human development. HDI encapsulates three important features, i.e., income, health, and education, which gives a better picture in understanding the level of development in any economy.
1
First Author. Research Scholar, Department of Economics and Finance, Birla Institute of Technology and Science (BITS), Pilani, India.
Email: [email protected]
2
Corresponding Author. Assistant Professor, Department of Economics and Finance, Birla Institute of Technology and Science (BITS), Pilani, India [Postal Address: New Academic Building, BITS, Pilani, Pilani Campus, Pilani, Rajasthan, 333031, India]
Email: [email protected]
3
Associate Professor, Department of Economics and Finance, Birla Institute of Technology and Science (BITS), Pilani, India.
Email: [email protected]
© Copyright: The Author(s)
This is an Open Access article distributed under the terms of the Creative Commons Attribution Non-Commercial License (https://creativecommons.org/licenses/by-nc/4.0/) which permits unrestricted non-commercial use, distribution, and reproduction in any medium, provided the original work is properly cited.
1. Introduction
Tourism has always been one of the largest economic
sectors in the world and an important one for many
countries. However, with the development process, the
degrading effect of tourism has become a major concern
for all countries and needs to be addressed appropriately
(Vu, Tran, Nguyen, & Nguyen, 2020). Many researchers
have extensively explored the tourism and economic
The travel and tourism sector is one of the fastest- growing sectors of the world. Having backward and forward linkages, research on tourism sector makes it an indispensable part for any prudent policymaker (Uzar &
Eyuboglu, 2019). However, the researchers have mostly sidelined the plausible development effects of tourism sector growth. The existing literature lacks in identifying the possible application of the tourism sector to enhance individual capabilities.
Biagi, Ladu, and Royuela, (2017) observed that existing studies relate tourism to human development, but lack theoretical analysis explaining how tourism can potentially influence human development. They are of the view that tourism and human development could be linked through the social exchange theory, and the tourism sector provides the possibility of interaction between tourists and residents of the host nation through cultural values and social exchanges are possible. However, with the local tourist interaction, there is a possibility of positive and negative externalities of the tourism sector. They also pointed out that tourism gives motivation and incentive to conserve and promote cultural values and heritage apart from economic channels such as wages and profits in this sector. Further, with the frequent interaction with tourists, local people may get creative ideas and knowledge for entrepreneurship in this field (Biagi et al, 2017). However, the rising tourism sector may pressure the available natural resources, which may impact the quality of life, such as rising pollution, congestion, and crimes, which adversely affect human development (Raza & Shah, 2017; Zaman, Shahbaz, Loganathan, & Raza, 2016; Lee & Syah, 2018).
India has witnessed improvement in GDP per-capita and human development over the last few decades. However, as we notice from Figure 1, the rise in the GDP per-capita is faster that that of HDI. While India comes in the top five great emerging economies of the world, surpassing that of United Kingdom and France, HDI ranking depicts a different picture altogether. The India’s HDI rank for 2019 released by the United Nations development program (UNDP) is 129
thout of 189 countries, even though the nation comes among the world’s fastest-growing economies. Moreover, the country marginally improved from 2018 in HDI ranking (United Nations Development Programme, 2019).
The performance of the tourism sector in India has remained almost stagnant until early 2000s. However, after the implementation of the National Tourism Policy of 2002, the tourism industry in India continuously increased both in respect of number of foreign tourists’ arrivals and foreign exchange earnings as tourism revenue. As depicted by the Figure 1, after 2002 a rising trend is clearly visible.
In this backdrop, the purpose of the present study is to find the short-run and long-run relationship between the tourism sector and human development along with other important variables, namely, government expenditure, GDP per-capita, and trade openness, which may have a possible impact on human development using time-series data from 1980 to 2018. The rest of the study is organized in the following manner. Section 2 reviews the literature and section 3 presents the data, data sources and methodology employed for the analysis. Section 4 describes the empirical findings, and in the section 5 conclusion and policy implications of the study are discussed.
20,000 30,000 40,000 50,000 60,000 70,000 80,000 90,000 100,000 110,000
.30 .35 .40 .45 .50 .55 .60 .65 .70 .75
1980 1985 1990 1995 2000 2005 2010 2015
HDI PGDP
0 2,000,000 4,000,000 6,000,000 8,000,000 10,000,000 12,000,000
0 40,000 80,000 120,000 160,000 200,000 240,000
1980 1985 1990 1995 2000 2005 2010 2015
TR TA
Note: The figure represents the plot of per capita GDP and human development index for India from 1980-2018 Based on the author's own estimation.
Data sources: WDI and UNDP
Note: TR and TA represent tourism receipts and tourist arrivals, respectively. While the left axis represents the number of tourist arrivals, the right axis represents tourism receipts in Indian currency (Rs. Crores) Based on the author's own estimation. Data sources: Ministry of Tourism, India
Figure 1: Trends in human development and GDP per-capita and tourism sector in India
2. Literature Review
The economic impact of tourism has been explored through the tourism-led growth hypothesis in numerous studies. The hypothesis derives the theoretical ground based on another hypothesis that advocates that rising exports raise economic growth named as ELGH hypothesis (Balassa, 1978;
Ohlan, 2017; Mohamed Mustafa, 2019). Many researchers have argued for the tourism sector’s positive influence on sustaining and promoting growth in both country specific and panel studies. However, some researchers argue that, since tourism can impact growth through different channels, these channels should be discovered in depth (Blake, 2009; Brida et al., 2016; Mahadevan, Amir, & Nugroho, 2017; Vu et al., 2020). Further, it is advocated that tourism-related socio- dynamic channels should be given emphasis and stressed that studies should not be limited to exploring its impact on the economic growth only. However, the multidimensional impact via various channels in an economy on human development, poverty, income inequality still remains a very interesting aspect of the current research, which is not confined to economic growth. Some researchers used the general equilibrium framework, while others used vector autoregressive (VAR) and autoregressive distributed lag model (ARDL) to analyze the relationship between tourism and poverty.
For example, few researchers (Blake, Arbache, Sinclair,
& Teles, 2008; Croes & Vanegas 2008; Saayman, Rossouw,
& Krugell, 2012; Vanegas 2014) have attempted to study the impact of tourism on income distribution and poverty reduction. Rather than focusing solely on GDP growth and the indirect effect tourism may have via growth, the direct impact has been considered on the developmental parameters such as poverty, income distribution. However, there is mixed evidence on the impact of tourism on poverty and income distribution. For instance, Uzar and Eyuboglu (2019), analyzing the impact of tourism on income distribution in Turkey, found that the growing tourism sector adversely affects income distribution. On the contrary, Shahbaz, Solarin, Azam, & Tiwari (2019) found that the tourism sector improves Malaysia’s income distribution. Likewise, analyzing an unbalanced panel of 60 countries using annual data from 1995-2014, Rodríguez-Llorca, Garcia-Fernandez,
& Casas-Jurado (2020) found that tourism reduces absolute poverty. However, domestic tourism played an important role in reducing poverty vis-a-vis inbound tourism.
Similarly, in a broader perspective, some studies analyze the Dutch effect, based on the possible negative externalities the tourism sector can have over the economy (Forsyth, Dwyer & Spurr, 2014; Ghalia and Fidrmuc, 2018; Holzner, 2011). However, a study in Spain using the CGE model finds that the overall tourism sector’s positive effects overcome the negative externalities (Inchausti-Sintes, 2015).
Some researchers have emphasized the dynamic role of tourism in promoting human development. For instance, Croes, (2012) examined the long-run and short-run shocks from tourism to human development for two central American economies, namely, Nicaragua and Costa Rica, using the cointegration test and Granger causality for the period 1990-2009. The author discovered the overall positive influence of the tourism sector on human development.
Further, the author advocated using tourism tax revenue for redistribution purposes to check income inequality and poverty. Also, the use of growth is not comprehensive as it pictures only income effects. The paper further argued that welfare and wellbeing should not be solely limited to the income criteria.
Similarly, Cárdenas-García, Rivero, & Pulido-Fernandez, (2013) explored the tourism and development linkage in 144 developed and developing countries. The study found that the tourism sector plays an important role in promoting human development, especially in developed nations. However, the authors argued for a threshold level of minimum development before tourism can play a development role. Moreover, the study also favors proper policy intervention to reap the fruits from the tourism sector. Likewise, Mehregan, Kordbacheh,
& Akbari, (2013) also emphasized the importance of tourism in promoting human development in Iran for the period 1967 to 2007 using ARDL techniques.
Rivero and Cárdenas-García (2014) examined the empirical linkage between tourism and human development for a panel of 144 countries for the duration 1991 to 2010 using Simultaneous Equation Modelling (SEM). They found that tourism is relatively more effective in developed economies in promoting development in contrast to developing economies. Biagi et al., (2017) examined the empirical linkage between tourism and human development for in a panel of 63 countries for the period 1996 to 2008.
The study also decomposed the human development index in individual indicators. The findings revealed a positive impact of tourism on human development. Further, education comes out to be the most affected variable from tourism sector growth among the individual components. The study also stressed the need to explore more the dynamics between tourism and economic development by using different economic development proxies. In a conceptual framework, Croes, Redderstaat, and Shapoval (2020) advocated the possible feedback effect between tourism and human development, emphasizing the fact that tourism competitiveness and human capital can have bidirectional linkage.
However, in the Indian context, previous studies have focused mostly on analyzing the tourism-growth linkage. For instance, Ohlan (2017) and Mishra, Rout, and Mohapatra, (2011) find support for the tourism-led growth hypothesis.
However, Georgantopoulos (2013) fails to establish any
linkage between tourism and economic growth in India. In this
backdrop, the present study attempts to fill the research gap in tourism sector growth and human development literature.
After going through the existing literature, it is found that only a few researchers have explored the tourism and human development linkage. Most of the studies have focused on tourism and growth relationship. Thus, in this context, the present study seeks to find the empirical linkage between tourism sector growth and human development for India.
3. Data and Methodology
The study uses annual series from 1980 to 2018, and the data for the present study is obtained from various government and international organizations such as the Ministry of Tourism, India (MOT), World Development Indicators, World bank (WDI), and United Nations Development Program (UNDP) reports. Further explanation regarding the definition and units of the variables is given, such as government expenditure (GOV), taken as a percentage to GDP. Similarly, trade openness (TOP) is the sum of total exports and imports of goods and services and taken as a percentage to GDP. Also, per-capita GDP (PGDP) denotes gross domestic product at constant local currency value divided by the country’s population. Tourism receipts (TR) are annual tourism earnings from the tourism sector in local currency. Also, another proxy for tourism sector is tourist arrivals (TA), which indicate the number of foreign tourist arrivals in a given year. The human development index (HDI) is calculated using the UNDP formula, which encompasses three important measures: income, health, and education.
As the variables are in different units, all the variables are transformed in logarithms form, and represented as LN.
3.1. Cointegration with ARDL
In the present study we make use of ARDL bounds testing approach for testing long-run cointegrating relationship.
Before proceeding for the cointegration test, a stationarity check is required. Hence, Augmented Dickey-Fuller (ADF) is used for checking the degree of integration (Dickey &
Fuller, 1979). There are certain advantages of the ARDL bounds testing approach over the other cointegration test, namely, the procedure is simple. It can also be performed with different degrees of integration, i.e., I (0) and I (1).
Also, it performs efficiently, even when the sample size is small. Further, it takes care of the endogeneity issue among the variables. (Pesaran, Shin, & Smith, 2001)
Furthermore, with this approach short-run and long-run coefficients can be computed simultaneously (Pesaran et al., 2001). However, the ARDL model has one limitation: the technique does not give efficient results when any series is of I (2) order. Hence, it is important to make sure the integration degree is not higher than the I (1) order.
The relationship in the functional form can be represented in the following way.
Model (1): LNHDI=f (LNGOV, LNPGDP, LNTOP, LNTA)
Model (2): LNHDI=f (LNGOV, LNPGDP, LNTOP, LNTR)
However, the ARDL specification is given below for both models.
For model (1)
0 1 1 2 1
3 1 4 1 5 1
1 2
1 0
3 4
0 0
0 5
µ
t t t
t t t
m n
i t i i t i
i i
o p
i t i i t i
i i
q
i t i t
i
LNHDI A A LNHDI A LNGOV A LNPGDP A LNTOP LNTR
a LNHDI a LNGOV
a LNPGDP a LNTOP
a LNTR α
β
− −
− − −
− −
= =
− −
= =
= −
∆ = +
∆ ∆
∆ ∆
+
+ + +
+ +
+ +
+ ∆ +
∑ ∑
∑ ∑
∑ (1)
For model (2)
0 1 1 2 1
3 1 4 1 5 1
1 2
1 0
3 4
0 0
0 5
µ
t t t
t t t
m n
i t i i t i
i i
o p
i t i i t i
i i
q
i t i t
i
LNHDI A A LNHDI A LNGOV A LNPGDP A LNTOP LNTR
a LNHDI a LNGOV
a LNPGDP a LNTOP
a LNTA α
β
− −
− − −
− −
= =
− −
= =
= −
∆ ∆
∆ ∆
∆
∆
= + +
+ + +
+ +
+ +
+ +
∑ ∑
∑ ∑
∑ (2)
Where ∆ represents the differenced form of the series.
Also, α represents the trend coefficient. Further, A
1 ,A
2,A
3,A
4,A
5are the long run coefficients, while a
1i, a
2i, a
3i, a
4i, a
5iare the short run coefficients. Lags lengths are denoted by m, n, o, p, q. Here in our equation, the null hypothesis implies H
o: A
1= A
2= A
3= A
4=A
5= 0 on the other hand, alternative hypothesis H
.A.: A
1≠ A
2≠ A
3≠ A
4≠ A
5≠ 0. The rejection of the null hypothesis implies cointegration among the series. Three outcomes are possible in bounds testing procedure. The first one, when we fail to reject the null and conclude no cointegration among the variables. Second, when the calculated F-value lies between critical I (0) and I (1) value, our result remains inconclusive. In the last case, the calculated F-value is higher than the critical value of the upper bound I (1) (Narayan, 2004).
The short run unrestricted error correction model can be
represented as follows.
Model (1)
1 2
1 0
3 4
0 0
5 1 0
m n
t i t i i t i
i i
o p
i t i i t i
i i
q
i t i t t
i
LNHDI S LNHDI S LNGOV S LNPGDP S LNTOP S LNTR ECT
α
Φ ν
− −
= =
− −
= =
− −
=
∆ ∆
∆ ∆
∆
∆ = + +
+ +
+ + +
∑ ∑
∑ ∑
∑
(3)
Model (2)
1 2
1 0
3 4
0 0
5 1 0
m n
t i t i i t i
i i
o p
i t i i t i
i i
q
i t i t t
i
LNHDI S LNHDI S LNGOV S LNPGDP S LNTOP S LNTA ECT
α
Φ ν
− −
= =
− −
= =
− −
=
∆ ∆
∆ ∆
∆
∆ = + +
+ +
+ + +
∑ ∑
∑ ∑
∑
(4)
In the equation (3) and (4) short run unrestricted error correction model is calculated. Here in the equation S
1i,S
2i, S
3i, S
4i, S
5idenotes short run coefficients. Further, Φ represents the pace of the adjustment. For instance, the adjustment speed denotes the required time to get back to the equilibrium path if any deviation comes. Furthermore, the lag length is depicted by m, n, o, p, q. for the robustness check, various diagnostics, and CUSUM and CUSUMSQ have been employed (Brown, Durbin &Evans, 1975).
3.2. Causality test
After establishing long run equilibrium relationship between the variables, it is still not clear what is the causal direction of the relationship. In this pursuit, the study employs Toda-Yamamoto, non-causality test (1995).
The advantage of the methodology is it performs well irrespective of the level of integration of the series. Since we have a mixed order of integration, it an appropriate method for us. The VAR specification for causality is given below.
Model (1)
0 1 2
1 1
1 2
1 1
k dmax
t i t i j t j
i j k
k dmax
i t i j t j i
i j k
LNHDI C C LNHDI C LNHDI
B LNTR B LTR ε
− −
= = +
− −
= = +
= + +
+ + +
∑ ∑
∑ ∑
(5)
0 1 2
1 1
1 2
1 1
k dmax
t i t i j t j
i j k
k dmax
i t i j t j i
i j k
LNTR C B LNTR B LNTR
C LNHDI C LNHDI ε
− −
= = +
− −
= = +
= + +
+ + +
∑ ∑
∑ ∑
(6)
Model (2)
0 1 2
1 1
1 2
1 1
k dmax
t i t i j t j
i j k
k dmax
i t i j t j i
i j k
LNHDI C C LNHDI C LNHDI
B LNTA B LNTA ε
− −
= = +
− −
= = +
= + +
+ + +
∑ ∑
∑ ∑
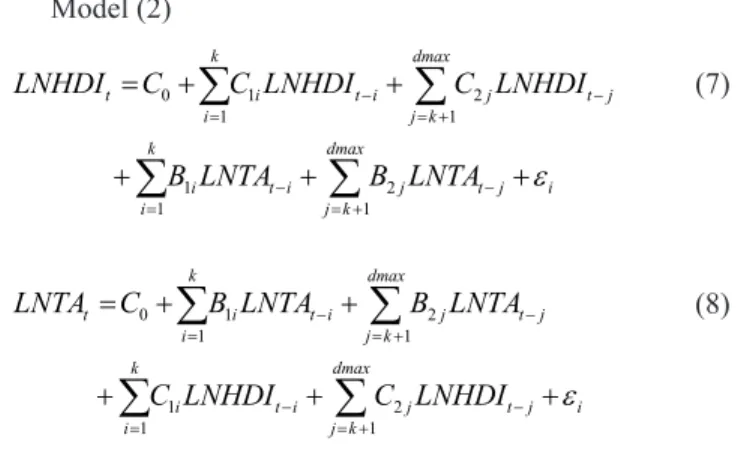
(7)
0 1 2
1 1
1 2
1 1
k dmax
t i t i j t j
i j k
k dmax
i t i j t j i
i j k
LNTA C B LNTA B LNTA
C LNHDI C LNHDI ε
− −
= = +
− −
= = +