Journal of the Korean Society of Marine Environment & Safety Research Paper Vol. 22, No. 1, pp. 123-128, February 28, 2016, ISSN 1229-3431(Print) / ISSN 2287-3341(Online) http://dx.doi.org/10.7837/kosomes.2016.22.1.123
A Study on the Hydrodynamic Effect of Biofouling on Marine Propeller
Kwang-Cheol Seo Mehmet Atlar Bonguk Goo
* Department of Naval Architecture and Ocean Engineering, Mokop National Maritime University, South Korea
** Emerson Cavitation Tunnel, School of Marine Science and Technology, Newcastle University, UK
*** Department of Naval Architecture and Marine Engineering, Changwon National University, South Korea
선박 프로펠러 표면의 생물부착물이 프로펠러 유체역학적 성능에 미치는 영향에 관한 연구
서광철 Mehmet Atlar 구본국
* 목포해양대학교 조선해양공학과, ** 영국 뉴캐슬 대학교, *** 창원대학교 조선해양공학과
Abstract : The effect of propeller surface roughness condition on ship performance is very significant even the influence of fouling on propeller performance is not well established compared to biofouling on the hull surface. In present study, predictions of open water efficiency of propeller are made for three different fouling conditions, and its application is given for the 7m full-scale propeller of a medium-size tanker in open water condition. The numerical predictions of propeller efficiency loss due to fouling are based on the results from laboratory-scale drag measurements and boundary layer similarity law analysis presented in Schultz (2007) together with an in-house unsteady lifting surface code which is an appropriate tool to predict the effect of propeller surface roughness on propeller performance. The results of this study indicate that the subject propeller with the small calcareous fouling (ks=0.001) can lead to as high as 15 % loss at the propeller operating condition (J=0.5) and the loss of propeller efficiency due to fouling should be evaluated while the ship is operating.
Key Words : Ship performance, Biofouling, Surface roughness, Open water efficiency, Boundary layer
요 약 : 프로펠러 표면의 생물 부착이 프로펠러 성능에 상당한 영향을 미치지만 프로펠러 표면 거칠기와 관련된 연구는 상대적으 로 선체 표면에 비하여 많지 않다. 본 연구에서는 Schultz(2007)가 발표한 Granville’s similarity-law scaling 절차에 기초하여 실선 7 m 크기 의 탱커 프로펠러에 표면 부착물 상태가 서로 다른 3가지 경우를 고려하여 프로펠러 단독 효율의 감소의 변화를 Lifting surface code를
사용하여 수치적 계산을 수행하여 효율을 비교하였다. 본 논문에서의 결과는 표면 거칠기가 큰 석회질 부착물(ks=0.001)은 선박 설계 속
도(J=0.5)에서 최대 15 %의 프로펠러 효율 감소를 보였음을 확인하였으며 이는 선박 운항 시 생물 부착에 의한 효율 감소에 대한 평가 가 고려되어야 한다는 점을 나타내고 있다.
핵심용어 : 선박 성능, 생물 부착, 표면 거칠기, 프로펠러 단독 효율, 경계층
1
1. Introduction
In today’s world, environmental and economic objectives in the maritime industry go hand-in-hand. It is a well-known fact that more than 90 % of the world’s goods are carried across the oceans by the shipping sector (ICS, 2015) and in a generally cost and energy efficient way due to its high efficiency and cargo safety in
Corresponding Author : [email protected], 061-240-7303
operation. Despite moving high volume of cargo, the shipping transport forms currently a smaller contribution (3.5 %) to the total volume of Green House Gas (GHG) than the land and aviation based transport systems (IMO, 2014). Waterborne transportation is therefore considered relatively low GHG emission when compared to other freight transportation. Despite this credit, since ocean shipping transportation covers the entire world, the International Maritime Organisation (IMO) recently introduced the guideline for ship designers to tackle marine-based GHG emission with an
Energy Efficiency Design Index (EEDI) and a future requirement for all vessels to carry a Ship Energy Efficiency Management Plan.
On the other hand, shipping companies have had their operating costs hit by ever rising oil prices. Fuel costs already amount to more than half of the operating cost in most fleets due to the high fuel price, thus ship owners are extremely keen to adopt any small improvements in transport efficiency in order to maintain the economic profitability.
Within this context, in order to design an environmentally sustainable ship and to maintain the economic profitability of the vessel, the vessel should be designed with a competitive hull form that offers minimal hull resistance together with an efficient propulsion system. Townsin (2003) mentioned that failure of biofouling control on ships increases the surface roughness of the hull which, in turn, caused frictional resistance and economic penalty either reduced speed at given input power or increased power to maintain a given speed. In order to understand the impact of surface roughness on full-scale ship resistance, Schultz (2007) proposed a simple prediction of full-scale resistance and powering made for antifouling coating systems with a range of roughness and fouling conditions, which is based on results from laboratory-scale measurements and boundary layer similarity law analysis utilized by Granville (1958, 1987). Schultz at al. (2011) later reported on the overall economic impact of biofouling on a naval surface ship and provided guidance for the strategies to combat hull fouling.
On the other hand, when the reduction in ship performance is associated with the condition of the ship hull, the effect of the propeller surface condition is often overlooked even the effect is significant. As stated by Svenson and Medhurst (1984), and Townsin et al. (1985), the effects of the propeller surface condition can be less important than the hull condition, but significantly more important in terms of energy loss per unit area. In economic terms, high return of a relatively cheap investment can be obtained by propeller maintenance.
Unfortunately the influence of propeller fouling on powering is not well established compared to biofouling on the hull surface since very little theoretical and experimental work was done on the subject. Based on the surface roughness analyses of the foul release coatings and computer simulations, Atlar et al. (2003) demonstrated the worthy of study on the effects of propeller roughness on ship powering stating that a typical medium sized tanker propeller coated by Intersleek 700 foul release coating can maintain the propeller blades free from major biofouling effect and hence can save up to 5-6 % compared to the propeller blades which are not
polished and hence subjected to surface deterioration at Grade F in the Rubert scale. Further investigations through full- scale trials with the Newcastle University ex-research vessel R/V Bernicia indicated that while the newly coated propeller did not show any additional saving over newly polished propeller, the coating was maintained almost 90 % intact over the R/V Bernicia propeller blades during more than 3 years and prevented major fouling attachment except some slime growth (Mutton et al., 2005).
However, it should be stated that no practical and simple prediction of propeller efficiency by the impact of fouling on propeller surface has been successfully addressed yet .As the continuation of the research on the effect of coating and biofouling on the marine propellers in Newcastle University further research has been set-up to transform the Schultz’s method for the hull application into propeller application. This paper provides the procedures including the effect of biofouling on a full-scale based on the similarity-law scaling procedure, with integration of a state-of-the-art lifting surface propeller analysis program which is an appropriate tool to predict the performance of a propeller. The performance analysis are made for the propeller in open water, assumed that propeller works at uniform axial stream, and the effect of hull efficiency and relative rotative efficiency are not considered in propeller’s efficiency. To investigate the effect of bio-fouling on the propeller performance predictions are made for a 100,000 DWT tanker with three “light slime”, “heavy slime” and
“small calcareous” fouling conditions. The details of fouling conditions and the values of equivalent sand roughness heights are based on the measurements of Schultz (2004).
2. Materials and methods
In this section, a method of prediction relating to frictional resistance of a propeller blade section using boundary layer laws is reviewed and a state-of-the-art numerical tool to predict the performance of a propeller in a given fouling condition is presented.
2.1 Review of algorithm for the extrapolation
The similarity between smooth and rough wall boundary layers was utilized by Granville (1958, 1987) to develop a similarity law scaling procedure. This procedure allows one to predict the impact of a given roughness on the frictional drag of a plate of arbitrary length based on laboratory-scale measurements of the frictional drag and roughness function of a plate covered with the same roughness. Granville’s similarity law scaling can be used to predict
the change in frictional drag of a blade section of a propeller in order to model the change in the frictional drag coefficient of the propeller itself. This is a reasonable assumption since the effect of the pressure gradient resulting from the three dimensionality of the actual propeller’s blade section is embodied in the correlation allowance, and the pressure drag of the blade section itself is not expected to be altered dramatically by the roughness. The algorithm developed by Schultz (2007) for the hull application is adopted to determine the increase in the skin friction coefficient of propeller blade section (∆CF) in various fouling conditions and the details of algorithm is given in his paper.
2.2 Prediction of open water efficiency using UPCA 91 UPCA91 (unsteady propeller cavitation analysis) software is based on the unsteady lifting surface theory of fixed-pitch propellers, modified especially to integrate time dependent cavitation phenomena into the lifting surface model. The calculation, in this study, is made for the propeller in open water, i.e. the wake data entered corresponding to a uniform axial stream and transverse wake components were set equal to zero. The effect of cavitation, if any, is suppressed by inputting a high value of the shaft centre-line immersion. In UPCA 91, in common with most propeller design and analysis procedure, the effects of blade drag are accounted for by inputting appropriate blade section drag coefficients usually denoted by the term, CD. In the present the drag coefficients corresponding to a new or hydraulically smooth propeller were taken from Burrill (1955-1956) and denoted by CD-smooth. The increase in frictional resistance coefficient of propeller blade section due to fouling can be obtained by the above proposed algorithm.
The increase in blade section drag coefficient, i.e. the sum of frictional and from resistance, is then given by for each radius:
ΔCD-fouling = 2(1+t/c)ΔCF (1)
Where t is the maximum thickness of the blade section and c is the chord length.
CD in fouling condition would then be given by
CD-fouling = CD-smooth + ΔCD-fouling (2)
With the obtained drag coefficient corresponding to fouling condition these values were used as input data into UPCA 91 software to derives the values of thrust (T) and torque (Q) at each J (advance coefficient) condition. The non-dimensional terms of the
calculated values of J, KT (thrust coefficient), KQ (torque coefficient) and ηO (open water efficiency) can be defined as
(3)
(4)
(5)
(6)
Where D is the diameter of propeller, V to the speed of advance of propeller and ρ is the density of water (m2/s).
3. Selection of propeller and fouling condition
3.1 Selection of propeller
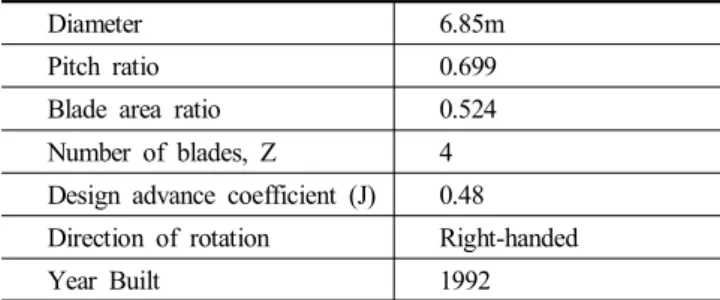
To investigate the effect of fouling on the propeller performance a existing 100,000 DWT tanker which has a single screw fixed pitch propeller is chosen with the following main particulars shown in Table 1 and details of propeller geometry is given in Table 2.
Diameter 6.85m
Pitch ratio 0.699
Blade area ratio 0.524
Number of blades, Z 4
Design advance coefficient (J) 0.48 Direction of rotation Right-handed
Year Built 1992
Table 1. Main particulars of selected propeller
r/R P/D Chord (m) Skew(m) Thickness(m)
0.2 0.62 1.34 -0.06 0.28
0.3 0.65 1.56 -0.09 0.24
0.4 0.67 1.75 -0.11 0.20
0.5 0.69 1.90 -0.91 0.16
0.6 0.71 2.00 -0.01 0.13
0.7 0.73 2.00 0.13 0.09
0.8 0.73 1.87 0.32 0.06
0.9 0.71 1.48 0.59 0.04
1.0 0.67 0.00 0.93 0.00
Table 2. Details of the propeller geometry
3.2 Test condition
In order to assess the efficiency performance of the propeller, the numerical predictions are performed to cover a practical range of advance coefficient (J), under the inflow speed (V) which is kept at 5.651 m/s. By adjusting the rotational speed of the propeller (n), the advance coefficients are obtained. Reynolds number based on resultant velocity at 0.7R are defined as
Re =
(7)
Where C0.7R is the chord length at 0.7R and ν is the kinematic viscosity of water (m2/s).
J n (rps) Re at 0.7R
0.3 2.750 7.057E+07
0.4 2.063 5.331E+07
0.5 1.650 4.301E+07
0.6 1.375 3.623E+07
0.7 1.179 3.144E+07
Table 3. Test conditions
3.3 Biofouling conditions
Three different fouling conditions are considered for the tanker propeller to determine the increase of frictional resistance as compared to a new or hydraulically smooth propeller. The fouling cases are included “light slime”, “heavy slime” and “small calcareous” fouling conditions. Table 4 shows the values of equivalent sand roughness height (ks) for the fouling condition which are based on Schultz (2004) data.
Description of condition ks (m)
Light slime 0.0001
Heavy slime 0.0003
Small calcareous fouling 0.001
Table 4. The equivalent value of sand roughness height (ks)
In present study, the fouling is assumed to have an uniform distribution over the entire propeller blade.
4. Numerical Prediction
4.1 Prediction of increase in frictional resistance
As an example, the effect of fouling on the propeller blade was
examined at 0.7R section as representative. But this process should be repeated over the entire blade. In order to apply the algorithm it requires a number of inputs as shown in Table 5. First of all, there is a need to determine roughness height (ks) values of fouling conditions as shown in Table 4. The inflow speed and propeller rotation should be specified to determine the Reynolds number with the resultant velocity. The chord length of blade section is also needed as well as the Von karman constant k (0.41) and the length of the laboratory test plate (1.52 m).
Roughness heights (m)
Chord length (m) 2.005
Lplate (m) 1.52
k 0.41
Inflow speed (m/s) at propeller plane 5.65
Rps at J=0.50 1.60
Kinematic fluid viscosity (m2/s) 0.897E-06
Reynolds number 4.301E+07
Table 5. Input data at 0.7R
Based on the Schultz’s algorithm developed for the hull application prediction for the three fouling conditions were conducted for 5 different operating conditions corresponding from J=0.3 to 0.7 at 0.7R radius and the results are given in Table 6.
The increase of frictional resistance coefficient (ΔCF) on the blade is quite severe in the small calcareous fouling compared to other slime and this will affect the blade section drag coefficient and open water efficiency.
J smooth light slime heavy slime small calcareous fouling
0.3 0.00 0.00183 0.00289 0.00456
0.4 0.00 0.00174 0.00280 0.00447
0.5 0.00 0.00159 0.00273 0.00439
0.6 0.00 0.00150 0.00267 0.00434
0.7 0.00 0.00145 0.00261 0.00428
Table 6. Increase in frictional resistance coefficient (ΔCF) due to fouling at 0.7R
4.2 Calculation of blade section drag coefficient and propeller efficiency
The increase in blade section drag coefficient (ΔCD) can be calculated using the equation (1). As an example, the increase in propeller blade section drag due to the effect of fouling conditions at 0.7R with operating at J=0.5 is given in Table 7.
A Study on the Hydrodynamic Effect of Biofouling on Marine Propeller
- 127 -
Condition t/c ΔCF ΔCD
light slime
0.04663
0.00159 0.00333
heavy slime 0.00273 0.00571
small calcareous fouling 0.00439 0.00920
Table 7. Increase in drag coefficient due to fouling at 0.7R
The increase in CD due to fouling would then be calculated using equation (2).
J
CD CD-fouling
smooth light slime
heavy slime
small calcareous fouling
0.3 0.00838 0.0122 0.0144 0.0179
0.4 0.00838 0.0120 0.0142 0.0177
0.5 0.00838 0.0117 0.0141 0.0176
0.6 0.00838 0.0115 0.0140 0.0174
0.7 0.00838 0.0114 0.0138 0.0173
Table 8. Drag coefficient at 0.7R due to the effect of fouling
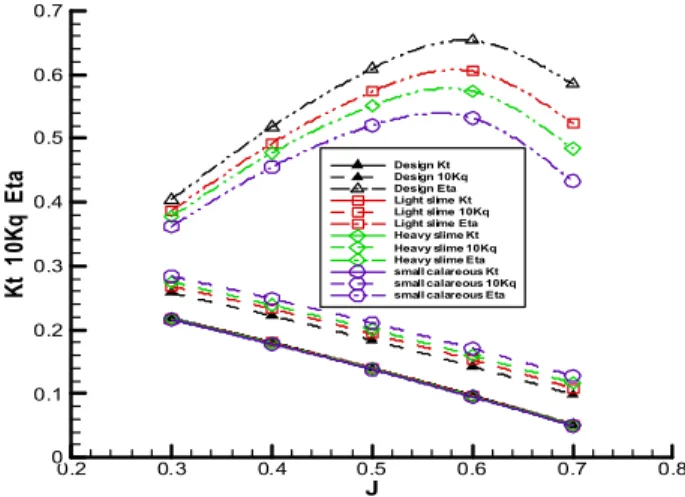
With the obtained drag coefficient corresponding to fouling condition these values were used as input data into UPCA 91 software to derives the values of thrust and torque at each J condition. The non-dimensional terms of the calculated values of KT , KQ and ηO (open water efficiency) is plotted to a base of J as given in Fig.1. It can be seen that the predominant effect of blade roughening due to fouling is an increase in the propeller torque.
The accompanying decrease in propeller thrust is too small to be obvious on the scale of the Fig. 1. Therefore the decrease of propeller efficiency is mainly caused by the increase of propeller torque and small calcareous fouling shows the significant drop of efficiency among selected roughness conditions.
J
Kt10KqEta
0.2 0.3 0.4 0.5 0.6 0.7 0.8
0 0.1 0.2 0.3 0.4 0.5 0.6 0.7
Design Kt Design 10Kq Design Eta Light slime Kt Light slime 10Kq Light slime Eta Heavy slime Kt Heavy slime 10Kq Heavy slime Eta small calareous Kt small calareous 10Kq small calareous Eta
Fig. 1. Propeller open water efficiency with different fouling.
Table 9 shows the loss in propeller efficiency with surface roughening to a base of J and is defined by
Efficiency Loss (%) =[ (ηO-smooth - ηO-fouling ) / ηO-smooth] × 100 (8)
It can be seen that the efficiency loss increases with increasing J due to the decreasing magnitude of the propeller forces as opposed to the section drag which becomes a large proportion of the total energy losses. The service performance data on trials for the tanker propeller shows that the propeller was working at about J=0.5. From the Table 9 it can be seen that at that J value the efficiency losses are about 5.8 % 9.5 % and 14.6 % for surface roughness condition represented by light slime, heavy slime and small calcareous fouling, respectively.
J
% Loss in efficiency smooth light
slime
heavy slime
small calcareous fouling
0.3 0.00 4.43 6.84 10.45
0.4 0.00 4.99 7.88 12.10
0.5 0.00 5.84 9.46 14.55
0.6 0.00 7.32 12.11 18.50
0.7 0.00 10.42 17.38 26.10
Table 9. Loss in efficiency of propeller due to the effect of fouling
5. Conclusions
This paper involves the numerical procedure to take into account the effect of biofouling on the performance of a full-scale propeller in open water. The algorithm is based on the application of Schultz’s methodology, which is proposed to formulate the effect of ship hull coating and biofouling, to the formulation of propeller biofouling. The developed algorithm, which is integrated with an in-house lifting surface code, was first applied to an existing tanker propeller in full-scale. Based on the work carried out in this study, the following overall conclusions can be reached:
1) A new computational propeller performance analysis tool accounting for the propeller blade roughness was developed to investigate the effect of biofouling on the performance of a propeller and was applied to an existing tanker propeller to demonstrate the application of the new algorithm to predict the effect of biofouling varying from light slime to calcareous fouling condition on the performance of the propeller.
2) In the same case study it was also found that the effect of fouling could be significant depending on the rate of fouling.
Whilst a heavy slime at the operating condition may cause 9.5%
loss in the propeller’s efficiency this loss can be as high as 14.6%
for the calcareous fouling at the operating condition.
3) The analysis of the numerical predictions for all the case studies show that the predominant effect of an increase in the roughness of the propeller blades due to fouling is an increase in the propeller torque whilst the decrease in the thrust is insignificant.
4) In summary, the investigation showed that significant losses in open water efficiency resulting from surface roughening can be regained by cleaning and polishing of the blades as smooth as possible.
Acknowledgement
This paper was supported by Research Fund, Mokpo National Maritime University Industry-Academic Cooperation Foundation and sponsored by the EU-FP7 project TARGETS (GN-266008).
The authors therefore gratefully acknowledged the above contributions making this research possible.
References
[1] Atlar, M., E. J. Glover, R. Mutton and C. D. Anderson(2003), Calculation of the Effects of New Generation Coatings on High Speed Propeller Performance, 2nd Intl Warship Cathodic Protection Symposium and Equipment Exhibition, Cranfield University, Shrivenham.
[2] Burrill, L. C.(1955-1956), The optimum diameter of marine propellers: A new design approach, Trans, N.E.C.I.E.S., Vol.
72, pp. 61-73.
[3] Granville, P. S.(1958), The frictional resistance and turbulent boundary layer of rough surfaces, J Ship Res, Vol. 2, pp.
52-74.
[4] Granville, P. S.(1987), Three indirect methods for the drag characterization of arbitrarily rough surfaces on flat plates, J Ship Res, Vol. 31, pp. 70–77.
[5] ICS(2015), International Chamber of Shipping, http://www.ics -shipping.org/shipping-facts/shipping-and-world-trade (accessed on 06/12/2015).
[6] IMO(2014), International Maritime Organization, Third IMO GHG Study, London, International Maritime Organization.
[7] Mutton, R. J., M. Atlar, M. Downie and C. D. Anderson (2005), Drag Prevention Coatings for Marine Propellers, 2nd International Symposium on Seawater Drag Reduction, Busan, Korea.
[8] Schultz, M. P.(2004), Frictional resistance of antifouling coating systems, ASME J Fluids Eng, Vol. 126, pp.
1039-1047.
[9] Schultz, M. P.(2007), Effects of coating roughness and biofouling on ship resistance and powering, Biofouling, Vol.
23, pp. 331-341.
[10] Schultz, M. P., J. A. Bendick, E. R. Holm and W. M. Hertel (2011), Economic impact of biofouling on a naval surface ship, Biofouling, Vol. 27, pp. 87-98.
[11] Svensen, T. E. and J. S. Medhurst(1984), A simplified method for the asessment of propeller roughness penalties, Marine Technology, Vol. 21. No. 1, pp. 41-48.
[12] Townsin, R. L., D. S. Spencer, M. A. Mosaad and G. Patience (1985), Rough propeller penalties, SNAME transactions 1985, Vol. 93, pp. 165-187.
[13] Townsin, R. L.(2003), The ship hull fouling penalty, Biofouling, Vol. 19, pp. 9-15.
Received : 2015. 10. 23.
Revised : 2015. 12. 07. (1st) : 2015. 12. 15. (2nd) Accepted : 2016. 02. 25.