• 검색 결과가 없습니다.

Land Cover Classification of RapidEye Satellite Images Using Tesseled Cap Transformation (TCT)

N/A
N/A
Protected

Academic year: 2021

Share "Land Cover Classification of RapidEye Satellite Images Using Tesseled Cap Transformation (TCT)"

Copied!
10
0
0

로드 중.... (전체 텍스트 보기)

전체 글

(1)

1. Introduction

A land cover map conveys essential spatial information generated by categorizing the physical form of objects or an area according to specific criteria and by classifying areas having the same characteristics (Ministry of Environment, 2017). Therefore, land cover maps are used as basic data in various application fields such as environmental impact assessment, terrain monitoring, and impervious surface analysis. Because terrain can change rapidly owing to land development, image data of a relevant region is commonly acquired

through satellite images or aerial photographs, and then, a land cover map is generated using this data. In Korea, small-scale land cover maps are produced through a supervised classification method based on satellite images, and large-scale ones are mainly produced through image interpretation and digitizing methods based on aerial photographs and satellite images. The RapidEye satellite image has small temporal resolution and wide swath width, making it effective for monitoring terrain and producing and updating various theme maps and spatial information. RapidEye satellite images afford advantages in analyzing topographic

Land Cover Classification of RapidEye Satellite Images Using Tesseled Cap Transformation (TCT)

Hogyung Moon*, Taeyoung Choi*, Guhyeok Kim**, Nyunghee Park**, Honglyun Park** and Jaewan Choi**

*Division of Conservation Ecology, National Institute of Ecology

**School of Civil Engineering, Chungbuk National University

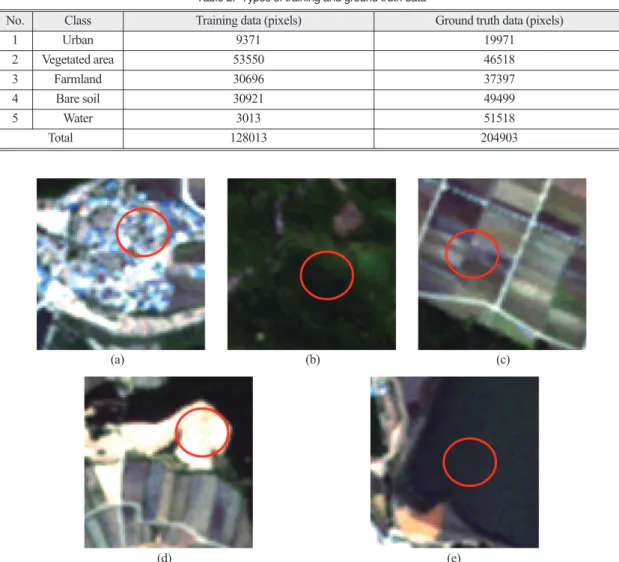
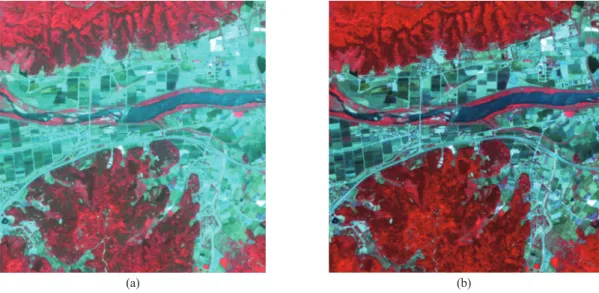
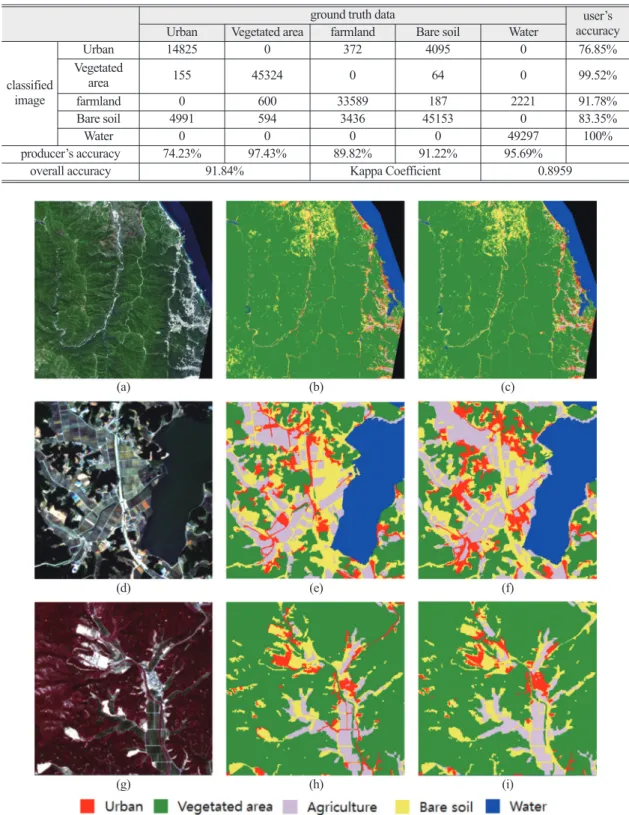
Abstract : The RapidEye satellite sensor has various spectral wavelength bands, and it can capture large areas with high temporal resolution. Therefore, it affords advantages in generating various types of thematic maps, including land cover maps. In this study, we applied a supervised classification scheme to generate high- resolution land cover maps using RapidEye images. To improve the classification accuracy, object-based classification was performed by adding brightness, yellowness, and greenness bands by Tasseled Cap Transformation (TCT) and Normalized Difference Water Index (NDWI) bands. It was experimentally confirmed that the classification results obtained by adding TCT and NDWI bands as input data showed high classification accuracy compared with the land cover map generated using the original RapidEye images.

Key Words : Land cover map, NDWI, TCT, RapidEye

Received February 10, 2017; Revised February 14, 2017; Accepted February 20, 2017.

Corresponding Author: Jaewan Choi ([email protected])

This is an Open-Access article distributed under the terms of the Creative Commons Attribution Non-Commercial License (http://creativecommons. org/licenses/by-nc/3.0) which permits unrestricted non-commercial use, distribution, and reproduction in any medium, provided the original work is properly cited

Article

(2)

vegetation, because they can acquire red edge bands along with the blue, green, red, and Near-InfraRed (NIR) bands obtainable using most multispectral sensors. Therefore, many studies have used RapidEye satellite images for classifying the land cover characteristics of terrain and for analyzing vegetated areas such as agricultural land and forest. Park et al.

(2013) generated an impervious map of Cheongju using RapidEye satellite images and compared its quality with that of the map produced by the Ministry of Environment. Hese et al. (2011) generated an impervious surface map by integrating TerraSAR-X data, RapidEye data, and DEM data. Hong et al. (2012) used RapidEye satellite images to estimate rice field areas in North Korea and analyzed the variance between reference data and the predicted model. Jo (2012) applied the Iterative Self-Organizing Data Analysis Technique (ISODATA) to extract water bodies from RapidEye images. Kim and Yeom (2012) generated land cover map images from MODIS, LANDSAT, and RapidEye images and analyzed the correlation with the surface temperature of urban areas. Ustuner et al. (2015) conducted object-based supervised classification of RapidEye satellite images using a Support Vector Machine (SVM) classifier and evaluated the classification accuracy by their proposed algorithm.

Huth et al. (2012) developed the TWinned Object and Pixel-based Automated classification Chain (TWOPAC) algorithm and applied it to RapidEye images. Schönert et al. (2014) have already empirically extracted the coefficients of Tasseled Cap Transformation (TCT) for RapidEye satellite images.

Many studies have focused on generating various types of thematic maps, including land cover maps, by using RapidEye satellite images. However, they have focused on applications rather than on developing technologies or improving the classification accuracy. These studies have mainly focused on specific land cover and feature extraction. Therefore, in this manuscript, we applied to additional bands based on RapidEye images in order to

improve the overall accuracy of supervised classification. At first, we extracted the Normalized Difference Water Index (NDWI), and the brightness, greenness, and yellowness bands of TCT. And then, object-based SVM classifier are applied by using additional data, after segmentation of RapidEye image.

The effectiveness of additional data in image classification is evaluated by comparing to classification result of original RapidEye image.

2. Study Area and Data

The RapidEye satellite sensor is an optical remote sensing sensor that was launched on August 29, 2008.

Five identical satellites observe Earth simultaneously;

they have a short temporal resolution of 5-6 days and a wide swath of 77 km. Therefore, images can be acquired quickly in the area of interest. Table 1 shows details of the RapidEye sensor.

For the experiment, RapidEye image of Goseong- gun and Gangwon-do, which were acquired on May 23, 2015, is used. It includes forest areas, agricultural land, residential areas, and water bodies. Fig. 1 shows an overview of the experimental image. To perform supervised classification, five classes were selected:

urban area, vegetated area, farmland, bare soil, and water body. Training and ground truth data were selected through visual interpretation (Table 2).

In general land cover mapping, vegetated areas can be subdivided into grassland, broadleaf forest, and

Table.1. RapidEye satellite system characteristics

Number of satellites 5

Sensor type Multispectral pushbroom imager Spectral bands (nm)

Blue : 440-510 Green : 520-590

Red : 630-685 Red edge : 690-730

NIR : 760-850 Spatial resolution (m) 6.5 (nadir)

Pixel size (m) 5 (ortho-rectified)

Swath width (km) 77

(3)

coniferous forest. However, because the area used in this study mainly consists of mixed vegetation, the class was determined only for the vegetated area. In addition, wetland class was not considered because it did not exist in the experimental area. Fig. 2 shows an example of training data for each class.

3. Methodology

To generate a land cover map with high spatial resolution using RapidEye satellite images, additional bands were created for use as input data for Fig. 1. Study site.

Table 2. Types of training and ground truth data

No. Class Training data (pixels) Ground truth data (pixels)

1 Urban 9371 19971

2 Vegetated area 53550 46518

3 Farmland 30696 37397

4 Bare soil 30921 49499

5 Water 3013 51518

Total 128013 204903

Fig. 2. Example of training data : (a) urban, (b) vegetated area, (c) farmland, (d) bare soil and (e) water body.

(d) (e)

(a) (b) (c)

(4)

classification. After image segmentation, object-based supervised classification was performed using original image and additional bands. Fig. 3 shows the workflow of the proposed technique.

1) Atmospheric Correction

For supervised classification, the Digital Number (DN) of the RapidEye image should be converted to spectral reflectance data. Especially, to apply TCT and NDWI to RapidEye images, the images should be converted into spectral reflectance information. For this purpose, we performed atmospheric correction on the RapidEye image using the ATmospheric CORrection

(ATCOR) program and converted the DN value into spectral reflectance data for the land cover (Richter and Schläpfer, 2002). ATCOR is a representative atmospheric correction module for satellite images. It is used to generate the spectral reflectance for a material by removing the atmospheric influence present in the satellite image acquisition process. Fig. 4 shows the images before and after the atmospheric correction of the RapidEye satellite images; it can be seen that the haze is efficiently removed after the atmospheric correction.

2) TCT for RapidEye

To improve the classification accuracy in the supervised classification of RapidEye satellite images, additional information is needed along with the inherent multispectral bands. For this purpose, we applied TCT to RapidEye satellite images to generate additional brightness, yellowness, and greenness bands, and we used them as supervised classification input data (Schönert et al., 2014). TCT is a representative spectral transformation technique that is used in the field of remote sensing; it was originally proposed by Kauth and Thomas (1976). The feature bands by TCT explain the reflection characteristics of vegetation

Fig. 4. RapidEye imagery (a) before and (b) after atmospheric correction.

(a) (b)

Fig. 3. Workflow.

(5)

according to the seasonal cycle by extracting axes represented by the reflection characteristics of soil and vegetation. TCT derives bands related to vegetation growth such as brightness, greenness, wetness, and yellowness using the spectral transformation of the band from the visible to the ShortWave InfraRed (SWIR) wavelength region. The TCT matrix is generally extracted empirically, and TCT matrices have been proposed for satellite images such as LANDSAT TM and ETM+. Schönert et al. (2014) extracted the similarity by using LANDSAT and RapidEye satellite images acquired simultaneously, and they extracted the TCT matrix of RapidEye images with characteristics similar to the TCT band of LANDSAT images.

Furthermore, because RapidEye satellite images do not have an SWIR band, the TCT consists of three main components: brightness, greenness, and yellowness.

The brightness band shows similar brightness values to panchromatic band; the yellowness band tends to have a high value for bare soil; and the greenness band reflects the characteristics of vegetation and is similar to the Normalized Difference Vegetation Index (NDVI). Table 3 shows the results of the TCT matrix proposed by Schönert et al. (2014) for the RapidEye satellite image, and Fig. 5 shows an example of the

result of applying the proposed TCT matrix to the experimental area.

As shown in Fig. 5(b)-5(d), in the yellowness and brightness bands, some bare soil has very high brightness values, and in the greenness band, vegetation areas have high brightness values. As shown in Table 3 and Fig. 5(b), the brightness band is similar to that of the satellite image because it is a weighted average of five bands in the RapidEye image. Therefore, it was judged that TCT bands could have advantages in classifying vegetation and bare soil.

3) NDWI

TCT of RapidEye satellite images did not include a wetness band, in contrast with TCT of LANDSAT satellite images. In this study, NDWI was additionally generated to improve the classification accuracy of water areas. NDWI is based on Eq. (1), and Fig. 6 shows the results of its application to RapidEye satellite images. The NDWI band together with each TCT band is used as input data for supervised classification.

NDWI =

(1) where NIR and green refer to the NIR and green

green - NIR green + NIR

Fig. 5. (b) brightness, (c) yellowness and (d) greenness band of TCT acquired from (a) original RapidEye image.

(a) (b) (c) (d) Table 3. coefficients for TCT

Blue Green Red Red edge NIR

Brightness 0.2435 0.3448 0.4881 0.4930 0.5835

Yellowness -0.7564 -0.3916 0.5049 0.1400 0.0064

Greenness -0.2216 -0.2319 -0.4622 -0.2154 0.7981

(6)

bands, respectively, of RapidEye images.

4) Object-based Supervised Classification by Using SVM

Object-based supervised classification was performed using the original RapidEye image with the TCT and NDWI bands subjected to atmospheric correction. First, we applied the image segmentation technique to RapidEye satellite images. In this study, we applied the multiresolution segmentation technique proposed by Baatz and Schäpe (2000). The corresponding technique is an algorithm implemented in eCognition software, which is a representative object-based image analysis software. The multiresolution segmentation algorithm is a technique

for determining the optimal object size by color, shape, compactness, and scale parameter. For the effective segmentation process, RapidEye image is transformed to the 8-bit dynamic range before applying segmentation. The parameters used for image segmentation should be empirically determined according to the characteristics of the image, and scale, shape, and compactness values of 30, 0.2, and 0.5, respectively, are used. Fig. 7 shows the result of the image segmentation for RapidEye data, and it can be confirmed that the objects for the non-region are divided effectively.

Supervised classification according to each segmented object was performed by the SVM method, a typical machine-learning technique. SVM is a Fig. 6. Examples of (b) NDWI image by (a) RapidEye image.

(a) (b)

Fig. 7. (a) RapidEye image and (b) segmentation result of (a).

(a) RapidEye image (b) segmented image

(7)

technique for determining the optimal hyperplane that can separate each class of training data in the multidimensional space for each class (Mountrakis et al., 2011). The optimal hyperplane for each class should maximize the distance between the data closest to the hyperplane, and the SVM computes the optimal hyperplane through an optimization technique. On the other hand, when the boundaries between classes are nonlinear, it is impossible to generate the optimal hyperplane. Therefore, in the optimization process, data on the input space are transformed into the feature space by a kernel function to perform classification.

Various types of kernel functions can be used in the SVM, such as polynomial, Radial Basis Function (RBF), and sigmoid, and the appropriate function can be selected according to the data characteristics. In this study, an SVM classifier with an RBF kernel of 0.2 gamma and penalty cost variable of 400 is applied, because the RBF kernel is known to be effective in classifying remotely sensed image (Choi et al., 2006;

Ustuner et al., 2015).

4. Experimental Results and Discussion

To evaluate the usefulness of the TCT and NDWI bands used in this study, image classification was performed for the experimental data shown in Fig. 1.

In order to analyze the effectiveness of NDWI and TCT

bands in image classification, the classification result obtained using the original image and the original image with TCT and NDWI bands added were compared and evaluated. To quantitatively evaluate the classification results, an error matrix was generated based on the ground truth data in Table 2. Tables 4 and 5 show the accuracy evaluation results. The results of supervised classification using the original RapidEye image showed total accuracy of 86.18% and Kappa coefficient of 0.8246. On the other hand, the results of image classification using the proposed technique showed overall accuracy of 91.84% and Kappa coefficient of 0.8959. This means that the accuracy of supervised classification can be improved by adding the TCT and NDWI bands. The classification result using the original image shows high commission error in urban areas (Table 4). In the case of vegetation, all results were good, indicating that the red edge band of the RapidEye image plays an effective role in classifying vegetated areas. However, the proposed method showed higher classification accuracy for farmland and bare soil. The yellowness and greenness bands showed improved classification accuracy for the class. Especially, it can be confirmed that the omission error is greatly reduced compared with the classification result obtained using the original image.

For a water body, it is confirmed that the result of the proposed method slightly reduces the omission error compared with the result using the original image. On Table 4. Classification result by original RapidEye imagery

ground truth data user’s

accuracy

Urban Vegetated area farmland Bare soil Water

classified image

Urban 14856 0 1037 10200 1230 54.37%

Vegetated

area 155 45324 0 64 250 98.98%

farmland 207 600 28909 0 1767 91.82%

Bare soil 4753 594 7451 39235 0 75.40%

Water 0 0 0 0 48271 100%

producer’s accuracy 74.39% 97.43% 77.30% 79.26% 93.70%

overall accuracy 86.18% Kappa Coefficient 0.8246

(8)

Fig. 8. Classification result by RapidEye imagery with additional bands : (a) RapidEye image(true color composite), (b) classification result by original RapidEye image, (c) classification result by proposed method, (d) 1

st

Detailed image(true color composite), (e) 1

st

Details of classification result by original RapidEye image, (f) 1

st

Detalis of classification result by proposed method, (g) 2

nd

Detailed image(false color composite), (h) 2

nd

Details of classification result by original RapidEye image and (i) 2

nd

Detalis of classification result by proposed method.

(a) (b) (c)

(d) (e) (f)

(g) (h) (i) Table 5. Classification result by RapidEye imagery with additional bands

ground truth data user’s

accuracy

Urban Vegetated area farmland Bare soil Water

classified image

Urban 14825 0 372 4095 0 76.85%

Vegetated

area 155 45324 0 64 0 99.52%

farmland 0 600 33589 187 2221 91.78%

Bare soil 4991 594 3436 45153 0 83.35%

Water 0 0 0 0 49297 100%

producer’s accuracy 74.23% 97.43% 89.82% 91.22% 95.69%

overall accuracy 91.84% Kappa Coefficient 0.8959

(9)

the other hand, the proposed method showed relatively high commission error for urban areas, which is considered to be improved through object-based post- processing.

Fig. 8 shows the classification result images for qualitative comparison evaluation. Fig. 8(e)-8(f) confirm that the results of the proposed method show that the misclassification of urban and bare soil is reduced compared with the classification result obtained using the original image. Furthermore, Fig.

8(h)-8(i) confirm that the proposed method can effectively classify farmland. On the other hand, Fig.

8(h)-8(i) show that when using the original image, road areas are classified as urban areas; however, the proposed technique is classified as bare soil. In the experimental area, the road area is mixed with bare soil and asphalt, and it is confirmed that some errors occur in all classification results.

5. Conclusion

In this study, TCT and NDWI bands were extracted from RapidEye satellite images and added as object- based supervised classification input data to improve the classification accuracy. As a result of the quantitative comparison evaluation with the classification result using the original image, it was confirmed that the overall accuracy improvement was about 5%. In addition, the classification results obtained using the original image overestimated the urban area, and those obtained using the proposed method showed that the overestimation of the urban area was reduced.

We also confirmed that the overall classification accuracy was improved for all classes. Therefore, it was considered that the proposed method can effectively generate a land cover map by using RapidEye satellite images. However, when using the proposed technique, some commission errors were generated in urban areas.

Therefore, research is needed to improve the

classification accuracy and optimize the parameter of image segmentation and SVM classifier in the future.

Acknowledgment

This research was supported by the Ministry of Environment, which is “Special zones(baekdudaegan and DMZ) Precision Survey(20160132142)”

References

Baatz, M. and A, Schäpe, 2000. Multi-resolution segmentation - An optimization approach for high quality multi-scale image segmentation, In: Strobl, J., Blaschke, T., Griesebner, G.

(Eds.), Angewandte Geographische Informations Verarbeitung XII. Wichmann- Verlag, Heidelberg, 12-23.

Choi, J.W., Y.G. Byun, Y.I. Kim, and K.Y. Yu, 2006, Support vector machine classification of hyperspectral image using spectral similarity kernel, Journal of The Korean Society for Geo- Spatial Information System, 14(4): 71-77 (in Korean with English abstract).

Hese, S., M. Lindner, M. Voltersen, and C. Berger, 2011. TerraSAR-X and RapidEye data for the parameterisation of relational characteristics of urban ATKIS DLM objects, International Archives of the Photogrammetry, Remote Sensing and Spatial Information Sciences, Volume XXXVIII-4/W19.

Hong, S.Y., B.K. Min, J.M. Lee, Y. Kim, and K. Lee, 2012. Estimation of paddy field area in North Korea using RapidEye images, Korean Journal of Soil Science and Fertilizer, 45(6): 1194-1202 (in Korean with English abstract).

Jo, M.H., 2012. A study on the extraction of a river from

the RapidEye image using ISODATA

(10)

algorithm, Journal of the Korean Association of Geographic Information Studies, 15(4): 1- 14 (in Korean with English abstract).

Kauth, R.J. and G.S. Thomas, 1976. The tasseled cap - a graphic description of the spectral temporal - development of agricultural crops as seen by Landsat, In Proc. of the Symposium on Machine Processing of Remotely Sensed Data, West Lafayette, Indiana, Jun. 29-Jul. 1, 159, pp.

5079-5101.

Kim, H.O. and J.M. Yeom, 2012. Effect of the urban land cover types on the surface temperature:

Case study of Ilsan New city, Korean Journal of Remote Sensing, 28(2): 203-214 (in Korean with English abstract).

Ministry of Environment, 2017. Environment spatial information service, http://egis.me.go.kr Mountrakis, G., J. Im, and C. Ogole, 2011. Support

vector machines in remote sensing: A review, ISPRS Journal of Photogrammetry and Remote Sensing, 66(3): 247-259.

Park, H.L., J.W. Choi, and S.K. Choi, 2014. Impervious

surface mapping of Cheongju by using RapidEye satellite imagery, Journal of the Korean Society for Geospatial Information System, 22(1): 71-79 (in Korean with English abstract).

Richter, R. and D. Schläpfer. 2002. Geo-atmospheric processing of airborne imaging spectrometry data. Part 2: atmospheric/topographic correction, International Journal of Remote Sensing, 23(13): 2631-2649.

Schönert, M., H. Weichelt, E. Zillmann, and C. Jürgens, 2014, Derivation of Tasseled Cap coefficients for RapidEye data, In Proc. of Earth Resources and Environmental Remote Sensing/GIS Applications V, Amsterdam, Netherlands, Sep.

22, 9245.

Ustuner, M., F.B. Sanli, and B. Dixon, 2015.

Application of support vector machines for

landuse classification using high-resolution

RapidEye images: A sensitivity analysis,

European Journal of Remote Sensing, 48: 403-

422.

수치

Fig. 2.  Example of training data : (a) urban, (b) vegetated area, (c) farmland, (d) bare soil and (e) water body.
Fig. 3.  Workflow.
Fig. 5.  (b) brightness, (c) yellowness and (d) greenness band of TCT acquired from (a) original RapidEye image.
Fig. 8.  Classification result by RapidEye imagery with additional bands : (a) RapidEye image(true color composite), (b) classification result by original RapidEye image, (c) classification result by proposed method, (d) 1 st Detailed image(true color comp

참조

관련 문서

Keywords : Climate change, Risk assessment, National adaptation strategy, Natural ecosystem, Land

M., 2012, A study on object-based image analysis methods for land cover classification in agricultural areas, Journal of the Korean Association of

Mapping land cover from detailed aerial photography data using textural and neural network analysis, International Journal of Remote Sensing, 28(7): 1625-1642..

The LC map was produced as follows: (1) PCA was based on using the GOCI NDVIs to select PCs; (2) to produce an unlabeled map, the K- means clustering was conducted using PCs

Examples of image segmentation with object boundaries of land cover map: (a) urban, (b) dry field, and (c) paddy field... 또한, 시가지역은 건물의 지붕과 벽면의

The study on land cover classification of hyperspectral image using Decision Tree Method, Master’s thesis, Chonbuk National University (서진 재. Decision

A few approaches after classifying by a few approaches based on SAM(Spectral Angle Mapper) supervised classification were applied for extracting optimal

Machine learning techniques(i.e., random forest and support vector machines/regression) were used for land cover change classification and forest carbon